Automatic Classification for Fruits’ Types and
Identification of Rotten Ones using k-NN and SVM
https://doi.org/10.3991/ijoe.v15i03.9832
Ann Nosseir(*)
Institute of National Planning, Nasr City, Cairo The British University in Egypt, Cairo, Egypt
Seif Eldin Ashraf Ahmed The British University in Egypt, Cairo, Egypt
Abstract—Having a system that classifies different types of fruits and identi-fies the quality of fruits will be of a value in various areas especially in an area of mass production of fruits’ products. This paper presents a novel system that differentiates between four fruits types and identifies the decayed ones from the fresh. The algorithms used are based on the colour and the texture features of the fruits’ images. The algorithms extract the RGB values and the first statisti-cal order and second statististatisti-cal of the Gray Level Co-occurrence Matrix (GLCM) values. To segregate between the fruits’ types, Fine, Medium, Coarse, Cosine, Cubic, and Weighted K-Nearest Neighbors algorithms are applied. The accuracy percentages of each are 96.3%, 93.8%, 25%, 83.8%, 90%, and 95% respectively. These steps are tested with 46 pictures taken from a mobile phone of seasonal fruits at the time i.e., banana, apple, and strawberry. All types were accurately identifying. To tell apart the decayed fruits from the fresh, the linear and quadratic Support Vector Machine (SVM) algorithms differentiated be-tween them based on the colour segmentation and the texture feature algorithms values of each fruit image. The accuracy of the linear SVM is 96% and quadrat-ic SVM 98%.
Keywords—Image Processing, classification, fruits detection
1
Introduction
Research [1,2,3,4,5,7,8,9,10,11, and 12] has been done in the area of image pro-cessing and classifying fruits and vegetables to support work in the domains of agri-culture automation and robotic fruit harvesting. Harvesting, for example, involves steps like identifying the ripped fruit and vegetable to collect, separating between different types and recognizing infected or decayed ones to isolate [6,7,8,9,10,11, and12]. Developing a system that differentiates between the fruits and vegetables types and their quality adds to this area.
a results the products’ prices cannot be known. This delays the process of paying at the cashier. Customers have to wait till an employer goes and checks the price of the product on the shelve. A system that takes a picture of the product and identifies the product and consequently tell the price can solve this problem. This can as well sup-port visually impaired and blind people to pick up the right fruits and the vegetables and know the cost of each [13].
This work presents a new system that initially categorizes four types of fruits namely banana, strawberry, mango and apple. For each type, it recognizes the de-cayed fruits from the fresh. The algorithms make the differentiations based on the colour and texture. The classification of the fruits’ types is done with the K-Nearest Neighbors algorithms and Support Vector Machine (SVM) algorithms are applied to separate the rotten ones. The accuracy of each classifier is reported.
The paper begins with the related work section and then describes in details the al-gorithms to classify the fruits types and their quality. It reports the accuracy of each algorithm used and ends up with the conclusions.
2
Related Work
Different algorithms have been developed and tested to extract and recognize fruits and vegetables accurately [3,4,5,6,7,8,9,10,11,12,13,14,15,16,and17]. The algorithms rely on extraction of the colour, texture, edge, or shape features.
Zhoa et.al. [5] worked on locating red and green apples in a single image. On-tree situations of contrasting red and green apple on a tree. The combined three features colour, shape, and size to increase the accuracy. Arivazhagan et. al. [6] used shape and texture based features to classify 15 different fruits. The total accuracy of their classifier is 86.00488.
Zawbaa et al. [17] had 178 images of orange, strawberry, and apple. The dataset has 178 fruit images. Their system is based on excreting shape and colour features. The classifiers used are k-NN and SVM. To evaluate the system, they compared the fruits’ images based on the feature. The first group compares the difference between colours of apples’ and oranges’ images. Taken into consideration, they are similar in shape. The second group differentiates between the shape feature and it tests that through the images of apples and strawberries however they have the same colour. The third group compares between oranges and strawberries’ images. They are differ-ent in both the colour and the shape. The third group has the highest accuracy.
Rocha et al. [4] worked on an algorithm to automatic classify fruit and vegetable. They classified 15 types of fruits and vegetables’ images based on appearance, colour, texture, and shape features. Their system has 3% error.
Ninawe and Pandey[18] classified 6 types of fruits red apple, green banana, green guava, green melon, orange, and watermelon based on colour, shape and size features and used a k-NN classifier.. The accuracy researched 95%.
Pass filter, HLS, RGB, L*a*b, and Binaries. In the following step, the Sobel operator and Orthogonal least squares algorithm to extract the texture feature. The system reported a 98% accuracy.
Nandhini and Jaya [12] compared the Colour Based Binary Image Segmentation CBBIS and Particle Swarm Optimization PSO techniques. They classified mango, potato, pumpkin, and onion. CBBIS is well suited for food quality. The accuracy reached 82%. Kaur and Sharma [15] developed a system that classifies the status of lemon fruits defected. The classification is based on the colours, shape and size fea-tures and used ANN for classification. They mentioned the results are promising however the accuracy was not stated.
The following two phases present a system that combines between identifying the fruits types and differentiating between the fresh fruits and the decaying ones. The results of the classifiers in each phase are compared.
3
First Phase: Classifying Fruits’ Types
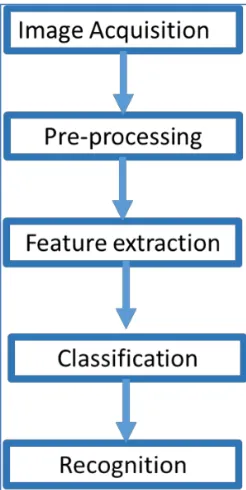
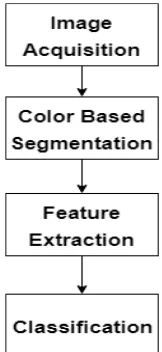
The solution proposed in this paper is a system that classifies different types of fruits. The system has five steps. Figure. 1 shows these steps. They are image acquisi-tion, pre-processing, feature extracacquisi-tion, and classification. In the followings, these steps are explained.
3.1 Image acquisition
The algorithm classifies four different types of fruits i.e., apples, mango, banana, and strawberry. The images are from COFI-Lab [19], Shutter-Stock [20], I- Stock [21] and other sources.
3.2 Pre-processing
The pre-processing has three steps that are showed in Figure.2.
Fig. 2. Pre-processing steps
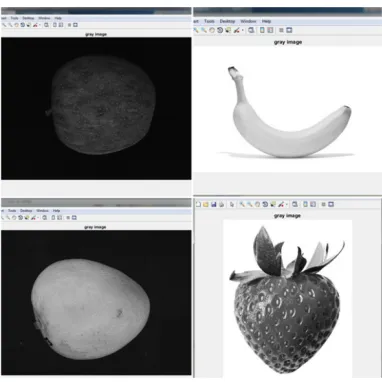
Convert to gray scale: The algorithm converts the image to gray scale. This step is important because it reduces the processing time. The RGB version of the image is more complex than the gray scale version. Figure.3 gives a sample of the grayscale image.
Enhance contrast: Enhancing contrast is used to reduce noise and improving the quality of the image. The basic idea behind this image processing technique is to make details more obvious or to simply highlight certain features of interest in an image [16]. Contrast is determined by the difference in the colour and brightness of the object with other objects. Figure 4 shows the results of applying this algorithm. The algorithm converts the zero pixels into one and one pixels into zero; in other words, black and white pixels are reversed.
Fig. 4. The results of contrast enhance
Median filtering: Median filtering is a nonlinear method used to remove noise from images. It is widely used as it is very effective at removing noise while preserv-ing edges. It is particularly effective at removpreserv-ing ‘salt and pepper’ type noise. The median filter works by moving through the image pixel by pixel, replacing each value with the median value of neighboring pixels [16] (See Figure 5).
Now the image is ready to pass through the following steps, which are feature ex-traction and classification. Figure 6 shows the details of these steps.
Fig. 6. Steps of segmentation, feature extraction, and classification
3.3 Feature extraction
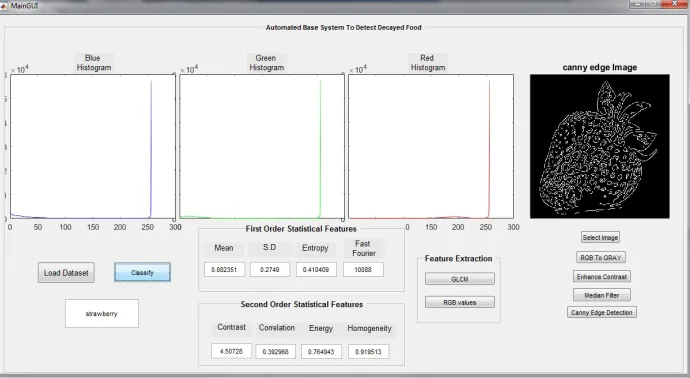
Colour features: In this step, the histogram colours values are calculated based on the original image. This is a representation of the distribution of colours in an image. A colour histogram represents the number of pixels that have colours in each of a fixed list of colour ranges (See Figure. 7).
Texture feature: This step is the most important and difficult step because the ac-curacy of texture feature extraction depends on it. The Canny edge detection algo-rithm is used on the output image. Canny edge detection is responsible for reducing the amount of data, detect useful regions in the image and detecting the range of edges in the image [22].
From the canny edge results, texture feature information is calculated. These are the first order statistical, the higher order statistical features, and the Fast Fourier Transform. Figure 7 shows an example of these values.
First order statistical feature: The first order statistical depends on the pixel values and computes the mean, standard deviation, smoothness and entropy. The mean value measures the average intensity. This means that if the regions in the image have a high grey scale the mean will be high and if the regions in the images have a low grey scale the mean will be low. The standard deviation value measures the average con-trast of an image. It gives the distribution of the gray scale region in the image. If the pixels are distributed in a wide range, then the standard deviation will be high. Smoothness is related to the standard deviation. If the standard deviation is high, the smoothness will be low and vice versa. Entropy measures randomness [16].
Higher order statistical features: This depends on both pixels’ values and the rela-tionship between the pixel values. Gray Level Co-occurrence Matrix (GLCM) fea-tures is a combination of pixels’ values (grey level) and these pixels’ values have a specific angle and distance between each other. The GLCM computes the higher or-der statistical features, which are correlation, contrast, energy, and homogeneity val-ues of the image. Correlation measures how correlated a pixel to its neighbors. Its value range is from 1 to -1. Contrast measures the intensity of contrast between a pixel and its neighbors. Energy returns the sum of all elements in the co-occurrence matrix. Homogeneity returns a value that measures the closeness of the distribution of elements [23].
Fast Fourier Transform: The Fourier Transform accesses the geometric character-istics of a spatial domain image. Because the image in the Fourier domain is decom-posed into its sinusoidal components, it is easy to examine or process certain frequen-cies of the image, thus influencing the geometric structure in the spatial domain.
The Fourier Transform is an important image-processing tool which is used to de-compose an image into its sine and cosine components. The output of the transfor-mation represents the image in the Fourier or frequency domain, while the input im-age is the spatial domain equivalent. In the Fourier domain imim-age, each point repre-sents a particular frequency contained in the spatial domain image [23].
The values of the colour and texture feature are used in the following step to identi-ty the different fruits.
3.4 Classification
With the information produced in the earlier step, a table was produced to train six type of k-NN classifier to get the best accuracy. They are Fine k-NN Medium k-NN, Coarse k-NN, Cosine k-NN, Cubic k-NN, and Weighted k-NN.
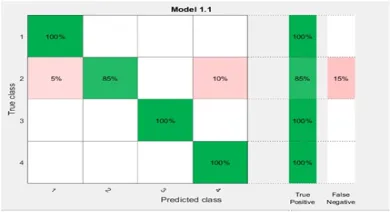
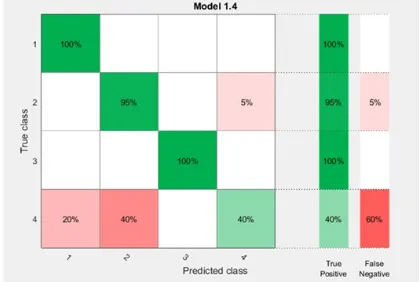
Fine k-NN makes detailed distinctions between classes and the number of neigh-bors is set to one. Medium k-NN makes fewer distinctions than fine k-NN and the number of neighbors is set to ten. Coarse k-NN makes coarse distinctions between classes and the number of neighbors is set to one hundred. Cosine k-NN uses the cosine distance metric. Cubic k-NN uses the cubic distance metric. Weighted k-NN uses the distance weighting. Figure. 8,9,10,11,12,13 represent the confusion matrices for each classifier.
The training results for Fine k-NN, Medium k-NN, Coarse k-NN, Cosine k-NN, Cubic k-NN, and Weighted k-NN, the accuracy of each classifier is 96.3%, 93.8%, 25%, 83.8%, 90%, and 95% respectively (see Figure. 8,9,10,11,12,13).
Fig. 8. Confusion matrix represents the accuracy of Fine k-NN (96.3%)
Fig. 9. Confusion matrix represents the accuracy of Medium k-NN (93.8%)
Fig. 11.confusion matrix represents the accuracy of Cubic k-NN 90%
Fig. 12.Confusion matrix represents the accuracy of Cosine k-NN 83.8%
Fig. 14.Sample of the pictures took by volunteers
3.5 Evaluation
We have asked volunteers to take pictures of the seasonal fruits i.e., apple, straw-berry and banana. They took in total 46 picture. The pictures are not the same size, some reflect light i.e. illumination or blur and others have taken from different view-points. The algorithm managed to recognize them all. Figures 15, 16, and 17 show the results.
Fig. 16.The images in the dataset
Fig. 17.The images in the dataset
4
The second phase: differentiating between fresh and rotten
fruits
4.1 Image acquisition
The images are acquired from the same sources above. Figures 19 &20 show the images of the fresh and rotten of apples, strawberries, bananas, and mangos.
Fig. 19.The images in the dataset
Fig. 20.The images in the dataset
4.2 Colour-Based Segmentation
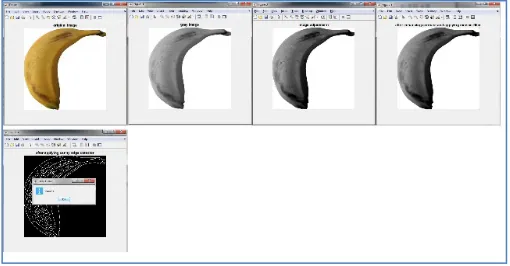
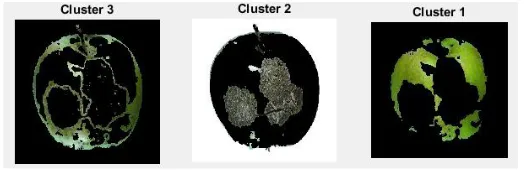
In this step, the colour segmentation is applied. The image is converted into Red, Green, and Blue and each is displayed and the user selects the one that has the highest discrepancy (See Figure 21).
4.3 Feature extraction
After selecting one of the colour segmentation cluster, texture feature information is calculated. These are the first order statistical and the higher order statistical fea-tures. Figure 22 shows an example of these values. For the colour feature, RGB val-ues are extracted and displayed in the coloured histogram (see Figure 22)
Fig. 22.Interface of the system
4.4 Classification
In the final step, the differentiation between the fresh and rotten two classifiers are used which are the linear and quadratic SVM algorithms. Quadratic SVM algorithm gave a better result of 98% accuracy represented in the ROC Curve in Figure 24. Compared to the quadratic SVM, the linear SVM has 96 % accuracy (see Figure 23).
5
Conclusion
This work presents a system that classifies four types of fruits namely mango, strawberry, apply and banana. It as well separates between the fresh and decayed ones. The system has two phases and each follows these steps pre-processing, feature extraction, and classification.
To classify the different fruits types and improve the accuracy of the detection, the colour and the texture features were extracted using GCLM and FFT. Six K-NN clas-sifiers were used and the results were compared. The fine k-NN has the best accuracy of 96.3%. The system is tested with 46 pictures taken by a mobile phone camera of seasonal fruits at the time namely, strawberry, apply and banana. 100% of these pic-tures were recognized correctly.
To differentiation between the fresh and decayed one for each type, texture and colour features are extracted and the linear and quadratic SVM algorithms are applied. The accuracy of the quadratic SVM is high. It is 98%.
6
References
[1] Accessed in Jan (2018). “Apple-Picking Robot Prepares to Compete for Farm Jobs, MIT review.” https://www.technologyreview.com/s/604303/apple-picking-robot-prepares-to-compete-for-farm-jobs
[2]R. Linker , O.Cohen , and A. Naor. (2012). Determination of the Number of Green Apples in RGB Images Recorded in Orchards. Computers and Electronics in Agriculture 81.pp. 45–57. https://doi.org/10.1016/j.compag.2011.11.007
[3] R. Zhou, L. Damerow, and M. M. Blanke. (2012). Recognition Algorithms for Detection of Apple Fruit in an Orchard for early yield Prediction. Precision Agriculture. 13 :5. pp.568-580.
[4]A. Rocha, A., D.Hauagge, J.Wainer, J., and S. Goldenstein.(2010). Automatic Fruit and Vegetable Classification from Images. Computers and Electronics in Agriculture 70:1. pp.96–104. https://doi.org/10.1016/j.compag.2009.09.002
[5]Jun Zhao. Joel Tow. and Jayantha Katupitiy. (2005). Using Texture Properties and Colour Data. IEEE/RSJ International Conference on Intelligent Robotic Systems. pp.263-268.
[6]S.Arivazhagan. R.Newlin Shebiah. S.Selva Nidhyanandhan. and L.Ganesan. (2010). Fruit Recognition using Colour and Texture Features. Journal of Emerging Trends in Computing and Information Sciences. 1:2 October. pp 90-94.
[7]Gouri C.Khadabadi , Vijay S. Rajpurohit, Arun Kumar, and V.B.Nargund.(2015). Disease Detection in Vegetables Using Image Processing Techniques: A Review. International Journal of Emerging Technology in Computer Science & Electronics (IJETCSE) 14 :2 – APRIL. pp. 1345-1353.
[8]A.Meunkaewjinda,P.Kumsawat,K.Attakitmongcol,and A.Srikaew. (2008).Grape Leaf Dis-eases Detection From Colour Imagery Using Hybrid Intelligent System. Conference: Elec-trical Engineering/Electronics, Computer, Telecommunications and Information Technol-ogy, ECTI-CON. IEEE.
[10]S. Nandyal , and M. Jagadeesha. (2013). Crop Growth Prediction Based on Fruit Recogni-tion Using Machine Vision. InternaRecogni-tional Journal of Computer Trends and Technology (IJCTT). 4: 9. September. pp. 3132-3138.
[11] H N Patel, and A D.Patel. (2012). Automatic Segmentation and Yield Measurement of Fruit using Shape Analysis. International Journal of Computer Applications. 45:7. May. pp. 19-24.
[12]Nandhini. P.and J. Jaya.(2014). Image Segmentation for Food Quality Evaluation Using Computer Vision System. Int. Journal of Engineering Research and Applications. 4. 2: 5. February. pp.01-03.
[13]T. Chowdhury, S. Alam, M. Hasan, and I. Khan.(2013).Vegetables Detection From The Glossary Shop For The Blind. IOSR Journal of Electrical and Electronics Engineering IOSR-JEEE. 8:3. November. - December. pp. 43-53. https://doi.org/10.9790/1676-0834353
[14]S.Mahalakshmi, H. Srinivas, S.Meghana, and C. Sai Ashwini (2015). Identification and Classification Techniques a Review Using Neural Networks Approach. International Jour-nal of Advanced Research in Computer and Communication Engineering. 4:12. Decem-ber.pp.234-241.
[15]W. Seng.(2009). A New Method for Fruits Recognition System. International Conference on Electrical Engineering & Informatics, Selangor.
[16]A.Ritika, and S. Kaur. (2013) Contrast Enhancement Techniques for Images: A Visual Analysis. International Journal of Computer Applications. 64:17. February. pp. 0975 -8887. https://doi.org/10.5120/10727-5679
[17]] H. M. Zawbaa, M.Abbass, M.Hazman, and A. Hassenian.(2014).Automatic Fruit Image Recognition System Based on Shape and Colour. AMLTA Springer International Publish-ing Switzerland. 488, pp. 278–290.
[18]P. Ninawe, and S. Pandey(2014).A Completion on Fruit Recognition System Using K-Nearest Neighbors Algorithm. International Journal of Advanced Research in Computer Engineering & Technology (IJARCET). 3: 7.July. pp. 2352-2360.
[19]accessed on Jan (2018) Cof- Ilab, www.cofilab.com [20]accessed on Jan (2018) Shutter Stock, shutterstock.com. [21]accessed on Jan (2018) I- Stock, istock.com.
[22]D. H. Ballard and C. M. Brown. (1982). Computer Vision. NY: Prentice Hall.
[23] N. S. Altman, "An introduction to kernel and nearest-neighbor nonparametric regression". The American Statistician. 46 (3), (1992)., pp. 175–185.
7
Authors
Dr. Ann Nosseir is an associate professor at the British University in Egypt and the INP. She has finished her Ph.D. Computer and Information Sciences, University of Strathclyde in 2008.
Seif Eldin Ashraf Ahmed is with The British University in Egypt, Cairo in Egypt.