Manure nutrient application on a Chinese dairy farm with arable
land: A case study based on Dutch experience of equilibrium
fertilization
Roland W. Melse
1*,
Fridtjof E. de Buisonjé
1, Qiao Wei
2, Dong Renjie
2(1. Wageningen University & Research, Wageningen Livestock Research, 6700 AH, Wageningen, the Netherlands;
2. Biomass Engineering Center, College of Engineering, China Agricultural University, Beijing 100083, China)
Abstract: For a Chinese dairy farm with 2200 milking cows, the annual manure production and manure nutrients (nitrogen and
phosphorus) were estimated. Gaseous nitrogen losses from cattle housing with scraped solid floors were based on on-farm measurements. Based on experiences from the Netherlands, nutrient levels in the solid and liquid fractions after slurry separation were estimated. On the basis of assumptions for nutrient losses during covered lagoon storage and land application of the liquid fraction, nitrogen and phosphorous fertilization rates were calculated for the 67 hm2 of agricultural land that receive the liquid fraction by gravity irrigation. The results show that the application rates of nitrogen and phosphorous significantly exceed the crop needs, which will probably result in losses to soil and water. In order to aim for a balance between nutrient application and crop needs and, as such, reduce environmental harm, the authors recommend to establish application standards for nitrogen and phosphorous on arable land in China and to formulate farm-specific Nutrient Management Plans.
Keywords: dairy manure, nutrient balance, dairy farm, over-fertilization, nutrient application standard, environmental
protection
DOI: 10.25165/j.ijabe.20171004.3082
Citation: Melse R W,de Buisonjé F E, Qiao W, Dong R J. Manure nutrient application on a Chinese dairy farm with arable
land: A case study based on Dutch experience of equilibrium fertilization. Int J Agric & Biol Eng, 2017; 10(4): 182–188.
1 Introduction
With the rapidly increasing livestock production in China, the manure production is increasing at a similar pace. Because of the imbalance between large scale livestock farms and small scale arable farms, manure distribution is difficult, causing local and regional manure
Received date: 2017-01-02 Accepted date: 2017-05-31
Biographies: Fridtjof E. de Buisonjé, BSc, Technical Researcher,
research interests: livestock, manure, environment, Email: [email protected]; Qiao Wei, PhD, Associate Professor,
research interest: anaerobic digestion,Email: [email protected];
Dong Renjie,PhD, Professor, research interest: biogas technology, Email: [email protected].
*Corresponding author: Roland W. Melse, PhD, Senior
Researcher, research interests: emission abatement, manure treatment, Wageningen University & Research, Wageningen Livestock Research, P.O. Box 338, 6700 AH, Wageningen, the Netherlands. Tel: +31-(0)317-480285, Email: [email protected].
surpluses. Furthermore, the lack of appropriate equipment for land application of liquid manure (slurry) and the absence of legal manure nutrient application standards are risk factors for the occurrence of manure dumping and excessive fertilization (i.e. the application of large volumes of slurry on small plots of land, thus posing a threat to both surface and ground water quality)[1-3].
In 2013, the Sino-Dutch Dairy Development Centre (SDDDC, www.sdddc.org) was established which aims to exchange knowledge and technology on dairy production between China and the Netherlands, taking into account both economics and environmental protection. Within this framework a case study was carried out on a Chinese dairy farm with arable land.
land application rates for nitrogen and phosphorus (or phosphate or P2O5, is based on the analyzed phosphorus
content and calculated as 2.29×P-content.). This was done by studying the current practices and manure management system on the farm and by comparing the results with equilibrium fertilization standards that are used in the Netherlands.
2 Description of farm site
The dairy farm (2200 milking cows) with 67 hm2 of farm land was located near Beijing, China. The manure management on this farm is based on mechanical removal (scraping) of the cattle slurry from the solid floors and subsequent separation of the slurry (screw press). The end products of the slurry treatment system are a solid fraction that is further processed by a composting firm, and a liquid fraction that is applied to nearby agricultural land. The applied techniques of floor scraping and manure separation for dairy farms have been described by several authors[4-9]. In more detail, the dairy farm uses
the following manure management technologies:
• Solid concrete floors with automatic slurry
scrapers (scraped every 40 min);
• Collection and transport of the scraped slurry in underground manure channels
• Flushing of the manure channels with liquid
fraction from slurry separation;
• Transport of the scraped slurry through manure
channels to a slurry separator (inclined screen and screw press, see Figure 1);
Figure 1 Slurry separation by inclined screen and screw press
• Storage of the liquid fraction in covered lagoons (during approx. 6 months);
• Application of liquid fraction on adjacent
agricultural land by irrigation channels;
• Liquid fraction is applied twice a year to 67 hm2
of farm land (wheat and corn).
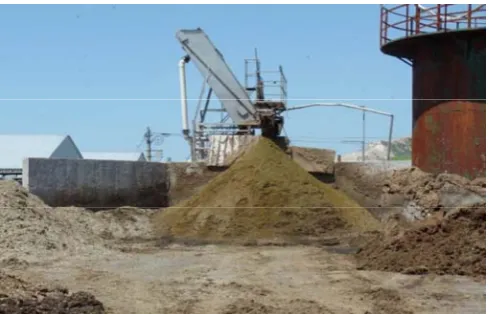
The solid fraction from the manure separation is transferred to a composting company and subsequently sold as organic fertilizer to vegetable farms in the region. The liquid fraction is stored in covered lagoons (Figure 2).
Figure 2 A covered lagoon for storage of the liquid fraction from the slurry separator (on top of the cover, some rainwater has
accumulated)
3 Emissions of ammonia and nitrous oxide
from scraped floors
An important source of gaseous nitrogen emissions are the losses of ammonia (NH3) and nitrous oxide (N2O)
from the scraped solid floors of the animal house[10-12]. These emissions were estimated by measuring these compounds with a closed flux chamber and a multigas-analyzer on this farm[13].
The NH3 emission was estimated at 4.2 kg NH3 per
milking cow per year and the N2O emission at about
0.1 kg N2O per milking cow per year. In total of this
represents a nitrogen loss of 3.5 kg N per milking cow per year[13].
4 Slurry production, slurry separation and
corresponding nutrient levels
in China and in the Netherlands are the same (comparable milk production levels), that the manure from large scale intensive cattle farms in China has the same nutrient levels as in the Netherlands (comparable diet compositions), and that screw press filters in China have
a comparable separation performance as screw press filters in the Netherlands. The main input for the calculations are the results of cattle slurry separation tests with a screw press separator that were carried out on 13 Dutch dairy farms[14].
Table 1 Manure characteristics, nutrient balance and manure separator performance for a cattle farm, as based on literatures[13-15]
Manure production /ton per milking cow
per year
Dry matter content /%
N-content /kg·t-1
N-flow /kg per milking cow
per year
P2O5 content
/kg·t-1
P2O5 excretion
/kg per milking cow per year
Total nitrogen excretion n.a. n.a. n.a. 114.5 n.a. n.a. Nitrogen loss from floor n.a. n.a. n.a. 3.5 n.a. n.a.
Input of separator
Raw cattle slurry 29 10 3.8 111 1.4 41
Output from separator
Solid fraction 5 20 4.5 23 2.2 11
Liquid fraction 24 8 3.7 89 1.2 29
Note: N = nitrogen; P2O5 = phosphate; n.a.= not applicable.
Based on the measured nutrient levels of the
aforementioned study[14] and the assumed manure
production rate[15], the total amount of nitrogen in the manure entering the separator can be estimated, viz 111 kg N per milking cow per year. As described in the previous section, the nitrogen loss from the floors is estimated to be 3.5 kg N. This means that the total nitrogen excretion per milking cow per year is the sum of these two and amounts to 111+3.5=114.5 kg N.
One highly productive milking cow (milk production
≈ 10 000 kg/year) produces 29 t of raw slurry per year[15]; separation of the raw slurry produces 5 t (16%) of solid fraction and 24 t (84%) of liquid fraction per milking cow
per year[14]. The solid fraction with 20% dry matter is stackable and no liquid runs out of the pile.
After slurry separation with a screw press, 79% of the nitrogen and 73% of the phosphate remain in the liquid fraction[14]. These percentages can vary with the type of
separator and the type of slurry.
Furthermore, in Figure 3, pie charts are given to illustrate the total amount of nitrogen and phosphate (100%) that is excreted by the cows and where this ends up. It shows what part is emitted from the floor (for nitrogen) and how the remaining nitrogen and phosphate is distributed between solid and liquid fraction. For phosphate there is supposed to be no emission.
a. Fate of excreted N b. Fate of excreted P2O5
Figure 3 Calculated distribution of nitrogen and phosphate for floor emission (N) and slurry separation (N and P2O5)
5 Storage of the liquid fraction in covered
lagoons
After slurry separation, the liquid fraction (i.e. 84% of
The nitrogen loss to the atmosphere from an uncovered lagoon can be 70%-90%, but by covering the lagoon, this emission of NH3 can be reduced by 80%[16],
resulting in an remaining gaseous nitrogen loss of approx. 15% from prolonged storage in a covered lagoon. During prolonged storage, phosphate sedimentation into a sludge on the bottom of the lagoon can reduce the phosphate content of the liquid fraction by 50%-80%, depending on the degree of agitation during pumpout[17]. In our further calculations, we assume a reduction of 70% in phosphate content and of 20% in nitrogen content of the manure due to sedimentation during lagoon storage. This means that a considerable amount of the phosphate, and to a lesser extent also nitrogen, accumulates at the bottom of the lagoon. The total nitrogen loss during lagoon storage (15% to the atmosphere and 20% into sludge) is assumed to be 35%.
As a result, the nitrogen and phosphate levels in the liquid fraction after lagoon storage, at the moment of land application, will be around 2.4 kg N/t and 0.36 kg P2O5/t.
6 Application of the liquid fraction to
agricultural land
After storage the liquid fraction is pumped out of the lagoons and transported to the fields using trucks. Then the slurry is distributed on the land using irrigation. The cropping system is a winter wheat-summer maize rotation system, with wheat planted in mid-October after the harvest of maize. The slurry is applied in July and in November/December.
The nitrogen efficiency of liquid manure application by irrigation without incorporation into the soil is estimated at 20%-40% of the remaining nitrogen after
storage[18]. In our calculation, we assume a 30%
N-efficiency; this means that 70% of the nitrogen is lost during and after land application, mainly as volatilization of ammonia. The phosphate efficiency is assumed to be 100% of the remaining phosphate in the liquid fraction after sedimentation during lagoon storage. It is assumed that the sludge, remaining on the lagoon bottom after emptying the lagoon, eventually will be collected and transferred to a recipient outside the dairy company (e.g. to a composting company or vegetable farm).
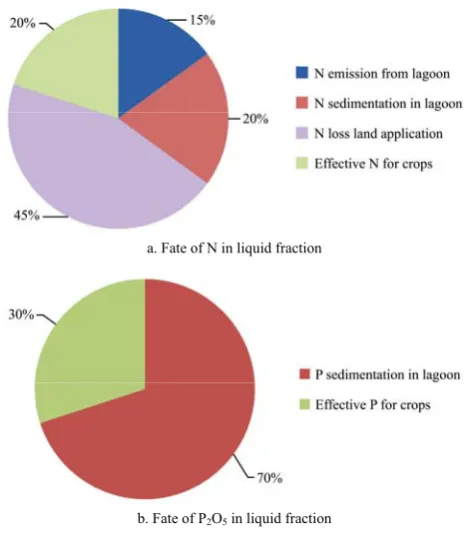
In Figure 4 the results of the calculations are shown for the nitrogen and phosphate distribution between the different sinks and emissions, with the nitrogen and phosphate load of the liquid fraction from the screw-press as input. For the pie charts clearly show that effectively 20% of all nitrogen and 30% of all phosphate can be taken up by the crops grown on the adjacent 67 hm2 of
agricultural land.
a. Fate of N in liquid fraction
b. Fate of P2O5 in liquid fraction
Figure 4 Calculated fate and distribution of nitrogen (N) and phosphate (P2O5) from liquid fraction, taking into account gaseous N-emission, sedimentation losses during lagoon storage and losses
during land application
7 Discussion
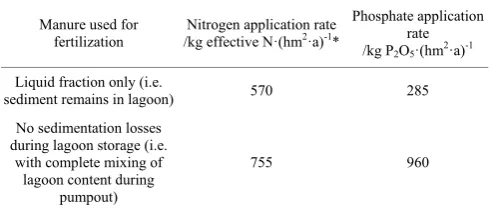
Taking into consideration storage losses of 35% of the nitrogen and 70% of the phosphate and an efficiency of 30% for the remaining nitrogen during and after land application, as discussed above, the fertilization of 67 hm2 of agricultural land with the liquid fraction from 2200 cattle results in application rates of 570 kg effective N/(hm2·a) and 285 kg P2O5/(hm2·a) (Table 2). This is
based on the assumption that the sedimentary sludge is eventually collected and disposed of to an external customer, just as the solid fraction from the separator.
adjacent agricultural land, this would result in application
rates of 755 kg effective N/(hm2·a) and 960 kg
P2O5/(hm2·a) (Table 2). Especially for P2O5 this would
mean a drastic increase.
Table 2 Calculated application rates for nitrogen and
phosphate for a dairy farm with 2200 milking cows and 67 hm2
of agricultural land, using liquid fraction from manure
separation, after storage in covered lagoon
Manure used for fertilization
Nitrogen application rate /kg effective N·(hm2·a)-1*
Phosphate application rate /kg P2O5·(hm2·a)-1
Liquid fraction only (i.e.
sediment remains in lagoon) 570 285 No sedimentation losses
during lagoon storage (i.e. with complete mixing of
lagoon content during pumpout)
755 960
Note: The manure production of young stock, estimated at 12 m3 of slurry per
animal per year, has not been taken into account[12]. Therefore, the calculated
application rates in Table 2 are probably underestimates.
*Effective N means the N that is available for the crops, i.e. losses during and after land application are deducted.
The calculated manure nitrogen and phosphorus application rates, after storage and application losses (Table 2, first row), are quite high as compared to the maximum application rates that are used in the Netherlands (Maximum effective nitrogen application rate (successive wheat and corn crops in same year): 252-335 kg N/(hm2·a) (depending on soil type)[19]; maximum phosphate application rate for arable land: 50-75 kg P2O5/(hm2·a) (depending on soil phosphate
condition)[19]). In the Netherlands, the maximum
application rates are based on ‘equilibrium fertilization’, i.e. the application rate must be in balance with the nutrient uptake by the crop in order to minimize avoidable losses to soil and water[20]. The higher application rates shown in Table 2 might to some extent be justified by higher yields, higher crop uptake, different soil conditions and a longer growing season with two crops per year in the Beijing region.
When, on the other hand, all nutrients from the lagoons are applied to agricultural land (with complete mixing of the lagoon content during pumpout) much higher application rates are calculated, especially for phosphate (Table 2, second row). The phosphate application rate of 960 kg/(hm2·a) is more than ten times
higher than the maximum phosphate application rate for
arable land in the Netherlands. Furthermore, we must keep in mind that Table 2 is based on application of manure nutrients only: if additional synthetic fertilizer is used, which is often the case in practice; this will inevitably further increase the nutrient application rates. In addition, the manure production from young stock has not been taken into account, which would also increase the application rates.
8 Conclusions and recommendations
Although the calculated application rates for nitrogen and phosphate are based on several assumptions that were not specifically validated for Chinese conditions, we conclude that there is a large risk of over-fertilization, resulting in pollution of soil and water. Currently, specific information on manure production levels, nutrient levels in manure fractions, nutrient losses during lagoon storage, nutrient losses during and after land application, on nutrient removal by crops, etc. for Chinese conditions is limited. When new data becomes available in future, the calculations that were done in this paper could be improved and help to further determine optimal nutrient application rates for animal manure under Chinese circumstances.
In our opinion, further research and extension should be aimed at increasing the manure nutrient efficiency. This means that losses to the environment (e.g. to groundwater tables, surface water, air) are minimized and a larger part of the minerals is taken up by the crops. Besides reducing the environmental impact, increasing the manure nutrient would also means that farmers’ expenses for chemical fertilizer purchase can be reduced.
that a combination of legislation and enforcement is essential to achieve the set goals and to prevent dumping of large manure volumes on small areas of agricultural land.
Currently, chemical analyses of the nutrient (N and P2O5) contents of cattle slurry, anaerobic digester effluent,
solid and liquid fractions and other manure products, are often lacking in Chinese agriculture. However, these values are essential for the calculation of accurate crop specific fertilization rates, or the calculation of how much manure can be adequately utilized per hectare. So the development and dissemination of knowledge on nutrient levels in organic fertilizers in relation to the nutritional needs of crops is highly desirable in our opinion. This includes the interpretation by farm managers of the results of chemical analysis of organic fertilizers and soils.
Finally, we recommend to combining and summarizing this information and knowledge in farm-specific ‘Manure Nutrient Management Plans’. The main element in such a plan is, as we illustrated in this paper, a calculation on how much manure and nutrients are produced per year, how this manure is treated or utilized on the farm or what happens with it when it is transported to other (crop) farms or companies. Logically the plans for application of manure to crops should include a calculation of manure and nutrients application rates.
Acknowledgements
This project was supported by the Ministry of Economic Affairs of the Netherlands through the TKI AF14247 Sino-Dutch Dairy Development Center (SDDDC) program (BO-27.04-001-014) by the Beijing Municipal Science and Technology Plan Project (D151100005115001).
[References]
[1] Tan B, Yin Y. Environmental sustainability analysis and nutritional strategies of animal production in China. Annual Review of Animal Biosciences, 2017; 5: 171–184.
[2] Chadwick D R, Jia W, Tong Y, Yu G H, Shen Q R, Chen Q. Improving manure nutrient management towards sustainable agricultural intensification in China. Agriculture,
Ecosystems & Environment, 2015; 209: 34–46.
[3] Li S, Liu K, Liu X (Eds). White paper on China dairy - 2014. Sino-Dutch Dairy Development Centre. http://www.sdddc.org/en/download/detail-137.aspx
[4] Wu Z. Phosphorus and nitrogen distribution of screw press separated dairy manure with recovery of bedding material. Applied Engineering in Agriculture, 2007; 23: 757–762. [5] Møller H B, Lund I, Sommer S G. Solid–liquid separation
of livestock slurry: efficiency and cost. Bioresource Technology, 2000; 74: 223–229.
[6] Hjorth M, Christensen K V, Christensen M L, Sommer S G. Solid-liquid separation of animal slurry in theory and practice. A review. Agronomy for Sustainable Development, 2010; 30: 153–180.
[7] Møller H B, Sommer S G, Ahring B K. Separation efficiency and particle size distribution in relation to manure type and storage conditions. Bioresource Technology, 2002; 85: 189–196.
[8] Ogink N W M, Kroodsma W. Reduction of ammonia emission from a cow cubicle house by flushing with water or a formalin solution. Journal of Agricultural Engineering Research; 1996; 63: 197–204.
[9] Braam C R, Ketelaars J J M H, Smits M C J. Effects of floor design and floor cleaning on ammonia emission from cubicle houses for dairy cows. Netherlands Journal of Agricultural Science, 1997; 45: 49–64.
[10] Baldinia C, Borgonovob F, Guarino M. Comparison among NH3 and GHGs emissive patterns from different housing solutions of dairy farms. Atmospheric Environment, 2016; 141: 60–66.
[11] Wu W, Zhang G, Kai P. Ammonia and methane emissions from two naturally ventilated dairy cattle buildings and the influence of climatic factors on ammonia emissions. Atmospheric Environment, 2012; 61: 232–243.
[12] Zhang G, Strøm J S, Li B, Rom H B, Morsing S, Dahl P, Wang C. Emission of ammonia and other contaminant gases from naturally ventilated dairy cattle buildings. Biosystems Engineering, 2005; 92: 355–364.
[13] Melse R W, de Buisonjé F E. Indicative emission measurements at two dairy farms in the Beijing region, China. Project report WP5 - Sino-Dutch Dairy Development Centre SDDDC/ Wageningen University and Research, Wageningen, the Netherlands, 2016; 34p.
International, Wageningen, the Netherlands, 2009; 59p. [15] KWIN 2016-2017. Quantitative information for animal
husbandry. Wageningen UR Livestock Research, the Netherlands, 2016; 340p.
[16] Leytem A B, Dungan R S. Livestock GRACEnet: A workgroup dedicated to evaluating and mitigating emissions from livestock production. Journal of Environmental Quality, 2014; 43: 1101–1110.
[17] Fulhage C D, Pfost D L, Schuster D L. Fertilizer nutrients in livestock and poultry manure. University of Missouri
Cooperative Extension Bulletin EQ 351. 2002.
[18] Rotz C A. Management to reduce nitrogen losses in animal production. Anim Sci, 2004; 82 E-Suppl: E119–137. [19] RVO. Manure policy 2014-2016 - Supporting tables
(Tabellenbrochure Mestbeleid), in Dutch, Table 1 and 2, 2016. http://www.rvo.nl/onderwerpen/agrarisch-ondernemen/ mest-en-grond/mest/tabellen-en-publicaties.
![Table 1 Manure characteristics, nutrient balance and manure separator performance for a cattle farm, as based on literatures[13-15]](https://thumb-us.123doks.com/thumbv2/123dok_us/604346.2060046/3.595.97.501.570.704/table-manure-characteristics-nutrient-balance-separator-performance-literatures.webp)