Research exploring greenhouse environment control over the last 50 years
Tadashi Takakura
(NARO Institute for Rural Engineering, Tsukuba, Ibaraki 305-8609, Japan)
Abstract: Environments do not exist in isolation. Their main components in greenhouse systems are plants. Without
consideration of plants, analysis of greenhouse environments and environmental control of greenhouses can be accomplished, although it is not simple to achieve. Initial attempts were undertaken to analyze greenhouse environments and then reproduce them. Ventilation rate effects on plant photosynthesis in a growth chamber were reported in 1966. Computer simulations then became a main subject of research. The first dynamic computer simulation of a greenhouse environment including plants was published in 1971. According to innovations of computer technology, the use of minicomputers and microcomputers spread in many areas. By measuring the net photosynthesis of lettuce plants grown under artificial lighting, air temperature was optimized using a minicomputer with the hill-climbing method. The method was designated as the Speaking Plant Approach to environment control (SPA). After the author developed the first reported environmental control system in Japan, systems using microcomputers spread widely for greenhouse environmental control. Knowledge-based expert systems were tested for plant management. Also, a machine vision system was developed to detect critical moments for watering of muskmelon plants. The first feed-forward control method for greenhouses with a large heat mass was reported. Then space farming was tested in 1996 to assess gravity effects on plants. Energy-saving aspects such as solar sterilization, ground heat storage system, and storage using phase change material (PCM) have been reported. Defects of ordinary solarimeters were reported in 2008 along with an approach to estimate evapotranspiration in a greenhouse without the effect of so-called cosine law. Later, this technique was expanded to estimate photosynthesis of the plant canopy in a greenhouse using newly developed sensor units.
Keywords: computer control, evapotranspiration, global and diffused solar radiation, nondestructive and non-contact measurement, photosynthesis, SPA
DOI: 10.25165/j.ijabe.20191205.5179
Citation: Takakura T. Research exploring greenhouse environment control over the last 50 years. Int J Agric & Biol Eng,
2019; 12(5): 1–7.
1 Introduction
Reviewing research conducted over the last 50 years, among the salient developments in the background of this research is the drastic change of digital computers in terms of both hardware and software. Phenological review can be understood only in light of this background change. Initially, all computer programs were punched on cards and were put on mainframes, which were mostly operated as closed shop systems. Then minicomputers became available, but a huge computer rack was needed to set up the computer, with magnetic tape drives and interfaces. A teletype was used as an input device. After microcomputers were developed, size reduction progressed. Systems based on desktop computers became predominant. Similar development occurred in terms of software. Starting with a programming language such as FORTRAN, many simulation languages were developed at many levels, most with user-friendly interfaces.
Most research papers in English published the last over 50 years are listed among the references. This paper presents full descriptions of several typical topics, but the others can be understood directly from papers presented in the references.
2 Physics of greenhouse environment and digital
simulation
Steady state analyses of greenhouse environments were
Received date: 2019-04-08 Accepted date: 2019-07-05
Biographies: Tadashi Takakura, PhD, Professor, Adjunct Researcher, research interest: greenhouse environment control. Kannondai 2-1-6, Tsukuba, Ibaraki 305-8609, Japan. Tel: +29-838-7655, Email:[email protected].
predominant[1,2]. The first attempt to predict greenhouse interior
temperatures in a non-steady state was conducted using Duhamel’s integral:
0
( ) t ( ) ( )
R t =
∫
F t− ⋅τ W τ dτ (1)where, R(t) stands for the response to excitation; F(t) denotes a force applied to the system, and W(t) expresses the weighting function. It is given by differentiation of the response function to the unit step input. Greenhouse inside air temperatures are a function of the outside air temperature, floor temperature, and ventilation air. All radiation effects were converted to air temperature changes[3,4].
The same method was applied to feed-forward control of interior air in a floor heat greenhouse[5]. Floor heating is a
Figure 1 Greenhouse energy inputs and responses to unit step changes
Three response curves for each unit input were found experimentally in a controlled environmental chamber and were then used. A typical result of a model verification experiment is presented in Figure 2. The input water temperature to the floor is shown at the most upper curve. The change of outside air temperature is shown in the lower most panel. The labeled predicted 2 is well fitted with the measured temperature inside. If the response curve to the floor temperature is inappropriate, then it gives the curve predicted 1. In such a system, model development and finding a response to unit step functions of each input, either by experiment or mathematical manipulation, are fundamentally important.
The internal air temperature is given by Equation (2) for arbitrary inputs of solar radiation, outside air temperature, and heat to the floor:
0 0
0
( ) ( ) ( ) ( ) ( )
( ) ( )
t t
t
Ti t So t τ Rs τ dτ To t τ Ro τ dτ
Qo t τ Rf τ dτ
′ ′
= − ⋅ + − ⋅ +
′ − ⋅
∫
∫
∫
(2)Note: Predicted 2 of inside air it well fit with measured one. Figure 2 Model verification experiment
In addition to the development of mathematical models, an experiment to measure air temperature conditions in a glasshouse was conducted. In some conditions inside air temperature was lower that the outside was found[6]. The ventilation amount effect
strongly affected photosynthesis in the greenhouse[7]. A more
accurate and sophisticated model approach was needed.
3 Digital computer simulation
Steady-state heat balance methods are limited in their ability to account for heat storage in the system. For example, radiation heat exchange inside a greenhouse should be followed accurately (Figure 3). A more sophisticated dynamic model than the weighting function technique was developed[8].
New features included the following:
1) The leaf temperature and inside air temperature are not regarded as equal.
2) Moisture balance considering condensation, evapotranspiration, and mass transfer in the ventilation air inside the greenhouse is considered.
3) The heat storage term of the floor is expressed as a two-dimensional heat transfer model where the edge effects of heat loss are calculable.
4) Separate effects of radiation and convection on the plant leaf temperature can be analyzed.
5) Convective hat transmission coefficients of the outside glass surface are expressed as a function of wind speed.
6) The change of transmissivity for direct solar radiation attributable to each wall orientation is calculated. The space average of the transmissivity at the floor is found.
The program was developed using FORTRAN, a general programming language available at that time.
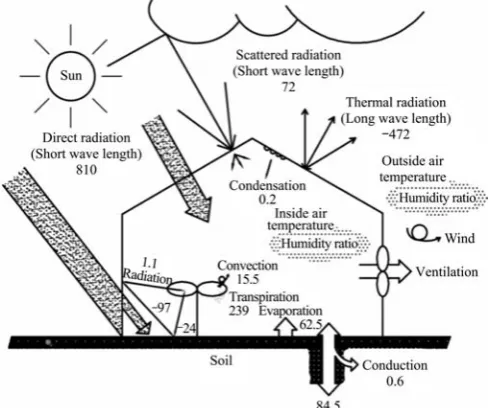
Note: Numbers represent the amount of energy (kcal/m2·h) based on the calculated date at 14:00 (7:00 for condensation) on August 28, 1969.
Figure 3 Schematic representation of the thermal environment of a model greenhouse
Similarly, a two-dimensional simulation model of a greenhouse-type solar sterilization system was developed, which consists of a small tunnel with mulching[9]. Several model
a positive effect on maximum and a negative effect on minimum soil temperatures. Drier soil achieves higher maximum and lower minimum temperatures. Degree-hours above a particular temperature, which kill soil-borne pathogens, can be calculated easily using the model.
Digital simulation technique was widely used and many models were developed. Three typical models were compared[10].
Greenhouse energy analysis with plant growth using digital simulation techniques is presented in textbooks[11-13].
More advanced and user-friendly software can be available in recent years. For energy analysis, TRNSYS and Energy Plus are popular. For radiation analysis, Radiance then ALFA (Rhinoceras, Grass Hopper) are applied. Temperature and flow distribution in a greenhouse can be analyzed using CFD.
4 Direct digital control of plant growth and
environment
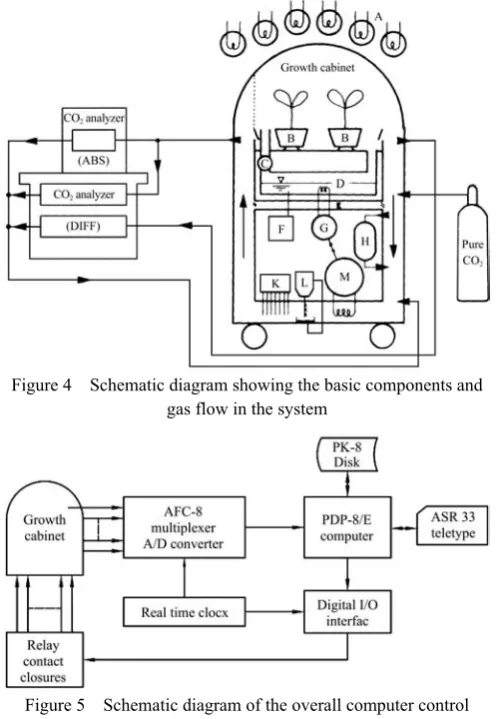
Plant growth is regarded as a main dynamic process in agricultural production systems. It is more complex than most industrial processes. Plant reactions are not constant throughout all growth stages. Direct digital control system of plant growth to maximize plant photosynthesis was developed (Figure 4)[14].
Outputs of absolute and differential type infrared CO2
analyzers (IRGA) were connected to the computer. The differential type gives plant photosynthesis in the cabinet based on the internal/external CO2 difference. Figure 5 shows a block
diagram of the computer process control system.
Figure 4 Schematic diagram showing the basic components and gas flow in the system
Figure 5 Schematic diagram of the overall computer control system
The developed system was called the Speaking Plant Approach to environment control (SPA) because information such as
photosynthesis is received from the plant to optimize its environment. The first experiment was conducted under artificial light[15]. The second was under natural light condition[16].
In this experiment, air temperature, CO2 concentration, and
relative humidity in the plant growth chamber were optimized using the so-called hill climbing method to find the way to change in the steepest ascent method. After the new environment was settled, the net photosynthesis was measured. In the nighttime, these environmental conditions were fixed. A typical result is depicted in Figure 6. In the daytime, the optimum conditions are not stable, but air temperature of 40°C, CO2 concentration of
1,300 ppm and relative humidity of above 80% might be typical optimum conditions, but they are time-dependent. It was concluded that instantaneous photosynthesis went higher with higher temperature and dropped suddenly. Long-term plant optimization should be considered.
More stable control was conducted under natural light, modifying the hill climbing technique. Computer- selected air temperature based on net and gross photosynthesis was well correlated with the solar radiation flux density. The morning and afternoon ratio of integrated photosynthesis was almost unity (Figure 7).
Figure 6 Daily courses of net photosynthetic rate and three control variables in optimization
Note: Daily patterns for 11 days starting Nov. 25 in 1975. SR is the daily solar radiation (J/cm2/day); γ is the correlation coefficient.
Although SPA was an excellent idea, it was too early to be established because plant reaction to environment is nonlinear and irreversible. Techniques that are predominant in industrial engineering are not applicable directly to biological processes. Without taking information from plants, microcomputer systems to control greenhouse environment instead of analog type, which were only available at that time, were developed first in Japan[17, 18]. At
that time, an INTEL8085 processor with 8 kB of ROM and 12.5 kB of RAM was the main component. Systems of several types were produced by a company which cooperated in developing the first system with the author. They were sold explosively in Japan in the first several years. Then several companies followed.
5 Energy saving techniques
Saving energy inputs to the greenhouse became an important research topic[19]. Sensible heat storage materials such as water,
rocks, and soil came to be used for greenhouse heating. Underground heat storage systems were popular; they were increasingly analyzed[20-22]. However, the shortcomings of
sensible heat storage include the fact that heat storage accompanies a change in temperature: high temperature storage cannot be attained easily. Moreover, a rather huge amount of material is required, necessitating a rather large scale of construction. Latent heat storage systems were innovated using phase change materials (PCMs)[23, 24]. To use solar energy and to keep the reasonable air
temperature at night, several PCMs were selected and tested. A new PCM with a melting point of 20°C-23°C, a freezing point of 17°C-20°C, and heat of fusion of 56 cal/cm3 (40 cal/g) was
innovated with Matsushita Research Institute Tokyo, Inc., and was later commercialized. The test was conducted in an experimental greenhouse. The floor area of the greenhouse used was 352 m2.
The height, width, and length of the heat storage unit were, respectively, 0.9 m, 0.6 m, and 4.7 m. A ventilating fan to blow air into the unit provided 72 m3/min. The total amount of the
PCM was 2500 kg. The potential value of heat to be stored was 112.4 Mcal. A typical result is presented in Figure 8. Solar energy was stored in the PCM system and soil during the day; energy was released at night.
Figure 8 Diurnal changes in temperatures of the outside and inside air and the PCM bag surface
6 Smart sensor development
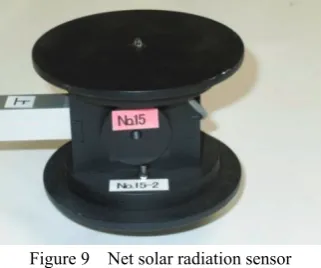
6.1 Spherical net solar radiation sensor
Standard solarimeters have flat surface detectors. Similar photodiodes have been used in many experiments. However, a well grown plant canopy such as that of tomato plants in a
greenhouse is high. Moreover, the incident angle of the direct solar radiation to the side of the canopy is much smaller than the angle to a horizontal flat surface. The cosine law acts in this case. Then the solar radiation received by the canopy is underestimated by the horizontal flat sensors[25, 26].
A spherical photodiode (Sphelar One, KSP-OCo1830 MR-Er-X03; Sphelar Power Corp.) was used. Its spectral sensitivity extends almost linearly from 400 nm to 1200 nm; the peak is at 1000 nm. Total sensitivity along the incident angle is flat until 70 deg, after which it decreases. To block the reflected solar radiation from the ground, the lower half of the sphere is covered by a black shield. To measure the incoming global solar radiation and reflected radiation, the same unit is set for the top and the bottom (Figure 9)[27].
Figure 9 Net solar radiation sensor 6.2 Global and diffused solar radiation sensor
The shadow band internal diameter is 100 mm. The exterior is 116 mm. The thickness is 8 mm. The inclined angle of the motor is 15 deg to avoid blockage of part of the sky by the motor. A 50-mm-diameter disk is attached to cover the bottom half of the sphere diode mainly to block reflected solar radiation from the surrounding ground. All surfaces are painted matte black (Figure 10).
The low-voltage DC geared motor that was used has a gear ratio of 2304:1. It is operated by 1.5 V. Its rotation speed is 0.19 r/min. The rotation speed was determined according to the sampling time interval of the data logger used. The minimum sampling time of the data logger (LR5041; Hioki Corp.) is 1 s. The 8-mm-wide shadow of the band covers the 3-mm-diameter diode for 5 s at a speed of 1 mm/s move. This fact demonstrates that a sufficient shadow is made on the sensor to measure diffused radiation instantaneously[28].
Figure 10 Global and diffused radiation sensor 6.3 Evapotranspiration sensor
It has been demonstrated that using the energy balance equation itself, which is the basis of the Penman-Monteith Equation, is a simpler approach[29]. In addition, with the
inexpensive equipment, thereby eliminating the need for measuring vapor flux as well as leaf area index (LAI) and stomatal resistances, which are necessary parameters for use with the Penman-Monteith Equation. Evapotranspiration flux (kg/m2/h) E can be calculated
using the following equation:
( )
n w
R h T T G
E
l
− − −
= (3)
where, Rn is the net heat flux caused by radiation over the canopy,
kJ/(m2·h); l the heat caused by vaporization, kJ/kg; h is the
coefficient of the convective heat transfer, kJ/(m2·h·K) and is a
function of wind speed; T is the air temperature, °C; Tw is the
surface temperature, °C. G is the heat flux into the ground, kJ/(m2·h), which is sufficiently small to be neglected. The surface
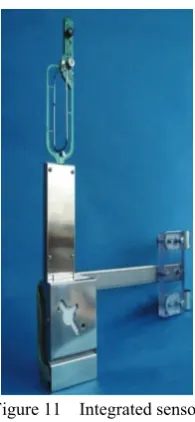
temperature is the overall average of the surface temperature of the plant canopy and that of the ground surface. Rn can be measured
using a net solar radiation sensor (Figure 9). This developed integrated sensor measures air temperature, wind speed, relative humidity, CO2 concentration, surface temperature and solar
radiation for both sides. A soil heat flow meter of a commercial type can be connected if necessary (Figure 11).
Using this sensor, E is calculable using Equation (3).
Figure 11 Integrated sensor
7 Photosynthesis and transpiration measurement
Using no enclosure such as a leaf chamber, photosynthesis can be estimated using two equations: one for the carbon dioxide balance equation and the other for a water vapor balance equation of the greenhouse which have two unknowns: canopy photosynthesis and the ventilation rate.
Two sensors above the canopy measure overall evapotranspiration (Figure 12). Integrated sensors measure inside and outside air temperature, relative humidity, and wind speed. Heat flow and CO2 flow from the soil are measured respectively
using a conventional heat flow meter and a developed box type CO2 meter (Figure 13). Data are transferred to the integrated
sensor as shown in Figure 12. Simply, two integrated sensors facing the canopy measure transpiration from the canopy.
Experimentation revealed that the evapotranspiration of the canopy is related linearly to net solar radiation in the greenhouse (Figure 14). However, the data obtained for the canopy photosynthesis were scattered because of frequent changes in the ventilation amount. It is presented in Figure 15 that although the main factor affecting net photosynthesis is net solar radiation, other factors such as air temperature, CO2 concentration, and humidity
cannot be neglected[29].
Figure 12 Arrangement of sensors used to measure photosynthesis and transpiration
Figure 13 Box type CO2 meter
Figure 14 Relation between evapotranspiration and net solar radiation above the canopy
Figure 15 Relation between the net photosynthetic rate and net solar radiation
8 Miscellaneous topics
Non-destructive detection of plant stress has been examined[30-32].
environmental control perspective. Tipburn of lettuce was studied by tracing Ca movement in lettuces. A breakthrough technique was found of blowing air to the lettuce interior[33-35]. The relation
between root respiration and its environment was investigated[36,37].
The effects of lighting cycles on photosynthesis were also studied. The efficiency was increased by a short cycle[38]. The effects on
the yields and traits of plants of irradiation with far-red (FR) light of the lower irradiation less than 100 mW/m2 at the end of the day
(EOD) were assessed. For leaf vegetables such as spinach and pak-choi under EOD-FR treatment, stem elongation was promoted by more than eight times and two times, respectively, by comparison with plants without treatment[39,40]. Space environment
such as low gravity and lower air pressure were studied[41-44].
Preliminary studies of AI systems were conducted. Expert systems for consultation of crop management were also developed[45]. Computer image analysis was undertaken to
develop adequate irrigation timing[46,47]. In addition, greenhouse
cooling and Chinese type greenhouse light environments have been investigated[48-53].
Acknowledgements
The study described in this paper was not conducted by the author alone. It was a joint effort undertaken with many co-workers and students over the last 50 years. Because of page limitations, it was not possible to describe details of all work. Readers are encouraged to read the original papers listed in the references, if necessary.
This manuscript was presented at 2019 International Symposium on Environment Control Technology for Value-added Plant Production hold in Beijing at Aug. 27-30, 2019.
[References]
[1] Businger J A. The glasshouse (greenhouse) climate in physics of plant environment (van Wijk W R Ed.), North Holland Publ. Co., 1963; pp.277–318.
[2] Walker J N. Predicting temperatures in ventilated greenhouses. Trans. ASAE, 1963; 8: 445–448.
[3] Takakura T. Predicting air temperatures in the glasshouse (I). J. Meteor. Soc. Japan, 1967; 45: 40–52.
[4] Takakura T. Predicting air temperatures in the glasshouse (II). J. Meteor. Soc. Japan, 1968; 46: 36–44.
[5] Takakura T, Manning T O, Giacomelli G A, Roberts W J. Feed-forward control for a floor heat greenhouse. Trans. ASAE, 1994; 37: 939–945. [6] Takakura T. Temperature gradients in the greenhouse. J. Appl. Meteor.,
1967; 6: 956–957.
[7] Takakura T. The effect of room ventilation on net photosynthesis rate. Bot. Mag., 1966; 79: 143–151.
[8] Takakura T, Jordan K A, Boyd L L. Dynamic simulation of plant growth and environment in the greenhouse. Trans. ASAE, 1971; 14: 964–971. [9] Takakura T, Kania S, Roberts W J. Simulation analysis of solar
sterilization systems. Proc. 27th National Agricultural Plastics Congress, 1998; pp.119–126.
[10] van Bavel C H M, Takakura T, Bot G P A. Global comparison of three greenhouse climate models. Acta Hort., 1985; 174: 21–33.
[11] Takakura T, Climate under cover. Digital dynamic simulation in plant bio-engineering. Kluwer Academic Publishers, 1993; 155p.
[12] Takakura T, Fang W. Climate under cover. Digital dynamic simulation in plant. bio-engineering (2nd Edition). Kluwer Academic Publishers, 2002; 190p.
[13] Takakura T, Son J E. Simulation of biological and environmental processes. Kyushu Univ. Press, 2004; 139p.
[14] Takakura T, Kozai T, Tachibana K, Jordan K A. Direct digital control of plant growth. I. Design and operation of the system. Trans. ASAE, 1974: 17: 1150–1154.
[15] Takakura T. Plant growth optimization using a small computer. Acta Hort., 1975; 46: 147–156.
[16] Takakura T, Ohara G. Direct digital control of plant growth II. Physiological analysis of cucumber plants. J. Agr. Met., 1976; 32: 107–115.
[17] Takakura T, Okada M, Shimaji H, Nara M. Development of a microprocessor-based multi-variable control system for greenhouses. J. Agr. Met., 1979; 35: 97–102.
[18] Takakura T. Historical overview environmental engineering in biology in Japan through over 50 years of research. Climate in Biosphere, 2018; 18: 3–12.
[19] Takakura T. Climate control to reduce energy inputs. Acta Hort., 1989; 245: 406–415.
[20] Kurata K, Takakura T. Simulation of climate within a solar greenhouse equipped with underground heat storage units. Proc. Int. Sym. on Thermal Application of Solar Energy, 1985; pp.521–526.
[21] Kurata K, Takakura T. Underground storage of solar energy for greenhouse heating I. Analysis of seasonal storage system by scale and numerical models. Trans. ASAE, 1991; 34: 563–569.
[22] Kurata K, Takakura T. Underground storage of solar energy for greenhouse heating II. Comparison of seasonal and daily storage systems. Trans. ASAE, 1991; 34: 2181–2186.
[23] Takakura T, Nishina H. A solar greenhouse with phase change energy storage and a microcomputer control system. Acta Hort., 1981; 115: 583–590.
[24] Nishina H, Takakura T. Studies on solar greenhouses with latent heat storage systems. Heating experiment in a greenhouse. J. Agr. Met., 1985; 40: 313–321.
[25] Takakura T. Plant solarimeter for energy balance. Acta Hort., 2008; 801: 615–621.
[26] Takakura T, Kubota C, Sase S, Hayashi M, Ishii M, Takayama K. Measurement of evapotranspiration rate in a single-span greenhouse using the energy-balance equation. Biosys. Eng., 2009; 102: 298–304.
[27] Miyahira M, Tamaki M, Akutsu M, Usui T, Okushima L, Kaiho A, et al. Calibration device development for spherical solar radiation sensors. J. Adv. Agr., 2015; 4: 371–376.
[28] Miyahira M, Usui T, Kaiho A, Okushima L, Takakura T. Lightweight, low-cost, automatic monitoring of global and diffused solar radiation. J. Agr. Met., 2014; 70: 133–138.
[29] Takakura T, Sunagawa H, Tamaki M, Usui T, Taniai N. In situ net photosynthesis measurement of a plant canopy in a single-span greenhouse. J. Adv. Agri., 2017; 7: 1015–1020.
[30] Takakura T, Shimomachi T, Takemasa T. Non-destructive detection of plant health. Proceedings of International Symposium on Design and Environmental Control of Tropical and Subtropical Greenhouses. Taichung, China, 2001; pp.147–151.
[31] Shimomachi T, Ou S, Ichimaru Y, Cho S, Takemasa T, Yamazaki Y, et al. Nondestructive detection of salt stress in tomato plants using microwave sensing: Method using an open-ended coaxial probe. Environ. Control in Biology, 2005; 43: 47–55.
[32] Shimomachi T, Takemasa T, Takakura T, Kurata K. Nondestructive detection of plant water stress by microwave sensing. Acta Hort., 2006; 710: 465–470.
[33] Son J E, Takakura T. Effect of EC of nutrient solution and light condition on transpiration and tipburn injury of lettuce in a plant factory. J. Agr. Met., 1989; 44: 253–258.
[34] Goto E, Takakura T. Prevention of lettuce tipburn by supplying air to inner leaves. Trans. ASAE, 1992; 35: 641–645.
[35] Goto E, Takakura T. Promotion of Ca accumulation in inner leaves by air supply for prevention of lettuce tipburn. Trans. ASAE, 1992; 35: 647–650. [36] Chun C, Takakura T. Dynamic management of root exposure to air above
the nutrient fluid surface for production of tomato transplants. Acta Hort., 1992; 319: 483–488.
[37] Chun C, Takakura T. Rate of root respiration of lettuce under various dissolved oxygen concentration in hydroponics. Environ. Control in Biol., 1994; 32: 125–135.
[38] Kurata K, Nagano T, Takakura T. Effects of fluctuating light on photosynthesis of some vegetables. J. Agr. Met., 1984; 40: 269–272. [39] Akutsu M, Izena J, Takakura T. Effect of EOD-FR on the growth and
morphology of Brassicaceae family plants in each cropping season. Hort. Res. (Japan), 2016; 15: 409–415.
[41] Takakura T, Goto E, Tanaka M. The effect of gravity on plant germination. Adv. Space Res., 1996; 18(4-5): 255–258.
[42] Goto E, Iwabuchi K, Takakura T. Effect or reduced total pressure on spinach growth. J. Agr. Met., 1993; 51: 139–143.
[43] Iwabuchi K, Goto E, Takakura T. Effect of O2 pressure under low air pressure on net photosynthetic rate of spinach. Acta Hort., 1995; 399: 101–106.
[44] Goto E, Takakura T. Application of plant growth models to estimate the gas and water balance in a crop production module. CELSS Journal, 1995; 7: 9–13.
[45] Takakura T, Shono H, Hojo T. Crop management by intelligent computer systems. Acta Hort., 1984; 148: 317–318.
[46] Okamura N K, Kurata K, Takakura T. Analysis of color changes in leaves of muskmelon plants under water stress. Environ. Control in Biology, 2001; 39: 27–34.
[47] Okamura N K, Shimomachi T, Takakura T. Nondestructive detection of
water stress in tomato plants by NIR spectroscopy. Environ. Control in Biology, 2001; 39: 75–85.
[48] Quan Z, Takakura T. Estimation of the seasonal cooling or heating load using a simulation model. J. Agr. Met., 1988; 44: 287–294.
[49] Quan Z, Takakura T. A strategy for calculating the maximum cooling load of a green-house. Acta Hort., 1988; 230: 519–526.
[50] Li S, Kurata K, Takakura T. Scale-model experiments on improving solar radiation transmission in a Chinese style lean-to greenhouse. J. Agr. Met., 1995; 51: 47–51.
[51] Li S, Kurata K, Takakura T. Solar radiation transmissivity into a lean-to greenhouse. Acta Hort., 1995; 399: 127–134.
[52] Li S, Kurata K, Takakura T. Scale-model experiments on direct solar radiation penetration into row crop canopies in a lean-to greenhouse. ASAE Paper, 1995; No.954489, 12p.