0 INTRODUCTION
Drilling is an essential part of processes used in subtractive manufacturing for achieving the desired products. Its massive usage requires that any parameter optimization in the process promotes the efficiency and the greener machining. Cutting tool technology is considered one of the most significant impact factors on the sustainability of machining processes and systems. Therefore, the best choice of cutting tools and parameters for the quality of the products and the tool life criterion are both critical for the sustainability metrics of a drilling process. The correct usage of the cutting tool can affect the reduction of needed resources and energy for the production of a new one. Aluminium alloy 7075 (Al7075) is suitable for a variety of specific applications in the aerospace and chemical industries because of its excellent mechanical properties. Its strength, which is comparable to many steels and its excellent corrosion resistance are the main reasons that researchers focus
on it [1] to [3]. The chemical composition of Al7075 is given in Table 1.
The development of an appropriate cutting factor analytical model is challenging. Nevertheless, there is much research developed about the suitability of different empirical models to predict different factors during several cutting processes. A number of methods, such as artificial neural networks (ANN) and response surface methodology (RSM), have been developed for modelling many manufacturing parameters. The successful application of ANN for prediction and modelling purposes in several science and engineering domains is substantial. ANN is utilized for modelling and prediction purposes due to its advantages in non-linear response and when time variability occurs. It covers the difficulty in inferring input/output mapping
[4] and [5] and the search algorithms for optimization, based on genetic and evolution principles [6] to [8]. RSM is a reliable statistical tool for the mathematical modelling of engineering systems and for the optimization of different manufacturing processes.
Modelling and Prediction of Thrust Force and Torque in Drilling
Operations of Al7075 Using ANN and RSM Methodologies
Efkolidis, N. – García Hernández, C. – Huertas Talón, J.L. – Kyratsis, P.
Nikolaos Efkolidis1,* – César García Hernández1 – José Luis Huertas Talón1 – Panagiotis Kyratsis2 1University of Zaragoza, Department of Design and Manufacturing Engineering, Spain
2Western Macedonia University of Applied Sciences, Department of Mechanical Engineering & Industrial Design, Greece
Many developed approaches for the improvement of sustainability during machining operations; one of which is the optimized utilization of cutting tools. Increasing the efficient use of cutting tool results in better product quality and longer tool life. Drilling is one of the most popular manufacturing processes in the metal-cutting industry. It is usually carried out at the final steps of the production process. In this study, the effects of cutting parameters (cutting velocity, feed rate) and tool diameter on thrust force (Fz) and torque (Mz) are investigated in the drilling of an Al7075 workpiece using solid carbide tools. The full factorial experimental design is implemented in order to increase the confidence limit and reliability of the experimental data. Artificial neural networks (ANN) and response surface methodology (RSM) approaches are used to acquire mathematical models for both the thrust force (Fz) and torque (Mz) related to the drilling process. RSM- and ANN-based models are compared, and it is clearly determined that the proposed models are capable of predicting the thrust force (Fz) and torque (Mz). Nevertheless, the ANN models estimate in a more accurate way the outputs used in comparison to the RSM models.
Keywords: sustainable manufacturing, Al7075, artificial neural networks, response surface methodology, thrust force, torque
Highlights
• Investigations of the effects of cutting parameters (cutting velocity, feed rate) and tool diameter on thrust force (Fz) and torque (Mz) in the drilling of an Al7075 workpiece using solid carbide tools are performed.
• Artificial neural networks (ANN) and response surface methodology (RSM) approaches are used to acquire mathematical models.
• RSM and ANN models are capable of predicting the thrust force (Fz) and torque (Mz) to a great extent. • ANN models estimate in a more accurate way the outputs used in comparison to the RSM models.
Table 1. Chemical composition of Al7075
Elements Zn Mg Cu Cr Fe Si Mn Ti Al
It has been considered to be useful with minimum knowledge about the process under consideration, while simultaneously reducing the resources needed for experiments. It is an appropriate methodology when many factors and interactions affect the desired responses for a given process and an effective technique for evaluating the process parameters with the least number of experiments [9] to [12].
The present paper deals with the study of the drilling process of Al7075 when using solid carbide tools. A series of different diameters were used, together with a number of different cutting speeds and feed rates. A complete set of experimental work was implemented, and different mathematical models of the thrust force and torque developed were calculated. Both RSM and ANN methodologies were applied, and although their results were highly accurate, the ANN model was more effective.
1 METHODS
As mentioned before, a number of researchers have focused on the development of empirical models to predict different factors during several cutting
processes. Nouioua et al. [13] developed ANN and
RSM models related to cutting force and surface roughness during the turning process of X210Cr12 steel under dry, wet, and MQL machining. Multilayer-coated tungsten carbide inserts with various nose radii were used for the experiment. Measurements were taken combining cutting speed, feed rate, and cutting depth. The comparison between ANN and RSM models showed that ANN models are more accurate for the prediction of surface roughness and
cutting force. Kumar and Chauhan [14] used RSM and
ANN methodologies in turning, for the validation of the results obtained during experimentation and the prediction of the behaviour of the system under any condition within the operating range. Al7075 hard ceramic composite and Al7075 hybrid composite were under investigation according to the effect of cutting parameters (cutting speed, feed rate, and approach angle) on roughness, using a polycrystalline diamond tool (PCD).
Furthermore, RSM, ANN and support vector regression (SVR) in turning operations were used
[15] for the development of empirical models for
predicting surface roughness, tool wear, and power required. These response parameters were mainly dependent upon cutting velocity, feed, and cutting time. The result was that ANN and SVR models are much better than RSM models for predicting the three response parameters. ANN and multiple regression
approaches were also used for the measurement of the surface roughness of AISI 1040 steel during turning at different cutting parameters, including speed, feed, and depth of cut [16]. The full factorial experimental design was implemented to increase the confidence limit and reliability of the experimental data. Finally, it was proved that the ANN model estimated the surface roughness more accurately than the multiple regression model did.
Many researchers have inestigated the appropriateness of different empirical models to
predict burr size during drilling. Karnik et al. [17]
described the comparison of the burr size predictive models based on ANN and RSM on AISI 316L stainless steel workpiece with cutting speed, feed and
point angle as the critical parameters.The comparison
showed that the ANN models provide more accurate predictions than the RSM models do. The result was the same for Çiçek et al. [18] for the investigation of the effects of cutting parameters (i.e. cutting speed, feed rate) and deep cryogenic treatment on thrust force in the drilling of AISI 316 stainless steel. Using the
same techniques Mayyas et al. [19] investigated the
influence of cutting speed, feed and volume fraction of the reinforcement particles used on the thrust force and torque in the drilling processes of self-lubricated
hybrid composite materials. While Bajić et al. [20]
examined the influence of three cutting parameters (cutting speed, feed per tooth and depth of cut) on surface roughness, tool wear and cutting force components in a face milling as part of the off-line
process control. Alharthi et al. [21] developed ANN
and regression analysis models for the prediction of surface roughness in a face milling of an AZ61 magnesium alloy workpiece, for different spindle speed [rpm], depth of cut [mm], and table feed [mm/ min]. The coefficient of determination was found to be sufficiently accurate for the best neural network and regression analysis model from the comparison of the models with thirteen experimental validation tests.
Rooki et al. [22] described a simple and more
reliable ANN method and multiple linear regressions (MLR) for the prediction of cutting concentration during foam drilling operation. The results indicated the high ability in the prediction of ANN methods.
Kahraman [23] investigated the predictability of
penetration rate for the diamond drilling from the operational variables and the rock properties, such as the uniaxial compressive strength, the tensile strength
and the relative abrasiveness. Finally, Chavoshi [24]
material removal rate, and over-cut of SAE-XEV-F valve-steel during electrochemical drilling in NaCl and NaNo3 electrolytic processes.
2 EXPERIMENTAL
2.1 Experimental Settings
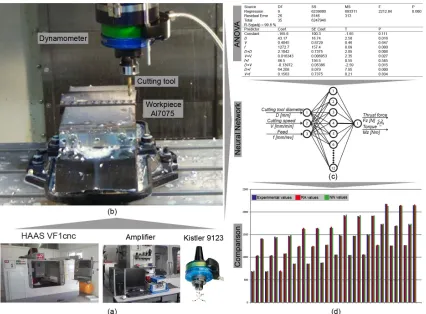
In this study, an Al7075 plate was used as the workpiece material (150 mm × 150 mm × 15 mm). The drilling tests were performed using a HAAS VF1 CNC machining centre with continuous speed and feed control within their boundaries. The cutting forces were measured by utilizing a Kistler four components dynamometer (type 9123) with all the appropriate accessories. The dynamometer signals were processed via charge amplifiers and an A/D converter to a personal computer. The measured thrust force and torque were displayed and analysed to implement an early error detection strategy.
During the drilling tests, thrust force (Fz) and torque (Mz) values were measured in 36 experiments
which were performed by using solid carbide drill tools (Kennametal - multilayer TiAlN-PVD-coated universal fine-grain grade). Fig. 1 shows details of the cutting tool geometry.
Fig. 1. Cutting tool; a) geometry details; and b) dimensions
The cutting tools are not through coolant category tools; therefore, coolant fluid (90 % water,
10 % KOOLRite 2270 coolant) was provided by the delivery system near the cutting tool. The feed rates of 0.2 mm/rev, 0.4 mm/rev, and 0.6 mm/rev were used together with cutting velocity values of 10 m/ min, 40 m/min, and 70 m/min. The constant depth of the holes drilled was 15 mm. The full factorial set of tests was performed for all the combinations of cutting speeds, feed rates, and tool diameters. The workflow of the research is depicted in Fig. 2 and the cutting parameters, units, and notations are listed in Table 2.
Table 2. Cutting variables used in the experiments
Parameters Values
Cutting velocity, V [m/min] 10, 40 ,70 Feed rate, f [mm/rev] 0.2, 0.4, 0.6 Tool diameter, D [mm] 8, 10, 12, 14 Axial depth of cut, ap [mm] 15 Workpiece dimension [mm] 150 × 150 × 15
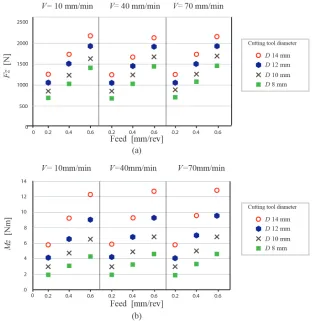
Fig. 3 expresses the evolution of thrust force and the cutting torque related to different feed rates and cutting speeds. According to the graph, it can be seen
that when the tool diameter increases, both the thrust force and the cutting torque values are increased as expected. The same happens in the case of the feed rate. As feed rate values are increased, the thrust force and the cutting torque are then increased respectively. In contrast, the different values of cutting speed do not noticeably affect the experimental values. The importance of cutting tool diameter and feed rate is much greater than that of cutting speed related to thrust force and cutting torque.
2.2 RSM-Based Predictive Models
The RSM is an accurate tool used to check the influence of a series of input variables on the response when studying a complex phenomenon. The models produced use the least square fitting in order to provide a reliable mathematical model. In this case, a full factorial strategy was followed, 36 drilling experiments were performed, and both the thrust force and torque were modelled using polynomial
mathematical models. The following form was selected for this case:
Y = b0 + b1X1 + b2X2 + b3X3 + b4X4 +
b11X12 + b22X22 + b33X32 + b44X42 +
b12X1X2 + b13X1X3 + b14X1X4 +
b23X2X3 + b24X2X4 + b34X3X4, (1)
where Y is the response, Xi stands for the coded
values and b0, …, b34 stand for the models’ regression
coefficients.
Based on this mathematical model, the data acquired formed the following equations for the thrust forces [N] and the torque [Nm] respectively:
Fz = –166 + 43.2 D + 0.405 V + 1273 f +
2.10 D×D + 0.0163 V 2 + 86 f 2 –
0.140 D×V + 64.2 D×f + 0.156 V×f (2) and
Mz = 4.52 – 0.913 D – 0.00502 V – 7.31 f +
0.0548 D×D – 0.000046 V 2 – 1.39 f 2 +
0.000405 D×V + 1.73 D×f + 0.0197 V×f (3)
where D is the tool diameter [mm], f is the feed rate [mm/rev], and V is the cutting speed used [m/min] and solid carbide tools and Al7075 workpiece.
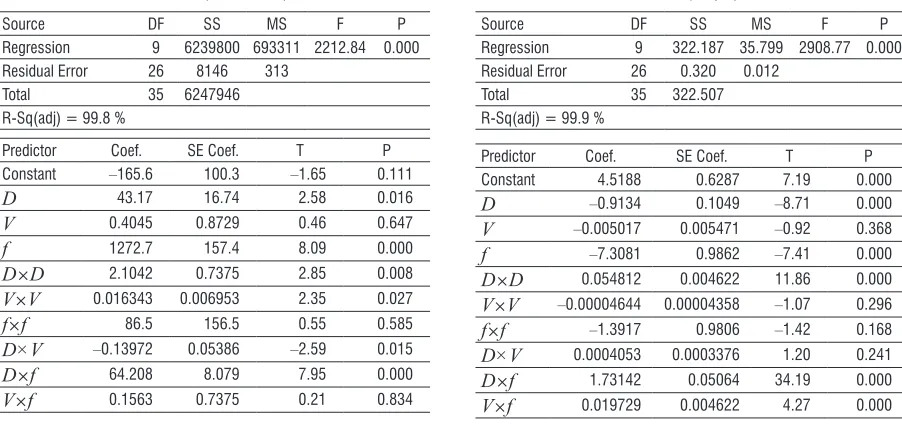
The adequacy of the models is provided at a 5 % level of significance. ANOVA was used for establishing the validity of the developed models. The calculated values of the F-ratio of the developed models (Tables 3 and 4), are significantly increased compared to the tabulated value of the F-table at a 95 % confidence level (2212.84 for the Fz and 2908.77 for the Mz), while the P-values are 0.000,
which proves the highest correlation between data and model in each case. The validity of the models is also proved because the R-sq(adj) is very high in both cases (99.8 % for the Fz and 99.9 % for the Mz). In addition, the significant terms of the models, when a level of significance of 5 % is used, are those with a P-value less than 0.05. For the Fz these factors are: D (P = 0.016), f (P = 0.000), D×D (P = 0.008), V×V (P = 0.015) and D×f (P = 0.000), while for the Mz the significant terms are: D (P = 0.000), f (P = 0.000), D2
(P = 0.000), D×f (P = 0.000), V×f (P = 0.000).
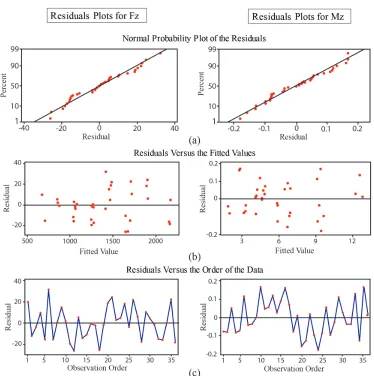
Residual analysis was performed to test the models’ accuracy; in both cases, the residuals follow the normal distribution. They follow straight lines (almost linear patterns) proving that the errors follow the normal distribution. All the scatter diagrams of the Fz and Mz residuals versus the fitted values depict that the residuals are evenly distributed on both sides of the centreline.
The same is true for the residuals versus the order of the data (see Fig. 4). The accuracy achieved is very high when comparing the measured values and those calculated from the mathematical models (3 % and 5.6 %, respectively). The derived mathematical models can be considered to be very accurate and can be used directly for predicting both the thrust force and the cutting torque within the limits of the tool diameter, feed rate, and cutting speed used.
Table 3. ANOVA table for the Fz (thrust force)
Source DF SS MS F P
Regression 9 6239800 693311 2212.84 0.000 Residual Error 26 8146 313
Total 35 6247946
R-Sq(adj) = 99.8 %
Predictor Coef. SE Coef. T P
Constant –165.6 100.3 –1.65 0.111
D 43.17 16.74 2.58 0.016
V 0.4045 0.8729 0.46 0.647
f 1272.7 157.4 8.09 0.000
D×D 2.1042 0.7375 2.85 0.008
V×V 0.016343 0.006953 2.35 0.027
f×f 86.5 156.5 0.55 0.585
D×V –0.13972 0.05386 –2.59 0.015
D×f 64.208 8.079 7.95 0.000
V×f 0.1563 0.7375 0.21 0.834
Table 4. ANOVA table for the Mz (torque)
Source DF SS MS F P
Regression 9 322.187 35.799 2908.77 0.000 Residual Error 26 0.320 0.012
Total 35 322.507
R-Sq(adj) = 99.9 %
Predictor Coef. SE Coef. T P
Constant 4.5188 0.6287 7.19 0.000
D –0.9134 0.1049 –8.71 0.000
V –0.005017 0.005471 –0.92 0.368
f –7.3081 0.9862 –7.41 0.000
D×D 0.054812 0.004622 11.86 0.000
V×V –0.00004644 0.00004358 –1.07 0.296
f×f –1.3917 0.9806 –1.42 0.168
D×V 0.0004053 0.0003376 1.20 0.241
D×f 1.73142 0.05064 34.19 0.000
Fig. 4. Residuals analyses for the Fz and Mz a) Normal Probability Plot of the Residuals, b) Residuals Versus the Fitted Values, c) Residuals Versus the Order of the Data
2.3 ANN Modelling
Artificial Neural Network ability to learn complex non-linear and multivariable relationships between process parameters makes them very useful in many applications. An ANN consists of a number of neurons, which are divided into the three basic layers: input, hidden, and output. The neurons between the layers are linked, having synaptic weights. One of the basic advantages of ANN is its ability to learn from the process. When the architecture of the network is defined, then, through a learning process, weights are calculated to present the desired output.
The present research used a series of neural network pieces of software available for the development of a multilayer feedforward neural network. An elementary neuron with R inputs is shown in Figure 6a. Each input is weighted with an appropriate value (w). The sum of the weighted inputs and the bias forms the input to the transfer function (f). Neurons can use any differentiable transfer function (f) to generate their output.
The standard network that is used for function fitting is a two-layer feedforward network, with a tan-sigmoid transfer function in the hidden layer and a linear transfer function in the output layer (see Fig. 6b). Assuming that the activation function used in the hidden and the outer layer is sigmoidal, the outputs of
the hidden and outer layer were calculated using the following equation:
f net
e net
( )= .
+ − 1
1 (4)
Fig. 6. Multilayer neuron network architecture, a) elementary neuron with R inputs, b) linear transfer function
All of the original (36) experimental data were randomly divided into three data sets including training, validation and testing. The back-propagation training algorithms, the scaled conjugate gradient (SCG) and Levenberg–Marquardt (LM), were used for ANNs training. The training set used 70 % of the data to build the network, 15 % to measure network generalization and 15 % as a testing set of the neural network. Three-layer network architectures were used to predict the thrust force and torque as shown in Fig. 5.
In the first case, a 3-(6~12)-2 ANN topology was used, which consists of three input nodes (tool
diameter, cutting speed, feed rate), one hidden layer (6 to 12 neurons) and two outputs (thrust force and torque). In the second case, two different 3-(6~12)-1 ANN topologies were used as the output layer consists of one neuron corresponding to one output variable Fz and Mz, respectively.
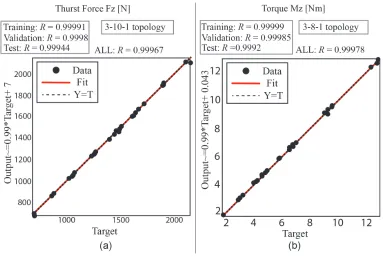
In consequence of trials, the best network architecture for the prediction of thrust force was the 3-10-1 topology. The comparison of predicted results from ANN model with experimental measurements shows that there is a very good correlation between them. It is obvious that a neural network is an excellent tool for predicted values of Fz according to experimentally measured ones. The correlation coefficient (R value) between the outputs and targets
is a measure of model accuracy. The R value for the entire dataset (training, validation and testing) is 0.99967, and it represents high correlation. In addition, all the categorized R-values (training, validation and test) are very close to 1 (see Fig. 7). When comparing both the measured and the predicted Fz values the highest discrepancy observed is 2.18%. In the case of Mz, the best network architecture for the prediction of the experimental values was the 3-8-1 topology. The R value for all the dataset (training, validation and testing) is 0.99978 and in each one of them separately is close to 1. As a result, the network achieves high accuracy (see Fig. 7). When comparing the measured with the predicted Mz values the highest difference observed is 3.15%. From the output of both cases, it
a)
b)
is concluded that the training of the ANN with one output for each case offers greater accuracy than in the case of the network with two outputs.
3 COMPARISON BETWEEN RSM AND ANN MODELS
A full factorial experimentation design is implemented to search for the effects of the cutting parameters (i.e. cutting speed, feed rate, and tool diameter) on the thrust force and torque in the case of drilling.
After each hole was made, the measurements of thrust force and torque were documented. Artificial neural network and response surface methodology
models were developed to predict the thrust force and torque using the experimental data.
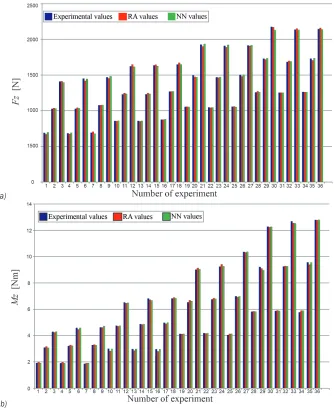
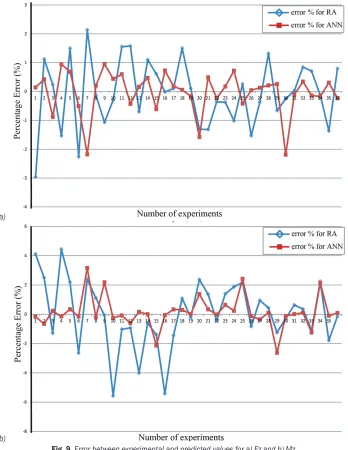
A comparison was established between the experimental values of Fz and Mz (see Fig. 8) and their values of ANN and RSM model, respectively. It is obvious that the predicted values from both models approximate the experimental values. Nevertheless, the predicted values from the ANN more accurately predict the experimental values than the regression analysis model. This can also be proved from the calculated percentage of error between experimental and predicted values of the models which are depicted in Fig. 9 for both the Fz and the Mz. In the case of
a)
b)
the ANN models, the accuracy achieved was 2.18 % and 3.15 % for both the thrust force and torque, while in the case of the response surface methodology model the accuracy achieved was 3 % and 5.6 %, respectively.
4 CONCLUSIONS
The optimization of a drilling process focused on cutting tools and parameters is a basic part of the entirely machining process, which influences sustainability. The aim of this study was the generation of mathematical models for the prediction of the thrust force (Fz) and torque (Mz) related to the cutting tools and other crucial cutting parameters as feed rate and cutting velocity during the drilling process. Two modelling techniques the RSM and ANN were used to predict the thrust force and torque in a series of drilling operations of Al7075. The developed models were considered to be very accurate for the prediction of the Fz and Mz within the range of the manufacturing parameters used. A number of different ANN architectures (3-(6~12)-2) and (3-(6~12)-1) have been tested to obtain the best neural network configuration in each case. Finally, the best architecture was the (3-10-1) for the case of the thrust force and the (3-8-1) for the case of torque. The outcomes proved that the accuracy achieved was 2.18 % and 3.15 % when using the ANN models for both the thrust force and torque measured, respectively. In the case of the RSM model, the accuracy achieved was 3 % and 5.6 %, respectively. As a result, both strategies are suitable for modelling and predicting thrust force and torque when drilling is concerned, but the application of ANN is slightly more accurate than the RSM one.
5 ACKNOWLEDGEMENTS
The authors would like to thank the Direction Team of the C3 CAD/CAM/CAE) Laboratory in the University of Applied Sciences of Western Macedonia, for its valuable help, making available human and technical resources.
6 REFERENCES
[1] Ucun, Ι. (2016). 3D finite element modelling of drilling process
of Al7075-T6 alloy and experimental validation. Journal of Mechanical Science and Technology, vol. 30, no. 4, p. 1843-1850, DOI:10.1007/s12206-016-0341-0.
[2] Suryaa, V.R., Kumara, K.M.V., Keshavamurthya, R., Ugrasenb G., Ravindrac H.V. (2017). Prediction of machining
Characteristics using artificial neural network in wire EDM of Al7075 based in-situ composite. 5th International Conference
of Materials Processing and Characterization (ICMPC) Proceedings, p. 203-212, DOI:10.1016/j.matpr.2017.01.014. [3] Karabulut, S., Karakoc, H. (2017) Investigation of surface
roughness in the milling of Al7075 and open-cell SiC foam composite and optimization of machining parameters. Neural Computing & Applications, vol 28, p. 313-327, DOI:10.1007/ s00521-015-2058-x.
[4] Osman, A., Mohd, N., Suziah, S., Wan F. (2009). Study of genetic algorithm to fully-automate the design and training of artificial neural network. International Journal of Computer Science and Network Security, vol. 9, no. 1, p. 217-226. [5] Leite, W.O., Campos Rubio, J.C., Duduch J.G., Maciel de
Almeida P.E. (2015). Correcting geometric deviations of CNC Machine-Tools: An approach with Artificial Neural Networks.
Applied Soft Computing, vol. 36, p. 114–124, DOI:10.1016/j. asoc.2015.07.014.
[6] Patra, K., Jha, A.K., Szalay, T., Ranjan J., Monostori L. (2017). Artificial neural network based tool condition monitoring in micromechanical peck drilling using thrust force signals.
Precision Engineering, vol. 48, p. 279-291, DOI:10.1016/j. precisioneng.2016.12.011.
[7] Qin, X., Wang, B., Wang, B., Li, H., Jiang, Y., Zhang, X. (2014). Delamination analysis of the helical milling of carbon fiber-reinforced plastics by using the artificial neural network model. Journal of Mechanical Science and Technology, vol. 28, no. 2, p. 713-719, DOI:10.1007/s12206-013-1135-2. [8] Cornea, R., Natha, C., Mansorib, M., Kurfessa, T. (2016).
Enhancing spindle power data application with neural network for real-time tool wear/breakage prediction during inconel drilling. Procedia Manufacturing, vol. 5. no. 1–14, DOI:10.1016/j.promfg.2016.08.004.
[9] Çiçek, A., Kıvak, T., Samtaş, G. (2012). Application of Taguchi
method for surface roughness and roundness error in drilling of AISI 316 stainless steel. Strojniški vestnik -Journal of Mechanical Engineering, vol. 58, no. 3, p. 165-174, DOI:10.5545/sv-jme.2011.167.
[10] Rao, S., Sethi, A., Das, A.K., Mandal, N., Kiran, P., Ghosh, R., Dixit, A.R., Mandal, A. (2017). Fiber laser cutting of CFRP composites and process optimization through response surface methodology. Materials and Manufacturing Processes, vol. 32, no. 14,p. 1612-1621, DOI:10.1080/1042 6914.2017.1279296.
[11] Thakre, A.A., Soni, S. (2016). Modeling of burr size in drilling of aluminum silicon carbide composites using response surface methodology. Engineering Science and Technology, an International Journal, vol. 19, no. 3, p. 1199–1205, DOI:10.1016/j.jestch.2016.02.007.
[12] Boyacı, A.İ, Hatipoğlu, T., Balcı, E. (2017). Drilling process
optimization by using fuzzy-based multi-response surface methodology. Advances in Production Engineering & Management, vol. 2, no. 2. p. 163-172, DOI:10.14743/ apem2017.2.248.
International Journal of Advanced Manufacturing Technology,
vol. 93, p. 2485-2504, DOI:10.1007/s00170-017-0589-2. [14] Kumar. R., Chauhan. S. (2015). Study on surface roughness
measurement for turning of Al 7075/10/SiCp and Al 7075 hybrid composites by using response surface methodology (RSM) and artificial neural networking (ANN). Measurement, vol. 65, p. 166-180, DOI:10.1016/j.measurement.2015.01.003. [15] Gupta, A.K. (2010). Predictive modelling of turning operations
using response surface methodology, artificial neural networks and support vector regression. International Journal of Product Research, vol. 48, no. 3, p. 763-778,
DOI:10.1080/00207540802452132.
[16] Asiltόrk, I., Ηunkas, M. (2011). Modeling and prediction of
surface roughness in turning operations using artificial neural network and multiple regression method. Expert Systems with Applications, vol. 38, no. 5, p. 5826–5832, DOI:10.1016/j. eswa.2010.11.041.
[17] Karnik, S.R., Gaitonde, V.N., Davim, J.P.A. (2008). Comparative study of the ANN and RSM modeling approaches for predicting burr size in drilling. International Journal of Advanced Manufturing Technology, vol. 38, p. 868-883, DOI:10.1007/ s00170-007-1140-7.
[18] Çiçek, A., Kıvak, T., Samtaş, G., Çay, Y. (2012). Modelling
of thrust forces in drilling of AISI 316 stainless steel using artificial neural network and multiple regression analysis.
Strojniški vestnik - Journal of Mechanical Engineering, vol. 58, no. 7-8, p. 492-498, DOI:10.5545/sv-jme.2011.297.
[19] Mayyas, A., Qasaimeh, A., Alzoubi, K., Lu, S., Hayajneh, M., Hassan, A. (2012). Modeling the drilling process of
aluminum composites using multiple regression analysis and artificial neural networks. Journal of Minerals and Materials Characterization and Engineering, volo 11, no. 10, p. 1039-1049, DOI:10.4236/jmmce.2012.1110108.
[20] Bajić, D., Celent, L., Jozić, S., Bajić, D., Celent, L., Jozić, S.
(2012). Modeling of the influence of cutting parameters on the surface roughness, tool wear and cutting force in face milling in off-line process control. Strojniški vestnik - Journal of Mechanical Engineering, vol. 58, no. 11, p. 673-682, DOI:10.5545/sv-jme.2012.456.
[21] Alharthi, N.H., Bingol, S., Abbas, A.T., Ragab, A.E., El-Danaf, E.A., Alharbi, H.F. (2017). Optimizing cutting conditions and prediction of surface roughness in face milling of AZ61 using regression analysis and artificial neural network, Advances in Materials Science and Engineering, vol. 2017, art. ID 7560468, DOI:10.1155/2017/7560468.
[22] Rooki, R., Ardejani, D.F., Moradzadeh, A. (2014). Hole cleaning prediction in foam drilling using artificial neural network and multiple linear regression. Geomaterials, vol. 4, no. 1, p. 47-53, DOI:10.4236/gm.2014.41005.
[23] Kahraman, S. (2016). Estimating the penetration rate in diamond drilling in laboratory works using the regression and artificial neural network analysis. Neural Processing Letters, vol. 43, no. 2, p. 523–535, DOI:10.1007/s11063-015-9424-7. [24] Chavoshi, S.Z. (2011). Analysis and predictive modeling