DEMOGRAPHIC RESEARCH
VOLUME 28, ARTICLE 37, PAGES 1053-1092
PUBLISHED 28 MAY 2013
http://www.demographic-research.org/Volumes/Vol28/37/ DOI: 10.4054/DemRes.2013.28.37
Research Article
Transitions to adulthood in urban Kenya:
A focus on adolescent migrants
Shelley Clark
Cassandra Cotton
© 2013 Shelley Clark & Cassandra Cotton.
This open-access work is published under the terms of the Creative Commons Attribution NonCommercial License 2.0 Germany, which permits use, reproduction & distribution in any medium for non-commercial purposes, provided the original author(s) and source are given credit.
1 Introduction 1054 1.1 Migration and transitions to adulthood 1055 1.2 Migration and changes in family structures 1058
2 Methods 1059
2.1 Data 1059
2.2 Samples 1060
2.3 Models and outcome measures 1060
2.4 Independent variables 1061
3 Results 1063
3.1 Descriptive characteristics 1063
3.2 Family support 1066
3.3 Schooling 1067
3.4 Employment 1071
3.5 Pregnancy 1075
3.6 Marriage 1078
4 Data limitations 1080
5 Discussion 1082
6 Acknowledgement 1083
References 1084
Transitions to adulthood in urban Kenya:
A focus on adolescent migrants
Shelley Clark1
Cassandra Cotton2
Abstract
BACKGROUND
Migration is often intrinsically tied to key adolescent transitions in sub-Saharan Africa. However, while many adolescents move in order to improve their life trajectories, migration may also coincide with new challenges and considerable disruption of family support.
OBJECTIVE
This paper seeks to better understand how migration and associated changes in family support are related to youth’s prospects of finishing secondary school, finding employment, getting married, and initiating child-bearing.
METHODS
Drawing on detailed life history data from over 600 young men and women in Kisumu, Kenya, we use piecewise exponential survival analysis to examine how migration is related to key transitions to adulthood and how variation in family support moderates these relationships. All analyses are run separately for young men and women.
RESULTS
Migration is associated with a sharp decline in parental support and a corresponding rise in reliance on other relatives, partners, or one’s self. For both men and women, migration also frequently coincides with a permanent exodus from school, which cannot be fully explained by changes in family support or transitions into marriage or work. We find strong evidence that young men move to Kisumu to obtain their first jobs and little evidence of subsequent discrimination against male migrants in the labor market.
1 Corresponding author. Ph.D. Associate Professor, Canada Research Chair in Youth, Gender, and Global
Health, McGill University. E-mail: [email protected].
For young women, not only does migration coincide with marriage, but young female migrants also get married and become pregnant at younger ages after they have moved.
CONCLUSIONS
Adolescent migrants experience significantly lower levels of parental support, are more likely to drop out of school, and make earlier transitions to adult roles, potentially increasing their long-term economic and social vulnerability.
1. Introduction
Adolescents are highly mobile. In sub-Saharan Africa, rates of migration for men rise steadily between the ages of 15 to 19 and are highest between the ages of 20 to 24 (Collinson, Tollman and Kahn 2007; National Research Council and Institute of Medicine 2005). Migration rates for women peak at an even younger age (Beguy, Bocquier and Zulu 2010; National Research Council and Institute of Medicine 2005). For many adolescents, migration is intrinsically linked to key transitions into adulthood. Adolescents may move as part of making a major transition—for example, when they marry or enter their first job. In other cases, they may move to an urban area simply in the hopes of furthering their education, securing paid employment, or finding a suitable spouse.
an important role for men as well as women, at least in industrialized societies (Kulu and Milewski 2007).3
In addition to these life transitions, moving is associated with substantial disruption in social and kin networks for both male and female adolescent migrants (Brockerhoff and Biddlecom 1999). The move to a new city often means leaving behind friends, extended family, and neighbors, even for adolescent migrants who move with one or both of their parents. The majority of adolescents who move after the age of 14, however, will move without their parents (Collinson 2009; International Labour Organization 2004; Kadonya et al. 2002; McKenzie 2008). For them, migration will coincide with dramatic changes in their support from family members, which in turn may affect their trajectories. Thus, migration may have both a direct effect on the timing of key adolescent transitions as well as an indirect effect through its profound changes in family structures and support.
This paper focuses on three primary questions: 1) Do adolescent migrants make important transitions into adulthood earlier than non-migrants?; 2) How does the relationship between migration and adolescent transitions differ by gender or place of origin?; and 3) Can differences in family support received by migrants and non-migrants explain their different trajectories? To address these questions, we use detailed retrospective life history data of young adults (aged 18 to 24) living in Kisumu, Kenya to examine how the timing of migration shapes transitions relating to education, work, marriage, and pregnancy. We explore these differences for men and women and for urban and rural migrants. Lastly, we assess whether changes in family support associated with migration partially or fully account for the different life trajectories of migrants. By closely examining these relationships, we offer new insights into both the potentially beneficial and detrimental effects of migration for Africa’s youth.
1.1 Migration and transitions to adulthood
Studying the relationship between migration and adolescent transitions is complex. Much depends on the timing of migration relative to the transition of interest. Yet, given the high density of events that occur during adolescence, parsing out the exact temporal order is often difficult, especially if transitions are only recorded in yearly increments (Brockerhoff and Eu 1993). Consequently, most of what we know about internal migration in sub-Saharan Africa comes from a handful of life history studies primarily conducted in west Africa (Agwanda et al. 2004; Beauchemin 2005;
3 Kulu and Milewski (2007) provide an excellent summary of the literature on migration and demographic
Beauchemin and Bocquier 2004; Le Jeune, Piché and Poirier 2005; Lesclingand 2004, 2011; Reed, Andrzejewski and White 2010; White et al. 2008) and a small number of longitudinal studies (Anglewicz 2012; Hertrich and Lesclingand 2012; Beegle and Poulin 2011; Zourkaleini and Piché 2007).
These studies often focus on three critical time periods in which transitions occur: before migration, at the same time as migration, or after migration. First, it is well-known that migration is a highly selective process. Thus, youths who have already completed certain transitions may be more or less likely to move to an urban area. For example, youth who finished their schooling may be more likely to migrate. Second, migration may be so closely tied to transitions to adulthood that these two events may be perfectly “synchronized” or occur at nearly the same time (Mulder and Wagner 1993). Examples of synchronized events include moving as part of the marriage process or leaving school as a result of moving to another town. Third, moving to an urban area may have a longer-term effect on the timing of adolescent transitions by offering youth both increased opportunities (more schools, more jobs, and more potential sexual and marital partners) and greater challenges (less support from family and possible discrimination based on ethnic or regional differences). Finally, the relationship between migration and adolescent transitions may depend on where the adolescent is coming from. Not only are there well-known differences in the ages of adolescent transitions between rural and urban areas, but the adjustment to life in the city may also be more pronounced for adolescents coming from rural areas. Thus, as the brief summary below illustrates, both the timing of migration and the origin of the migrant have important implications for youths’ education, employment, union formation, and fertility outcomes.
In many countries, both male and female adolescents move in pursuit of better educational opportunities offered in larger cities (Beegle and Poulin 2011). A growing number of wealthier rural families are sending their adolescent children to boarding schools, vocational schools, and post-secondary educational programs in urban areas. Many of these youths live with groups of peers (often in the same educational program) in dorms or apartments. Others are sent to live with urban relatives. Of course, some of the expectations of the advantages of city life may not be fulfilled. Erulkar and colleagues (2006) find that although many young girls were sent to live with relatives in Addis Ababa with the promise of attending better quality schools, this rarely was the reality. Usually, aunts, uncles, and cousins could not find the resources to send these girls to school and instead only kept them to work as domestic helpers (Ferede and Erulkar 2009). In other cases, the process of moving may be disruptive, as migrants are forced to leave one school and enroll in another.
Council and Institute of Medicine 2005). Compared to rural areas, cities offer youth a much broader array of career paths and a wider choice of entry-level positions or self-employment opportunities with little up-front capital investment. Nonetheless, although jobs may be relatively more plentiful in urban areas, finding a job in a new city may prove challenging. Young migrants may be compelled to take more hazardous and lower-paying jobs since youths, in general, face increased vulnerability in urban labor markets, particularly during times of economic crisis (Calves and Schoumaker 2004). Yet some studies suggest that migrants do not face any greater disadvantage in the labor market than non-migrants (Zourkaleini and Piché 2007). In some instances, migrants may even perform better on the job market because of a selection effect that draws more skilled youths into cities (Miguel and Hamory 2009). These findings, however, primarily apply to men, and a series of studies focused on Kenya’s formal urban labor market found that discrimination and lower levels of education make it significantly harder for migrant women to find jobs relative to migrant men (Agesa and Agesa 1999, 2005; Agwanda et al. 2004). In many parts of sub-Saharan Africa, young girls and women move to urban areas to assume positions as “les petites bonnes” (domestic servants) (Jacquemin 2009). These positions are often associated with mistreatment and limited opportunities for schooling or job advancement. Thus, labor migration for young women offers both opportunities and risks (Lesclingand 2004, 2011).
Marriage and union formation are generally very closely associated with migration, particularly for women. A study in Ethiopia found that getting married was the main motivation for migrating among 10-29 year olds, with 79% of females and 64% of males reported as having migrated for marriage (Ezra and Kiros 2001). Moving to an urban area may also shape young men’s and women’s views about marriage. Female adolescents in urban areas, for example, not only tend to marry at an older age, but are also expected to be more involved in the process of choosing their partners (Takyi et al. 2003).
1.2 Migration and changes in family structures
These competing hypotheses suggest that whether migration is associated with earlier or later transitions into adulthood will depend on the selection effects of migrants, the reason for migrating, and the subsequent opportunities and challenges that young migrants face after they move. In addition, adolescent migration may have an important indirect effect on the timing of transitions if it coincides with changes in the family structures or levels of family support. In some instances, changes in family structure may actually precipitate a move. Historically, both parental death and divorce have led to adolescents setting out on their own (Goody 1976). In the wake of the AIDS epidemic in parts of sub-Saharan Africa, there has been a rising number of orphans and a subsequent increase in fostered and independent adolescents (Madhavan 2004; Parikh et al. 2007). Even for non-orphans, the process of migration is likely to coincide with a dramatic change in their family structure and level of support as the majority of migrants above the age of 14 move without their parents (Collinson 2009; International Labour Organization 2004; Kadonya et al. 2002; McKenzie 2008). Many of these adolescent migrants establish independent households, move in with other relatives, or form new households with their spouse.
2. Methods
2.1 Data
The data for our analyses are drawn from an innovative life history calendar which was specifically designed to capture key adolescent transitions including the development of romantic and sexual partnerships, transitions in and out of school, and engagement with income-generating activities. This ten-year retrospective calendar gathered monthly data on the respondents’ educational attainment, employment status, sexual activity, pregnancies, and marriages. It also recorded data on residential location and family relationships. Studies in west Africa have used similar types of retrospective history data to assess both the causes and consequences of migration (Beauchemin and Bocquier 2004; Le Jeune, Piché, and Poirier 2005; Reed, Andrzejewski, and White 2010; White et al. 2008), but there have been few such studies in east Africa.
2.2 Samples
To meet our desired sample size we contacted every other household in 45 randomly selected urban enumeration areas within Kisumu. Young men and women aged 18 to 24 in the selected households were eligible to be interviewed. One respondent was randomly chosen per household. Since one of the primary objectives of this project was to compare data collected via a standard demographic survey to data collected by an innovative life history calendar, respondents were randomly assigned to receive one of these survey instruments. In the present study, we use data from respondents who received the life history calendar only, as data collected in the standard demographic surveys is insufficient to address our research questions. Thus, our sample consists of a total of 608 respondents (286 women and 322 men).
Since we are interested in four transitions relating to schooling, first job, first marriage, and first pregnancy, we create distinct samples for each transition for young women. For young men, we create analogous samples with respect to schooling, work, and partner’s pregnancy. However, we do not assess transitions into marriage for men, as too few young men in our sample (n=10) made this transition by the time of the survey. For our oldest respondents (age 24), the 10-year retrospective life history calendar begins at age 14. Thus, to avoid left truncation and ensure that all respondents are observed for a similar age interval, we begin our period of observation at age 14 and remove respondents who made the relevant transition before the age of 14. For female samples, we remove 25 individuals from our schooling sample, two from the job sample, 1 from the marriage sample, and seven from the pregnancy sample. For the male samples, the corresponding numbers of respondents dropped are 26 for schooling, ten for work, and zero for pregnancy.
2.3 Models and outcome measures
Our first set of survival analysis models examines the covariates associated with dropping out of school before completing secondary school. Respondents are considered to have “dropped out” if they are no longer enrolled in school and did not complete at least nine months of Form 4. Students who were temporarily not enrolled in school because of school holidays or absences between grades are not considered to have dropped out. In addition, students who are still enrolled in school or who have completed at least nine months of Form 4 are treated as censored.4 In all other analyses of first month of employment, first pregnancy, and first marriage, respondents who have not made the transition of interest by the time of the survey are censored. Employment is defined as earning more than 2,000 Kenyan shillings per month (approximately $25 USD). This amount is equivalent to approximately half of what a full-time waged employee might earn in Kisumu, and is roughly equivalent to the earnings a young person might expect to make through semi-regular employment in the informal sector.
2.4 Independent variables
In our analyses, we are primarily interested in how migration during adolescence and family support structures are related to the timing of adolescent transitions. As such, we focus on two key independent variables: 1) migration since the age of 14 and 2) family support. Respondents who lived in Kisumu at the age of 14 are classified as “non-migrants” and serve as our reference group. Respondents who migrated to Kisumu before the age of 14 are not considered migrants for the purposes of our analysis, as other research suggests the majority of children who move before the age of 14 are moving with their parents while later migrants are more likely to move independently (Collinson 2009; International Labour Organization 2004; Kadonya et al. 2002; McKenzie 2008; Miguel and Hamory 2009). To best capture variation in the timing of migration, we divide migrants’ life histories into three distinct time periods: 1) before they moved to Kisumu, 2) at the same time as their move (which includes a four-month window around the month of their reported move), and 3) after they moved to Kisumu. For each of these three time periods, we further distinguish between respondents who lived in urban and rural areas before moving to Kisumu. Thus, our “migrant” respondents are classified into six different categories that change over time (before, during, and after migration) and reflect whether their place of origin was urban or rural.
4 Since relatively few respondents had neither completed secondary school nor dropped out by the time of the
To measure support from family members, we combine information gathered from two sets of questions. First, for each month of the life history calendar, respondents were asked to indicate “who, if anyone, was the primary person responsible for you in the household?” The concept of the person who bears primary responsibility for a child or youth is somewhat foreign in western cultures, but it is well defined and understood locally. In Luo the term is “ng’a manepidhi” and in Swahili it is “mlezi ama mtu aliyekusaidia kwa mahitaji yako.” These terms refer to the primary caregiver, who may or may not be the household head, but who is responsible for making sure that the basic daily needs of the respondent are met including their food, clothing, and lodging. This person also often plays a central role in making decisions about schooling and generally knows the whereabouts and activities of the respondent. Because this concept is better understood in the local languages, interviewers were specifically instructed to always use the expression in Luo or Swahili. Respondents gave their specific relationship to this person (e.g. father, stepmother, paternal grandmother, maternal aunt, sister, employer) and we collapsed these relationships into five categories: 1) biological father, 2) biological mother, 3) other relative, 4) non-relative or self,5 and 5) partner/spouse. Since only one male respondent ever reported his spouse as the primary person responsible for him, his responses were reclassified as “non-relative or self.”
Second, whether or not a respondent is a single or double orphan can also significantly affect their living arrangements and the amount of support received from family members. For example, respondents whose parents are alive may choose to live with relatives because of the greater educational and employment opportunities in Kisumu while adolescents whose parents have died may be compelled to move with relatives. Hence, the category “cared for by relatives” may have different implications depending on whether the respondent is an orphan. Consequently, we combine our measure of “responsible person” with “orphanhood status” to create our measure of family support. This measure consists of seven categories: 1) parent is responsible, both parents are alive; 2) father is responsible, mother is dead; 3) mother is responsible, father is dead; 4) a relative is responsible, at least one parent is alive; 5) a relative is responsible, both parents are dead; 6) a non-relative or the respondent is responsible (regardless of whether or not parents are alive), and 7) the respondent’s spouse or
5 We combine the categories of relative and self as the vast majority of respondents who identify a
partner is responsible.6 Our measure of family support varies over time to reflect the changes in living arrangements and parental survival of these adolescents.
Finally, since the timing of some transitions may have a strong effect on subsequent transitions, we also include what Billari (2005) refers to as “internal covariates” in life course analyses in our third models. Specifically, we include time-varying measures of our four transitions: 1) educational enrollment and performance (measured as being on-track or behind with respect to their age-for-grade), 2) employment, 3) pregnancy, and 4) marriage or marital aspirations.7 All of our models also include the external covariates indicating ethnicity and religion, as these may differ considerably between migrants and non-migrants. Unfortunately, our survey does not include retrospective measures of household assets or wealth. Including measures of current household wealth are likely to be highly endogenous. For example, not only are adolescent girls from poorer households more likely to drop out of school, but also young women who do not complete secondary school may be more likely to currently live in poorer households. To assess the overall potential for bias in excluding measures of household economic status, we include a composite measure of household wealth and present these results in Appendices A and B.8 Adding indicators of household wealth has the most appreciable effect on the coefficients in the schooling models for boys and girls, but overall our primary results are not altered.
3. Results
3.1 Descriptive characteristics
Figure 1 shows the failure curves (1 – survival functions) for each of the four transitions by sex of the respondent. The first graph shows evidence that adolescent girls drop out of school at younger ages than boys. Well over half of girls have failed to complete secondary school by the age of 20 compared to about 40% of boys. Despite Kenya’s
6 Of respondents reporting themselves or a non-relative as the person responsible, the majority (over 60%) are
not orphans.
7 Respondents were asked, “In the first month of your relationship with [partner’s initials], did you want to or
plan to eventually marry him/her? Was marriage to this person ever in your mind? Over the course of the relationship did this ever change, and to what?” Respondents’ answers were coded as ‘yes,’ ‘no,’ ‘never considered,’ or ‘don’t know.’
8 We create our measure of household wealth using principal component analysis of ownership of key
remarkable success at achieving nearly universal primary school completion for both boys and girls, this gender gap in secondary school completion is consistent with other studies (Hungi and Thuku 2010). However, young women are significantly less likely than young men to enter the labor market. Instead, women become mothers and wives at younger ages. Almost half of women have their first pregnancy and slightly over a quarter of women will become married before the age of 20. In contrast, while a negligible fraction of men marry before the age of 20, almost one-fifth report that they are responsible for impregnating at least one of their partners.
Figure 1: Timing of adolescent transitions by sex
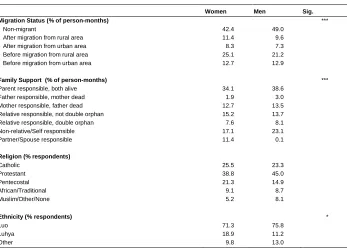
Table 1 highlights notable gender differences in the time spent as migrants. To best describe our time-varying variable of migration status, Table 1 shows the percentage of person-months men and women spent in the different migrant categories between the ages of 14 and 20. Men are slightly more likely than women to be non-migrants (i.e. to always have lived in Kisumu) (49.0% vs. 42.4%). Although more detailed analyses
0. 00 0. 25 0. 50 0. 75 1. 00
14 15 16 17 18 19 20
Age Female Male Out of School
0. 00 0. 25 0. 50 0. 75 1. 00
14 15 16 17 18 19 20
Age Female Male Ever Pregnant 0. 00 0. 25 0. 50 0. 75 1. 00
14 15 16 17 18 19 20
Age Female Male Ever Employed 0. 00 0. 25 0. 50 0. 75 1. 00
14 15 16 17 18 19 20
indicate that most urban migrants are moving from smaller urban towns rather than the large cities of Nairobi or Mombasa, we nonetheless find that migration from rural areas is more common than from urban areas for both men and women. Table 1 also demonstrates the diversity of family support that young men and women receive between the ages of 14 and 20. On average, men and women spend slightly over a third of their time being cared for by both parents, although this percentage declines with age. Adolescents also report spending a sizeable fraction of their time (17.1% for women and 23.1% for men) being primarily responsible for themselves or depending on a non-relative, most often a roommate. However, women report spending a substantial fraction of their time depending on a spouse or partner (11.4%), whereas a meager 0.1% of men name their partner as the person who is most responsible for their well-being.
Table 1: Descriptive characteristics of young men and women
Women Men Sig. Migration Status (% of person-months) ***
Non-migrant 42.4 49.0
After migration from rural area 11.4 9.6 After migration from urban area 8.3 7.3 Before migration from rural area 25.1 21.2 Before migration from urban area 12.7 12.9
Family Support (% of person-months) *** Parent responsible, both alive 34.1 38.6
Father responsible, mother dead 1.9 3.0 Mother responsible, father dead 12.7 13.5 Relative responsible, not double orphan 15.2 13.7 Relative responsible, double orphan 7.6 8.1 Non-relative/Self responsible 17.1 23.1
Partner/Spouse responsible 11.4 0.1
Religion (% respondents)
Catholic 25.5 23.3
Protestant 38.8 45.0
Pentecostal 21.3 14.9
African/Traditional 9.1 8.7
Muslim/Other/None 5.2 8.1
Ethnicity (% respondents) *
Luo 71.3 75.8
Luhya 18.9 11.2
Other 9.8 13.0
3.2 Family support
These averages in time spent receiving different types of family support, however, mask the changes that may occur in the time interval immediately around migration. Figures 2 and 3 show family support for migrants one month before and one month after their move to Kisumu. These figures demonstrate that the changes in family support around the time of a move are quite dramatic. For female migrants, we find that in the span of two months there is a sharp decline in the percentage who are supported by a parent (with two living parents), which drops from a third to less than 15%. At the same time, there is corresponding rise in the percent relying on a partner. For male migrants, we also find that the proportion supported by a parent (with two living parents) falls significantly while the proportion living with non-relatives or on their own rises (Figure 3). Subsequent analyses (not shown) further indicate that these changes tend to be greater for migrants from rural areas than from other urban areas. Such sharp transitions in family support may have an important effect on the well-being of young migrants and help to explain differences in their transitions to adulthood.
Figure 2: Family support before & after moving to Kisumu (women)
***
***
*** ***
***
***
0 5 10 15 20 25 30 35
Parent - both
parents alive Father - motherdead Mother - Fatherdead double orphanRelative - Not Relative - Doubleorphan Non-Relative/Self Partner/Spouse
Per
cen
t
Type of Family Support
Figure 3: Family support before & after moving to Kisumu (men)
3.3 Schooling
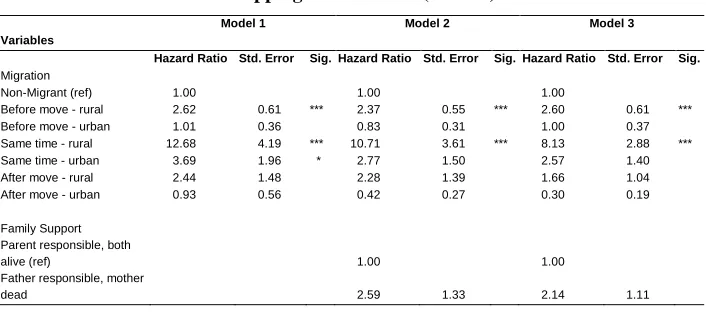
Tables 2 and 3 explore the factors associated with dropping out of school for young women and men, respectively. Model 1 of Table 2 examines the risk of dropping out of school for adolescent women with respect to when they moved to Kisumu, after controlling for social and demographic characteristics. Not surprisingly, we find that females from rural areas are significantly more likely than non-migrants to drop out of school before moving to Kisumu. However, rural young women’s greatest risk of leaving school permanently occurs in the four-month interval around their move to Kisumu. In fact, for young rural women, the risk of dropping out is significantly higher at the time of migration (hazard ratio 12.7) than before (hazard ratio 2.6; p-value <= 0.000) moving to Kisumu. In contrast, migrants living in urban areas are no more likely than adolescents living in Kisumu to drop out of school before their move, but the short interval around migration is associated with more than a three-fold increase in the risk of dropping out of school for urban migrants. Once female migrants move to Kisumu and enroll in school there, we continue to find that rural migrants face a greater risk of
**
** **
**
0 5 10 15 20 25 30 35 40
Parent - both
parents alive Father - motherdead Mother - Fatherdead double orphanRelative - Not Relative - Doubleorphan Non-Relative/Self
Per
cen
t
Type of Family Support
leaving school than urban migrants. These differences, however, are not statistically significant.
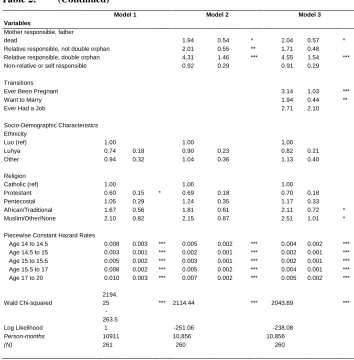
Model 2 includes our measures of family support. Compared to female adolescents with support from two living parents, adolescents who are supported only by their mothers are almost twice as likely to drop out of school. Female double orphans who are dependent on relatives experience over a four-fold increase in their risk of leaving school while non-orphans supported by relatives are twice as likely to drop out of school.9 Taking into account differences in family structures between non-migrants and migrants, we find that the effects of migration from a rural area are only slightly weakened. However, urban migrants are no longer significantly more likely to leave school at the time of migration. Lastly, in Model 3, we control for differences in the timing of employment, pregnancy, and wanting to get married.10 Not surprisingly, young women who become pregnant or find a partner they want to marry are significantly more likely to leave school. The effects of having a job, however, are not significant. Including these measures further diminishes the effect of moving from a rural area, reducing the hazard rate from 10.7 in Model 2 to 8.1 in Model 3, although this association remains highly significant. These results indicate that changes in family support, marriage, or employment do not fully explain the exceptionally high dropout rate from school of young rural women at the time of migration.
Table 2: Predictors of dropping-out of school (women)
Model 1 Model 2 Model 3
Variables
Hazard Ratio Std. Error Sig. Hazard Ratio Std. Error Sig. Hazard Ratio Std. Error Sig. Migration
Non-Migrant (ref) 1.00 1.00 1.00
Before move - rural 2.62 0.61 *** 2.37 0.55 *** 2.60 0.61 *** Before move - urban 1.01 0.36 0.83 0.31 1.00 0.37 Same time - rural 12.68 4.19 *** 10.71 3.61 *** 8.13 2.88 *** Same time - urban 3.69 1.96 * 2.77 1.50 2.57 1.40 After move - rural 2.44 1.48 2.28 1.39 1.66 1.04 After move - urban 0.93 0.56 0.42 0.27 0.30 0.19
Family Support Parent responsible, both
alive (ref) 1.00 1.00
Father responsible, mother
dead 2.59 1.33 2.14 1.11
9 Model 2 does not include a category for women supported by a partner or spouse as all women left school
before they became dependent on a partner or spouse.
10 In Model 3, we examine adolescent women’s desire to marry their partner rather than their actual marital
Table 2: (Continued)
Model 1 Model 2 Model 3 Variables
Mother responsible, father
dead 1.94 0.54 * 2.04 0.57 *
Relative responsible, not double orphan 2.01 0.55 ** 1.71 0.48 Relative responsible, double orphan 4.31 1.46 *** 4.55 1.54 *** Non-relative or self responsible 0.92 0.29 0.91 0.29
Transitions
Ever Been Pregnant 3.14 1.03 ***
Want to Marry 1.94 0.44 **
Ever Had a Job 2.71 2.10
Socio-Demographic Characteristics Ethnicity
Luo (ref) 1.00 1.00 1.00
Luhya 0.74 0.18 0.90 0.23 0.82 0.21 Other 0.94 0.32 1.04 0.36 1.13 0.40
Religion
Catholic (ref) 1.00 1.00 1.00
Protestant 0.60 0.15 * 0.69 0.18 0.70 0.18 Pentecostal 1.05 0.29 1.24 0.35 1.17 0.33 African/Traditional 1.67 0.56 1.81 0.61 2.11 0.72 * Muslim/Other/None 2.10 0.82 2.15 0.87 2.51 1.01 *
Piecewise Constant Hazard Rates
Age 14 to 14.5 0.008 0.003 *** 0.005 0.002 *** 0.004 0.002 *** Age 14.5 to 15 0.003 0.001 *** 0.002 0.001 *** 0.002 0.001 *** Age 15 to 15.5 0.005 0.002 *** 0.003 0.001 *** 0.002 0.001 *** Age 15.5 to 17 0.008 0.002 *** 0.005 0.002 *** 0.004 0.001 *** Age 17 to 20 0.010 0.003 *** 0.007 0.002 *** 0.005 0.002 ***
Wald Chi-squared
2194.
25 *** 2114.44 *** 2043.89 ***
Log Likelihood
-263.5
1 -251.06 -238.08
Person-months 10911 10,856 10,856
(N) 261 260 260
Note: * p<0.05, ** p<0.01, *** p<0.001. The number of observations (N) and person-months vary from Model 1 to Model 3 due to missing values for some variables.
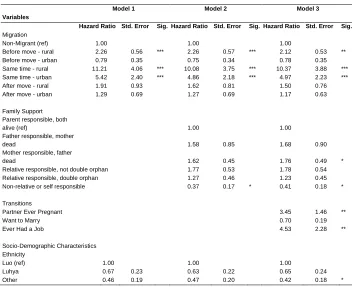
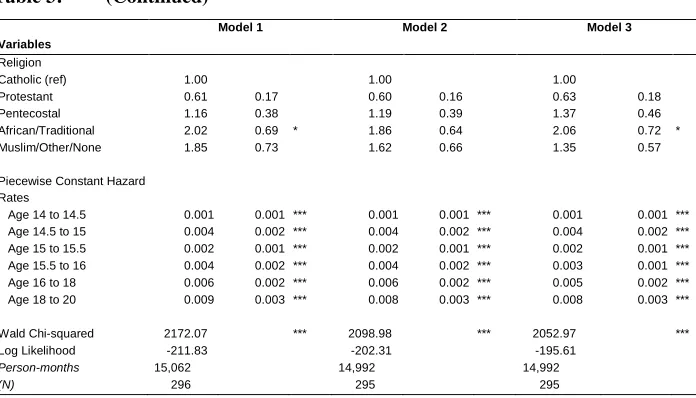
family support (Model 2) and the timing of other transitions (Model 3) reduces the magnitude of these hazard rates slightly, but they remain highly significant, indicating that the effect of migration on schooling is not primarily driven by changes in family structure or coterminous transitions into marriage or work. In fact, the effects of family support on educational attainment are notably weaker for male adolescents than for females. Nonetheless, adolescent males who are cared for by only their mothers are significantly less likely to remain in school than those who are supported by two living parents. Moreover, young men who report being self-reliant or depending on a non-relative are less likely to drop out of school, which suggests that many of these young men are in boarding schools as noted above. We also find that if a young man’s partner becomes pregnant, the odds that he will drop out of school increase three-fold. However, unlike female adolescents, young men who wish to marry their partners are not more likely to drop out, but those who have found gainful employment are.
Table 3: Predictors of dropping-out of school (men)
Model 1 Model 2 Model 3
Variables
Hazard Ratio Std. Error Sig. Hazard Ratio Std. Error Sig. Hazard Ratio Std. Error Sig. Migration
Non-Migrant (ref) 1.00 1.00 1.00
Before move - rural 2.26 0.56 *** 2.26 0.57 *** 2.12 0.53 ** Before move - urban 0.79 0.35 0.75 0.34 0.78 0.35 Same time - rural 11.21 4.06 *** 10.08 3.75 *** 10.37 3.88 *** Same time - urban 5.42 2.40 *** 4.86 2.18 *** 4.97 2.23 *** After move - rural 1.91 0.93 1.62 0.81 1.50 0.76 After move - urban 1.29 0.69 1.27 0.69 1.17 0.63
Family Support Parent responsible, both
alive (ref) 1.00 1.00
Father responsible, mother
dead 1.58 0.85 1.68 0.90
Mother responsible, father
dead 1.62 0.45 1.76 0.49 *
Relative responsible, not double orphan 1.77 0.53 1.78 0.54 Relative responsible, double orphan 1.27 0.46 1.23 0.45 Non-relative or self responsible 0.37 0.17 * 0.41 0.18 *
Transitions
Partner Ever Pregnant 3.45 1.46 **
Want to Marry 0.70 0.19
Ever Had a Job 4.53 2.28 **
Socio-Demographic Characteristics Ethnicity
Luo (ref) 1.00 1.00 1.00
Luhya 0.67 0.23 0.63 0.22 0.65 0.24
Table 3: (Continued)
Model 1 Model 2 Model 3
Variables
Religion
Catholic (ref) 1.00 1.00 1.00
Protestant 0.61 0.17 0.60 0.16 0.63 0.18 Pentecostal 1.16 0.38 1.19 0.39 1.37 0.46 African/Traditional 2.02 0.69 * 1.86 0.64 2.06 0.72 * Muslim/Other/None 1.85 0.73 1.62 0.66 1.35 0.57
Piecewise Constant Hazard Rates
Age 14 to 14.5 0.001 0.001 *** 0.001 0.001 *** 0.001 0.001 *** Age 14.5 to 15 0.004 0.002 *** 0.004 0.002 *** 0.004 0.002 *** Age 15 to 15.5 0.002 0.001 *** 0.002 0.001 *** 0.002 0.001 *** Age 15.5 to 16 0.004 0.002 *** 0.004 0.002 *** 0.003 0.001 *** Age 16 to 18 0.006 0.002 *** 0.006 0.002 *** 0.005 0.002 *** Age 18 to 20 0.009 0.003 *** 0.008 0.003 *** 0.008 0.003 ***
Wald Chi-squared 2172.07 *** 2098.98 *** 2052.97 *** Log Likelihood -211.83 -202.31 -195.61
Person-months 15,062 14,992 14,992
(N) 296 295 295
Note: * p<0.05, ** p<0.01, *** p<0.001. The number of observations (N) and person-months vary from Model 1 to Model 3 due to missing values for some variables.
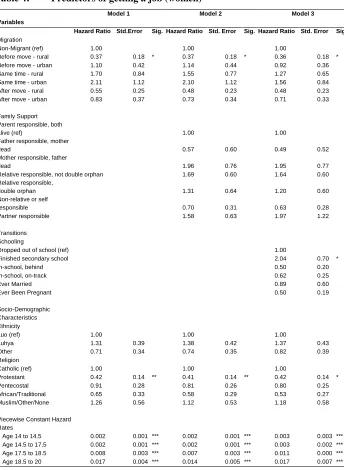
3.4 Employment
Table 4: Predictors of getting a job (women)
Model 1 Model 2 Model 3
Variables
Hazard Ratio Std.Error Sig. Hazard Ratio Std. Error Sig. Hazard Ratio Std. Error Sig. Migration
Non-Migrant (ref) 1.00 1.00 1.00
Before move - rural 0.37 0.18 * 0.37 0.18 * 0.36 0.18 * Before move - urban 1.10 0.42 1.14 0.44 0.92 0.36 Same time - rural 1.70 0.84 1.55 0.77 1.27 0.65 Same time - urban 2.11 1.12 2.10 1.12 1.56 0.84 After move - rural 0.55 0.25 0.48 0.23 0.48 0.23 After move - urban 0.83 0.37 0.73 0.34 0.71 0.33
Family Support Parent responsible, both
alive (ref) 1.00 1.00
Father responsible, mother
dead 0.57 0.60 0.49 0.52
Mother responsible, father
dead 1.96 0.76 1.95 0.77
Relative responsible, not double orphan 1.69 0.60 1.64 0.60 Relative responsible,
double orphan 1.31 0.64 1.20 0.60
Non-relative or self
responsible 0.70 0.31 0.63 0.28
Partner responsible 1.58 0.63 1.97 1.22
Transitions Schooling
Dropped out of school (ref) 1.00
Finished secondary school 2.04 0.70 *
In-school, behind 0.50 0.20
In-school, on-track 0.62 0.25
Ever Married 0.89 0.60
Ever Been Pregnant 0.50 0.19
Socio-Demographic Characteristics Ethnicity
Luo (ref) 1.00 1.00 1.00
Luhya 1.31 0.39 1.38 0.42 1.37 0.43
Other 0.71 0.34 0.74 0.35 0.82 0.39
Religion
Catholic (ref) 1.00 1.00 1.00
Protestant 0.42 0.14 ** 0.41 0.14 ** 0.42 0.14 * Pentecostal 0.91 0.28 0.81 0.26 0.80 0.25 African/Traditional 0.65 0.33 0.58 0.29 0.53 0.27 Muslim/Other/None 1.26 0.56 1.12 0.53 1.18 0.58
Piecewise Constant Hazard Rates
Table 4: (Continued)
Model 1 Model 2 Model 3
Variables
Wald Chi-squared 1830.70 *** 1797.40 *** 1726.04 *** Log Likelihood -154.94 -150.83 -140.91
Person-months 17,826 17,771 17,711
(N) 284 284 284
Note: * p<0.05, ** p<0.01, *** p<0.001. The number of person-months varies from Model 1 to Model 3 due to missing values for some variables.
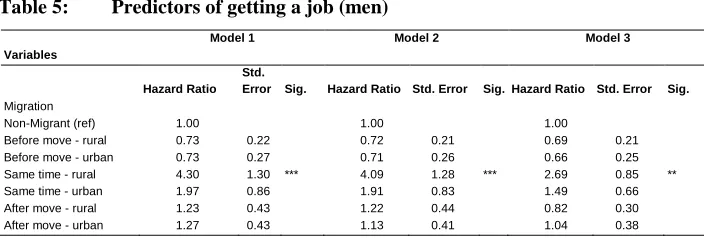
The associations between migration and work are quite different for young men. Model 1 of Table 5 shows that, before moving to Kisumu, migrants are slightly, but not significantly, less likely to get a job than non-migrants. However, at the time of their move, male migrants are much more likely to enter their first job (HR: 4.3), suggesting that gainful employment is an important motive for male adolescent migration. This apparent “migrant advantage,” nonetheless, wears off quickly. Four months after moving to Kisumu, young men from either urban or rural areas are no longer more likely to become employed compared to young men from Kisumu. Importantly, however, they are not less likely to become employed either. We find no effects of variation in family support on young men’s employment (Model 2) although there is a strong correlation between male adolescents’ educational status and employment (Model 3). Unlike for adolescent women, however, the important distinction is between men who are in school and those who are out of school rather than between those who have and those who have not completed secondary school. Furthermore, after adjusting for educational status (Model 3), the hazard rate at the time of migration falls from 4.1 to 2.7, suggesting that the higher rates of employment experienced by recent migrants is partially attributable to differences in the educational achievement of migrants and non-migrants.
Table 5: Predictors of getting a job (men)
Model 1 Model 2 Model 3
Variables
Hazard Ratio Std.
Error Sig. Hazard Ratio Std. Error Sig. Hazard Ratio Std. Error Sig. Migration
Non-Migrant (ref) 1.00 1.00 1.00
Table 5: (Continued)
Model 1 Model 2 Model 3
Variables
Family Support
Parent responsible, both
alive (ref)
1.00 1.00
Father responsible, mother dead
1.10 0.58 0.86 0.46 Mother responsible,
father dead
1.23 0.37 1.08 0.33 Relative responsible, not double orphan
1.24 0.35 0.91 0.26 Relative responsible, double orphan
0.93 0.35 0.73 0.28 Non-relative or self
responsible
1.13 0.29 0.91 0.25
Transitions
Schooling
Dropped out of school
(ref) 1.00 Finished secondary school
1.01 0.31 In-school, behind
0.28 0.07 *** In-school, on-track
0.16 0.05 *** Ever Married
0.35 0.37 Partner Ever Pregnant
1.78 0.64
Socio-Demographic Characteristics Ethnicity Luo (ref) 1.00
1.00 1.00
Luhya 1.00 0.32 1.02 0.34 1.10 0.37
Other 1.49 0.40 1.51 0.41 1.68 0.47
Religion
Catholic (ref) 1.00
1.00 1.00
Protestant 0.71 0.17 0.71 0.17 0.82 0.20 Pentecostal 0.91 0.27 0.89 0.27 0.84 0.26 African/Traditional 1.10 0.40 1.07 0.39 0.88 0.33 Muslim/Other/None 1.01 0.37 0.96 0.35 0.87 0.33
Piecewise Constant
Hazard Rates
Age 14 to 15 0.002 0.001 *** 0.002 0.001 *** 0.008 0.004 *** Age 15 to 18 0.006 0.001 *** 0.005 0.001 *** 0.019 0.006 *** Age 18 to 19 0.011 0.003 *** 0.011 0.003 *** 0.028 0.010 *** Age 19 to 20 0.014 0.004 *** 0.013 0.004 *** 0.028 0.010 ***
Wald Chi-squared 2711.73 *** 2693.68 *** 2497.38 *** Log Likelihood -242.98
-241.95 -215.54
Person-months 17,983
17,912 17,863
(N) 312
311 311
3.5 Pregnancy
Table 6 explores the factors affecting the likelihood of first pregnancy among young women. Model 1 shows that the risk of pregnancy for migrants before moving to Kisumu is no different than the risk for non-migrants. However, rural female migrants are significantly more likely to get pregnant both when they move and after they move to Kisumu. These associations between migration and pregnancy almost entirely disappear, however, once we control for changes in family support (Model 2), since young migrant women are more likely to be supported by a partner or spouse, which in turn is highly correlated with becoming pregnant. These results are reinforced in Model 3, which shows a very strong association between marital status and pregnancy risks. Thus, although pregnancy often occurs before marriage (Figure 1), the earlier timing of first pregnancy among migrants can largely be attributed to their earlier transitions into marriage. Lastly, we find that even accounting for differences in marital status and support from partners, young women who are in school-- and especially those who are on-track in school-- are less likely than those who are out of school to become pregnant.
Table 6: Predictors of getting pregnant (women)
Model 1 Model 2 Model 3
Variables
Hazard Ratio Std. Error Sig. Hazard Ratio Std. Error Sig. Hazard Ratio Std. Error Sig. Migration
Non-Migrant (ref) 1.00 1.00 1.00
Before move - rural 0.89 0.25 0.97 0.28 0.63 0.19 Before move - urban 0.90 0.30 0.89 0.31 0.69 0.24 Same time - rural 2.58 0.96 * 1.31 0.51 0.64 0.26 Same time - urban 0.77 0.56 0.59 0.43 0.42 0.31 After move - rural 2.76 0.79 *** 1.41 0.45 0.70 0.23 After move - urban 1.92 0.65 1.17 0.43 0.88 0.34
Family Support Parent responsible, both
alive (ref) 1.00 1.00
Father responsible, mother
dead 2.49 1.39 2.59 1.45
Mother responsible, father
dead 0.55 0.23 0.52 0.22
Relative responsible, not double orphan 1.15 0.36 0.94 0.30 Relative responsible, double orphan 1.36 0.52 0.98 0.38 Non-relative or self
responsible 1.11 0.34 0.96 0.29
Partner responsible 10.78 3.14 *** 0.48 0.26
Transitions Schooling
Dropped out of school (ref) 1.00
Table 6: (Continued)
Model 1 Model 2 Model 3
Variables
In-school, behind 0.48 0.13 **
In-school, on-track 0.18 0.06 ***
Ever Married 2.24 0.32 ***
Ever Had a job 0.80 0.31
Socio-Demographic Characteristics Ethnicity
Luo (ref) 1.00 1.00 1.00
Luhya 1.12 0.27 0.84 0.21 1.00 0.26
Other 0.69 0.27 0.67 0.27 0.61 0.28
Religion
Catholic (ref) 1.00 1.00 1.00
Protestant 0.62 0.16 0.62 0.16 0.61 0.16 Pentecostal 1.16 0.30 1.01 0.28 0.94 0.26 African/Traditional 1.20 0.38 1.21 0.40 0.90 0.30 Muslim/Other/None 1.39 0.60 0.72 0.33 0.34 0.16 *
Piecewise Constant Hazard Rates
Age 14 to 14.5 0.001 0.001 *** 0.001 0.001 *** 0.004 0.003 *** Age 14.5 to 15 0.007 0.003 *** 0.007 0.003 *** 0.023 0.010 *** Age 15 to 17.5 0.007 0.002 *** 0.007 0.002 *** 0.018 0.006 *** Age 17.5 to 20 0.009 0.002 *** 0.009 0.003 *** 0.017 0.006 ***
Wald Chi-squared 2608.97 *** 2378.65 *** 2129.92 *** Log Likelihood -252.11 -212.34 -176.13
Person-months 15,378 15,323 15,323
(N) 278 278 278
Note: * p<0.05, ** p<0.01, *** p<0.001. The number of person-months varies from Model 1 to Model 3 due to missing values for some variables.
Table 7: Predictors of getting a partner pregnant (men)
Model 1 Model 2 Model 3
Variables
Hazard Ratio Std. Error Sig. Hazard Ratio Std. Error Sig. Hazard Ratio Std. Error Sig. Migration
Non-Migrant (ref) 1.00 1.00 1.00
Before move - rural 1.14 0.49 1.13 0.49 1.42 0.64 Before move - urban 1.28 0.66 1.36 0.70 2.28 1.25 Same time - rural 0.91 0.93 0.91 0.94 0.68 0.71 Same time - urban 1.16 1.20 1.23 1.27 1.43 1.52 After move - rural 2.83 1.25 * 2.68 1.21 * 1.35 0.66 After move - urban 2.80 1.36 * 2.97 1.47 * 2.91 1.56 *
Family Support Parent responsible, both
alive (ref) 1.00 1.00
Father responsible, mother
dead 1.03 1.08 1.14 1.20
Mother responsible, father
dead 1.53 0.70 1.29 0.59
Relative responsible, not double orphan 1.02 0.52 0.46 0.26 Relative responsible, double orphan 1.87 0.94 1.16 0.61 Non-relative or self
responsible 1.51 0.61 0.71 0.33
Transitions Schooling
Dropped out of school (ref) 1.00
Finished secondary school 0.26 0.20
In-school, behind 0.32 0.13 **
In-school, on-track 0.16 0.09 ***
Ever Married 2.26 0.32 ***
Ever Had a job 1.45 0.60
Socio-Demographic Characteristics Ethnicity
Luo (ref) 1.00 1.00 1.00
Luhya 0.99 0.49 1.04 0.52 0.87 0.43
Other 0.66 0.36 0.70 0.39 0.49 0.27
Religion
Catholic (ref) 1.00 1.00 1.00
Protestant 0.56 0.20 0.58 0.21 1.07 0.43 Pentecostal 0.56 0.27 0.58 0.29 1.07 0.56 African/Traditional 1.09 0.54 1.15 0.57 0.77 0.40 Muslim/Other/None 0.62 0.41 0.64 0.43 0.81 0.53
Piecewise Constant Hazard Rates
Table 7: (Continued)
Model 1 Model 2 Model 3
Variables
Wald Chi-squared 1644.92 *** 1629.80 *** 1407.58 *** Log Likelihood -156.21 -154.69 -127.64
Person-months 20,327 20,255 20,255
(N) 322 321 321
Note: * p<0.05, ** p<0.01, *** p<0.001. The number of observations (N) and person-months vary from Model 1 to Model 3 due to missing values for some variables.
3.6 Marriage
Table 8: Predictors of getting married (women)
Model 1 Model 2 Model 3
Variables
Hazard Ratio Std. Error Sig. Hazard Ratio Std. Error Sig. Hazard Ratio Std. Error Sig. Migration
Non-Migrant (ref) 1.00 1.00 1.00
Before move - rural 1.15 0.46 1.25 0.50 0.89 0.36 Before move - urban 0.42 0.31 0.37 0.28 0.33 0.25 Same time - rural 15.73 4.92 *** 12.90 4.14 *** 6.00 1.99 *** Same time - urban 3.73 2.05 * 3.19 1.78 * 2.53 1.45 After move - rural 2.59 1.14 * 1.94 0.88 1.00 0.45 After move - urban 3.83 1.53 *** 3.35 1.40 ** 3.59 1.51 **
Family Support Parent responsible, both
alive (ref) 1.00 1.00
Father responsible, mother
dead 2.77 1.81 2.53 1.63
Mother responsible, father
dead 0.61 0.31 0.55 0.28
Relative responsible, not double orphan 1.51 0.51 1.17 0.40 Relative responsible, double orphan 1.54 0.66 0.92 0.38 Non-relative or self
responsible 1.15 0.42 1.03 0.38
Partner responsible 11.75 4.87 *** 5.94 2.52 ***
Transitions Schooling
Dropped out of school (ref) 1.00
Finished secondary school 0.50 0.21
In-school, behind 0.22 0.08 ***
In-school, on-track 0.02 0.02 ***
Ever Been Pregnant 2.33 0.59 ***
Ever Had a Job 0.80 0.44
Socio-Demographic Characteristics Ethnicity
Luo (ref) 1.00 1.00 1.00
Luhya 0.84 0.26 0.73 0.24 0.85 0.28
Other 0.98 0.43 1.14 0.51 1.16 0.53
Religion
Catholic (ref) 1.00 1.00 1.00
Protestant 0.72 0.24 0.71 0.24 0.90 0.31 Pentecostal 1.48 0.51 1.46 0.52 1.75 0.63 African/Traditional 1.58 0.61 1.80 0.71 1.67 0.65 Muslim/Other/None 3.40 1.56 ** 3.69 1.73 ** 2.26 1.08
Piecewise Constant Hazard Rates
Table 8: (Continued)
Model 1 Model 2 Model 3
Variables
Wald Chi-squared 1809.34 *** 1717.26 *** 1386.11 *** Log Likelihood -158.52 -142.39 -102.06
Person-months 16,962 16,907 16,907
(N) 284 284 284
Note: * p<0.05, ** p<0.01, *** p<0.001. The number of person-months varies from Model 1 to Model 3 due to missing values for some variables.
4. Data limitations
Modeling the migration process is notoriously difficult and virtually all study designs face serious limitations. Our study is no exception. First, since our data were collected in Kisumu, all migrants eventually moved to Kisumu and were living there during the survey. As a consequence, we can compare the life histories of migrants before, during, and after their move to Kisumu to non-migrants living in Kisumu, but we cannot compare them to non-migrants still living in their place of origin. This limitation is particularly important to keep in mind as Kisumu may differ from other destination cities in Africa. Although Kisumu is the third-largest city in Kenya, its size is dwarfed by that of either Nairobi or Mombasa. Kisumu is also unique in its high number of elite secondary schools, colleges, and vocational training programs. Thus, our study may over-represent migration for educational purposes
Second, our study does not capture any migrants who moved to Kisumu after the age of 14 but who left before the survey. The omission of these migrants could bias our findings if, for example, migrants who could not find work, enroll in school, or get married are more likely to leave. Fortunately, although circular migration is very common in Kenya, “in-migration” (to larger urban centers) far exceeds “out-migration” in the age group of our sample (ages 18-24) (Beguy, Bocquier, and Zulu 2010; Collinson 2009).
and then by placing the timing of other key events relating to residential location, family support, schooling, work, and relationships in the context of each other (Elder, Johnson, and Crosnoe 2003). This process triggers respondents’ autobiographic memories and has been shown to significantly improve the quality of reporting (Belli and Callegaro 2009; Freedman et al. 1988; Goldman, Moreno, and Westoff 1989; Smith 2009). However, even though this instrument may improve the accuracy of reported dates and particularly the sequencing of important events, respondents may still inadvertently or deliberately misplace some of these events. This caveat is particularly applicable to young men’s reporting of pregnancies. Men may be unaware of a pregnancy or even deliberately fail to report a pregnancy if they do not wish to acknowledge paternity. Men are also less likely to be aware of the exact date that a pregnancy occurred, particularly if the pregnancy did not result in a live birth. Thus, while this study deliberately seeks to highlight men’s transitions into adulthood, which includes transitions into parenthood, our results pertain only to pregnancies that are known and reported by men.
Fourth, although this life history calendar includes many salient events and indicators, a few important ones were omitted. Most notably, we did not collect retrospective data on household economic status. Thus, while we use orphanhood status as a rough proxy for “crisis” fostering, we cannot account for crisis fostering which occurred as a result of economic hardship; nor can we explore poverty as an important causal mechanism linking migration to the timing of transitions to adulthood. Fortunately, however, we find that including measures of household wealth at the time of the survey does not significantly alter our major findings (see Appendices A and B). There are two potential explanations for this finding. First, household wealth may have little additional effect after controlling for both educational attainment and income. Second, relatively few individuals change between wealth quintiles over their life course. In addition, our calendar did not collect retrospective information on co-residence or living arrangements; rather, it used the more locally-relevant concept of “family support.” Although measures of family structure based entirely on co-residence are often criticized as failing to adequately capture care from non-residential family members, it would have been interesting to compare the effects of family support and co-residence.
5. Discussion
Despite these limitations, this study offers new insights and raises a few concerns about the relationship between migration and transitions to adulthood for young men and women living in sub-Saharan Africa. For many youths, migration is inseparable from their critical life transitions. For young women moving from rural areas, migration is often coterminous with dropping out of school, getting married, and becoming pregnant. For adolescent boys, migration is not only strongly associated with entering a first job, but also with dropping out of school.
Although one might regard some of these transitions, such as getting married or finding a job, as positive, it is important to recall that all of these transitions are occurring before the age of 20. Moreover, these results indicate that migrants, on average, tend to undergo these transitions at younger ages than non-migrants living in the destination city and often even compared to rural migrants who have not yet moved. Perhaps most concerning, however, are the exceptionally strong relationships we found between moving and dropping out of school for both boys and girls. Given that Kisumu offers more educational opportunities than most rural areas in Kenya, one might expect the opposite finding whereby migrants would be more likely to finish secondary school compared to rural residents. Instead, we find that migrants from rural areas, and often those from urban areas, frequently end their education when they move. The fact that this drop in school enrollment cannot be fully explained by a concurrent rise in employment, marriage, or parenthood is especially troubling. These results suggest that not only does moving to an urban area curtail educational prospects, but it also does not offer compensating new opportunities.
The trajectories of migrants after they have moved to Kisumu, however, are generally not significantly different from non-migrants with respect to schooling or employment. These results suggest that although many young men move to the city to immediately begin work, those who move for other purposes do not appear to be systematically advantaged or disadvantaged in the labor market. Interestingly, however, migration is associated with early rates of first pregnancy for both men and women. These differences in the timing of pregnancy become insignificant for women after taking into account different marriage rates, which is consistent with our findings that migrant women (from both urban and rural areas) are more likely to get married both in conjunction with migration and thereafter. In short, we find little evidence that migrant women adopt the marital or fertility norms of their new urban area. Moreover, migrant men from other urban areas continue to exhibit higher risks of having a pregnant partner than non-migrants, even after controlling for difference in marital status.
adulthood. At the time of the move, both young men and women experience a sharp decline in the support from their parents. Young women increase their reliance on a partner or spouse while young men depend more on themselves or a non-relative. However, these changes in family support and structures do not explain differences in the trajectories of migrants and non-migrants. Although in some instances—for example, girls’ schooling—family support has a direct effect, it only partially mediates the relationship between migration and educational outcomes.
Given the large numbers of young men and women moving to intermediate-sized cities throughout sub-Saharan Africa, our findings allow us to identify some of the challenges and opportunities that greet these young men and women when they arrive. For both men and women, migration is associated with a sharp decline in parental support and rapid and early transitions to adult roles and responsibilities. Moreover, the dramatic decline in school attendance is only partially accounted for by transitions into motherhood and marriage for women and into employment for men. How adolescent migrants who are not in school, not in a union, or not employed spend their time, and who is responsible for their care, may have important implications not only for the young migrants themselves, but also for the broader process of urbanization. Since many of these youths are likely to be socially isolated and educationally disadvantaged, finding ways to engage them and offer social support could have important long-term benefits.
6. Acknowledgements
References
Agesa, J. and Agesa, R. (1999). Gender differences in the incidence of rural to urban migration: Evidence from Kenya. Journal of Development Studies 35(6): 36–58.
doi:10.1080/00220389908422601.
Agesa, R. and Agesa, J. (2005). Sources of gender difference in rural to urban migration in Kenya: Does human capital matter? Applied Economics Letters 12(11): 705–709. doi:10.1080/13504850500188000.
Agwanda, A., Bocquier, P., Khasakhala, A., and Owuor, S. (2004). The effect of economic crisis on youth precariousness in Nairobi: An analysis of itinerary to adulthood of three generations of men and women. Unité de Recherche CIPRÉ, IRD (Working Paper DIAL).
Anglewicz, P. (2012). Migration, marital change, and HIV infection in Malawi. Demography 49(1): 239–265. doi:10.1007/s13524-011-0072-x.
Beauchemin, C. (2005). Pour une relecture des tendances migratoires entre villes et campagnes: Une etude comparee Burkina Faso - Cote d'Ivoire. African Population Studies 20(1): 141–165.
Beauchemin, C. and Bocquier, P. (2004). Migration and urbanisation in Francophone west Africa: An overview of the recent empirical evidence. Urban Studies 41(11): 2245–2272. doi:10.1080/0042098042000268447.
Beegle, K. and Krutikova, S. (2008). Adult mortality and children's transition into marriage. Demographic Research 19(42): 1551–1574. doi:10.4054/DemRes. 2008.19.42.
Beegle, K. and Poulin, M. (2011). Migration and the transition to adulthood in contemporary Malawi. Paper presented at the Population Association of America Annual Meeting 2011, Washington, D.C.
Beguy, D., Bocquier, P., and Zulu, E.M. (2010). Circular migration patterns and determinants in Nairobi slum settlements. Demographic Research 23(20): 549–586. doi:10.4054/DemRes.2010.23.20.
Billari, F. (2005). Life course analysis: Two (complementary) cultures? Some reflections with examples from the analysis of the transition to adulthood. In: Levy, R., Ghisletta, P., Le Goff, J.-M., Spini, D., and Widmer, E. (eds.). Towards an interdisciplinary perspective on the life course. Oxford: Elsevier: 261–282.
Birdthistle, I., Floyd, S., Nyagadza, A., Mudziwapasi, N., Gregson, S., and Glynn, J. (2009). Is education the link between orphanhood and HIV/HSV-2 risk among female adolescents in urban Zimbabwe? Social Science & Medicine 68(10): 1810–1818. doi:10.1016/j.socscimed.2009.02.035.
Blossfeld, H.-P., Golsch, K., and Rohwer, G. (2007). Event history analysis with Stata. London: Lawrence Erlbaum Associates, Publishers.
Brockerhoff, M. (1995). Fertility and family-planning in African cities: The impact of female migration. Journal of Biosocial Science 27(3): 347–358. doi:10.1017/
S0021932000022872.
Brockerhoff, M. and Biddlecom, A. (1999). Migration, sexual behavior and risk of HIV in Kenya. International Migration Review 33(4): 833–856. doi:10.2307/
2547354.
Brockerhoff, M. and Eu, H. (1993). Demographic and socioeconomic determinants of female rural to urban migration in sub-Saharan Africa. International Migration Review 27(3): 557–577. doi:10.2307/2547100.
Brockerhoff, M. and Yang, X. (1994). Impact of migration on fertility in sub-Saharan Africa. Social Biology 41(1–2): 19–43. doi:10.1080/19485565.1994.9988857. Calves, A. and Schoumaker, B. (2004). Deteriorating economic context and changing
patterns of youth employment in urban Burkina Faso: 1980-2000. World Development 32(8): 1341–1354. doi:10.1016/j.worlddev.2004.03.002.
Campbell, C., Handa, S., Moroni, M., Odongo, S., and Palermo, T. (2008). Assessing the ‘orphan effect’ in determining development outcomes for children in 11 Eastern and Southern African countries. Social Policy and Social Protection Cluster. Nairboi, Kenya. doi:10.1080/17450120903193907.
Case, A. and Ardington, C. (2006). The impact of parental death on school outcomes: Longitutinal evidence from South Africa. Demography 43(3): 401–420.
Collinson, M. (2009). Age-sex profiles of migration: Who is a migrant? In: Collinson, M., Adazu, K., White, M., and Findley, S. (eds.). Dynamics of Migration, Health, and Livelihoods: INDEPTH Network Perspectives. Burlington, VT: Ashgate: 49–62.
Collinson, M.A., Tollman, S.M., and Kahn, K. (2007). Migration, settlement change and health in post-apartheid South Africa: Triangulating health and demographic surveillance with national census data. Scandavian Journal of Public Health 35(69): 77–84. doi:10.1080/14034950701356401.
Elder, G.H., Johnson, M.K., and Crosnoe, R. (2003). The emergence and development of life course theory. In: Mortimer, J.T. and Shanahan, M.J. (eds.). Handbook of the life course. New York: Kluwer Academic/Plenum Publishers.
Erulkar, A., Mekbib, T.-A., Simie, N., and Gulema, T. (2006). Migration and vulnerability among adolescents in slum areas of Addis Ababa, Ethiopia. Journal of Youth Studies 9(3): 361–374. doi:10.1080/13676260600805697. Evans, D.K. and Miguel, E. (2007). Orphans and schooling in Africa: A longitudinal
analysis. Demography 44(1): 35–57. doi:10.1353/dem.2007.0002.
Ezra, M. and Kiros, G. (2001). Rural out-migration in the drought-prone areas of Ethiopia: A multilevel analysis. International Migration Review 35(3): 749–771.
doi:10.1111/j.1747-7379.2001.tb00039.x.
Ferede, A. and Erulkar, A. (2009). Adolescent girls in urban Ethiopia: Vulnerability and opportunity. New York, NY: Population Council.
Freedman, D., Thornton, A., Camburn, D., Alwin, D., and Young-DeMarco, L. (1988). The life history calendar: A technique for collecting retrospective data. Sociological Methodology 18: 37–68. doi:10.2307/271044.
Goldman, N., Moreno, L., and Westoff, C.F. (1989). Collection of survey data on contraception: An evaluation of an experiment in Peru. Studies in Family Planning 20(3): 147–157. doi:10.2307/1966569.
Goody, J. (1976). Production and reproduction: A comparative study of the domestic domain. Cambridge: Cambridge University Press.
Hertrich, V. and Lesclingand, M. (2012). Adolescent migration and the 1990s nuptiality transition in Mali. Population Studies 66(2): 147–166. doi:10.1080/
Hungi, N. and Thuku, F. (2010). Differences in pupil achievement in Kenya: Implications for policy and practice. International Journal of Educational Development 30(1): 33−43. doi:10.1016/j.ijedudev.2009.05.001.
International Labour Organization (2004). Child labour and the urban informal sector in Uganda. Geneva: International Labour Organization International Programme on the Elimination of Child Labour (IPEC).
Jacquemin, M. (2009). Petites nieces’ et ‘petites bonnes’ a Abidjan. Travails, genre et societes 22: 53–74.
Kabiru, C. and Ezeh, A. (2007). Factors associated with sexual abstinence among adolescents in four sub-Saharan African countries. African Journal of Reproductive Health 11(3): 111–132. doi:10.2307/25549735.
Kadonya, C., Madihi, M., and Mtwana, S. (2002). Tanzania Child Labour in the Informal Sector: A Rapid Assessment. Geneva: International Labour Organization International Programme on the Elimination of Child Labour (IPEC).
KNBS and ICF-Macro (2010). Kenya Demographic and Health Survey 2008-09. Calverton, Maryland: Kenya National Bureau of Statistics (KNBS) and ICF Macro.
Kulu, H. and Milewski, N. (2007). Family change and migration in the life course: An introduction. Demographic Research 17(19): 567–590. doi:10.4054/DemRes. 2007.17.19.
Kumi-Kyereme, A., Awusabo-Asare, K., Biddlecom, A., and Tanle, A. (2007). Influences of social connectedness, communication and monitoring on adolescent sexual activity in Ghana. African Journal of Reproductive Health 11(3): 133–149. doi:10.2307/25549736.
Le Jeune, G., Piché, V., and Poirier, J. (2005). L’émergence d’une migration féminine autonome du milieu rural vers le milieu urbain au Burkina Faso? African Population Studies 20(2): 101–123.
Lee, B. (1992). The influence of rural-urban migration on migrant's fertility behavior in Cameroon. International Migration Review 26(4): 1416–1447. doi:10.2307/
2546889.