in the population sciences published by the Max Planck Institute for Demographic Research Konrad-Zuse Str. 1, D-18057 Rostock · GERMANY www.demographic-research.org
DEMOGRAPHIC RESEARCH
VOLUME 19, ARTICLE 13, PAGES 361-402
PUBLISHED 01 JULY 2008
http://www.demographic-research.org/Volumes/Vol19/13/ DOI: 10.4054/DemRes.2008.19.13
Research Article
Bulgaria:
Ethnic differentials in rapidly declining fertility
Elena Koytcheva
Dimiter Philipov
This publication is part of Special Collection 7: Childbearing Trends and Policies in Europe (http://www.demographic-research.org/special/7/)
© 2008 Koytcheva & Philipov.
1 Introduction 362
2 Fertility and fertility-related demographic trends 363
2.1 Major fertility trends 363
2.1.1 Level of fertility 363
2.1.2 Non-marital fertility 366
2.1.3 Cohort fertility 367
2.1.4 Tempo and quantum of fertility 370
2.1.5 Ethnic dimension 373
2.2 Proximate determinants of fertility 373
2.2.1 First marriages 373
2.2.2 Entry into non-marital unions (cohabitation) 376
2.2.3 Divorces and separations 381
2.2.4 Abortions and contraception 382
2.2.5 Education 384
3 Explaining the changes: a discussion 389
3.1 Economic aspects 389
3.2 Ideational changes 391
4 Decreasing fertility, society, and policy 393
4.1 Public opinion on demographic matters 393
4.2 Low fertility and the government 394
5 Fertility: which way? 396
Bulgaria:
Ethnic differentials in rapidly declining fertility
Elena Koytcheva1
Dimiter Philipov2
Abstract
This chapter provides a detailed description of the fertility changes in Bulgaria during recent decades and discusses possible reasons and consequences. It also gives an overview of the steps that the government has undertaken to offset the considerable decline in fertility. Before the fall of communism, fertility trends in Bulgaria were stable and characterized by a nearly universal entry into parenthood, dominance of a two-child family model, an early start and early end of childbearing, stable mean ages at entry into childbearing and marriage, and low percentages of non-marital births. During the 1990s and in the first years of the new century, we observe a marked, rapid change in fertility behaviour. Together with the severe decline in overall fertility rates, demographic data reveal a significant postponement of entry into motherhood and marriage, a decline of the two-child family model, and an emergence of new family forms. Most research attributes these changes to the particular political and social situation in Bulgaria since 1989.
1
E-mail: [email protected]
1. Introduction
The political events of 1989 in the former socialist countries marked the start of huge transformations, two of which were the change from a centrally planned economy to a market economy, and the transition from an autocratic to a democratic society. The political and socio-economic reforms in each country started from different levels and developed at various rates. Essential differences still persist in the cultural and political structures of these countries, as well as in the stages of their economic development, especially regarding the role of the public sector and the quality of life (Holzer 1995). Bulgaria belongs to the group of these countries where the societal transition proceeded more slowly, faced more difficulties, and was more painful (Heikkilä and Kuivalainen 2003). The profound economic crises, political instability, anomie, and decline in social integration all resulted in a lower quality of life and in more disenchantment, aggression, and escapism (Genov 1998).
All these changes influenced demographic developments in Bulgaria. Before 1989, the demographic indicators of family and fertility behaviour in Bulgaria were rather stable. Philipov (2001) characterized the fertility behaviour of that era as one of “an early start and early end to childbearing, prevalence of the two-child family model, low extra-marital fertility.” Since 1986, the population of Bulgaria, which then numbered almost 9 million people, has diminished by almost one million and in the 2001 census was 7 932 984 (National Statistical Institute (NSI) 2001). The sharp decrease in the population is a combined result of a negative natural increase and high emigration. The population decline of about 500 000 people between 1986 and 1992 persons was due mainly to the massive emigration of ethnic Turks fleeing the former socialist regime; in 1989 alone, about 330 000 left the country. This outflow continued in subsequent years, but about a third of the emigrants later returned to Bulgaria. Kaltchev (2001) estimated that the population decrease during the period between the last two censuses in 1992 and 2001 can be split into a negative natural increase of about 337 000 and a decrease of 221 000 due to emigration. The natural increase of the population was negative for the first time in 1990 (-0.4 per thousand) and has stayed well below the zero level since then – in 2005 it was -5.4 per thousand (NSI 2005).
The purpose of our study is to describe in detail the on-going changes in fertility in Bulgaria and to facilitate comparative analyses with other European countries. In explaining the reasons for these changes we refer to the well-known theories of economic and ideational change. We also detail the recent changes in population policies and the actions taken by the government to improve the demographic situation in the country.
surveys. The main sources of our data are, thus, a 2% sample of the census conducted in March 2001,3 the first wave of the Social Capital Survey4 conducted in 2002, and the first wave of the Gender and Generation Survey (GGS) conducted in 2004.5
2. Fertility and fertility-related demographic trends
This section describes fertility and fertility-related demographic trends observed during the last two decades. The main question it asks is whether the trends specific to the transition period are over; if so, what is the nature of the new trends?
2.1 Major fertility trends
2.1.1 Level of fertility
One of the most important tendencies in the Bulgarian demographic situation is the serious drop in fertility: the total fertility rate (TFR) remained well below the reproductive level (2.1) for more than 10 years and in 1997 it reached 1.09, which is the lowest level ever observed in the country (Figure 1). Since 1995 Bulgaria has belonged to a group of countries identified as having extremely low fertility (lowest-low fertility) (Kohler, Billari, and Ortega 2002).
The drop in TFR is due to the drop in the number of children born, as well as the postponement of first birth: many young families are delaying childbearing as they wait for “better times” (Philipov and Kohler 2001).
3 For more information on the census data, see Kohler, Kaltchev and Dimova (2002).
4 The survey sample includes 10 009 participants aged 18 to 34 at the time of the survey. In our analyses we use only the data of the 4 775 female participants.
Figure 1: Total fertility rate and female mean age at first birth
0.0 0.5 1.0 1.5 2.0 2.5
1980 1982 1984 1986 1988 1990 1992 1994 1996 1998 2000 2002 20.0 21.0 22.0 23.0 24.0 25.0
TFR
mean age at first birth
Source: Council of Europe 2004.
Bulgaria is traditionally a country in which the birth of the first child occurred at a very early age compared to Western countries (Figure 1). For instance, for a very long period (at least from the 1950s), the average age of first birth for women remained at about 22.0. The tendency in the last 10 years has been a marked increase; by 2003 it had already reached the level of 24.3. As this age is still very low by international standards, we expect that the trend of postponing childbearing to higher ages will still continue for some time.
Figure 2: Age-specific fertility rates for the period 1990–2000
0.00 0.05 0.10 0.15 0.20 0.25
14 18 22 26 30 34 38 42 46 50 Age
1980 1990 1995 2000
Source: Author’s calculations.
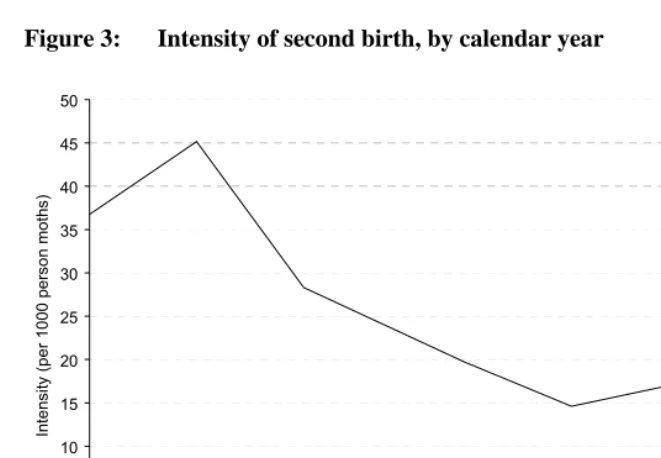
The decrease in fertility can be better seen when the decline in second birth is studied. Other research (Koytcheva 2006) shows that during the 1990s there was a breakdown of the long-persisting two-child family model. Figure 3 plots the intensities6 of second birth through the years, obtained in a hazard regression model with data from the Social Capital Survey 2002.
Figure 3: Intensity of second birth, by calendar year
0 5 10 15 20 25 30 35 40 45 50
1988 1990 1992 1994 1996 1998 2000 2002 Calendar year
In
ten
sit
y (
per
1
0
00
p
e
rs
on
m
oth
s)
Source: Koytcheva 2006:202.
The relatively high level of second birth intensities in the years before the start of the societal transition is followed by a persistent decline during the 1990s. Except for a small recovery during 1997–2000, the downward trend has continued through 2002. The decline in total fertility is mostly due to the decline in higher-order births, as universality of first births seems to persist (see the tempo-effect-adjusted first-order TFR (Figure 7); this disregards the effect of inflation that might have caused estimation bias during the period 1997–2000). More than 90% of women have a child before the end of their reproductive phase. Childlessness in Bulgaria is not as extensive as in some western European countries, and it is mostly involuntary. We discuss more on this issue in the subsection on cohort fertility following Figure 5.
2.1.2 Non-marital fertility
non-marital, but in 2003 this proportion had grown to 46%. A similar increase has been observed throughout the eastern European countries, but Bulgaria has one of the highest rates. Most of the other countries from the region report non-marital births around or below 30%, while only three countries – Estonia, East Germany and Bulgaria – reported around 50% in 2003 (Council of Europe, 2004). The increase in non-marital births is due to a variety of reasons, and proper delineation requires data that are not available. The rise in non-marital births is particularly high among the Roma (approximately 55% as indicated by the 2001 census).
The increase can be explained, first, by the spread of traditional de facto marriages that are not de jure marriages. Second, the data indicate that the absolute number of non-marital births is decreasing at a slower pace than marital births. A likely explanation is the prevalence of selectivity in non-marital births among population sub-groups (such as the Roma), among whom fertility does not decrease as fast as that of the overall population. Apparently this selectivity will result in a relative rise in the proportion of non-marital births (Di Giulio and Koytcheva 2007). Third, the rise of cohabitation and births within cohabitation is gaining importance.
The increase in non-marital births can be also partly due to the notable delay of marriage (Carlson 1982). Di Giulio and Koytcheva (2007) also point out that the sharp increase in the proportion of extramarital births seems to be more an artifact of the marked overall decrease in births and relatively stable number of non-marital births. Nevertheless, it is impossible to ignore the increase in the non-marital births in Bulgaria in recent years.
While in western Europe this model of family has been prevalent for decades (van de Kaa 2003), the model is still quite new for the countries of eastern Europe. In Section 2 of this paper we describe in more detail the changes in union formation in Bulgaria.
2.1.3 Cohort fertility
younger cohorts. The decrease of women with three or more children is observed already for the older cohorts and is very steep until the cohort born in 1935. Since then the proportion of women who have three or more children stays at about 10 to 15%. As already mentioned, really high proportions of childless women have never been observed in Bulgaria. The youngest cohorts in our data have the same proportion of childlessness as the oldest cohorts, namely around 10%. For the cohorts in between, childlessness has been even lower, about 4-5% while the lowest proportion of childless women is observed for cohort 1945 with 3.02. There may even be fewer than 10% childless women for cohorts 1960–1965 as they still have time to complete their reproductive phase.
Figure 4: Parity distribution of cohorts: Women born 1910-1965
0 10 20 30 40 50 60 70
1910 1915 1920 1925 1930 1935 1940 1945 1950 1955 1960 1965 2 children
1 child
3+ children
childless
Source: 2001 census, 2% sample, Author’s calculations.
Note: The parity of women is estimated at time point March 2001. For cohorts born after 1956 completed fertility refers to the age reached by March 2001.
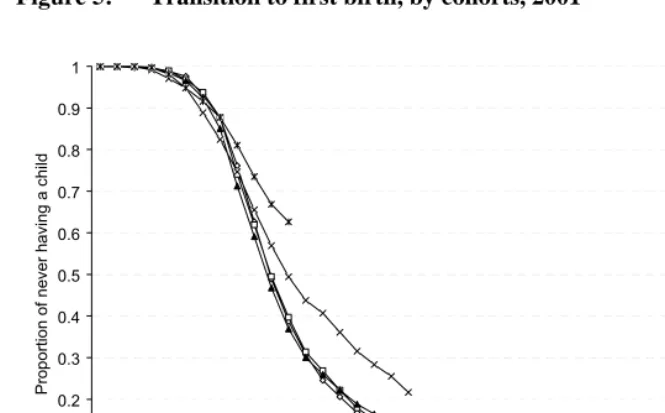
Figure 5: Transition to first birth, by cohorts, 2001 0 0.1 0.2 0.3 0.4 0.5 0.6 0.7 0.8 0.9 1
13 18 23 28 33 38 43 48 53 Age of Woman
Pr opor tion o f ne ver h a ving a child cohort 1 cohort 2 cohort 3 cohort 4 cohort 5
Source: Koytcheva 2006.
Note: Cohort 1 – women born 1951–1957; Cohort 2 – born 1958–1964; Cohort 3 – born 1965–1970; Cohort 4 – born 1971–1977; Cohort 5 – born 1978–1986.
In Figure 5 we present the survival curves of first birth for selected cohorts. There is hardly any difference to be observed between the first three cohorts. Women born between 1951 and 1970 have similar fertility behaviour – about 50% of the women in these cohorts had a child by the time they were 22; also, the proportion of childless women is very low – about 5% at age 40. Although cohorts 4 and 5 (the youngest two cohorts) are still too young for us to follow their fertility behaviour until the end of their reproductive phase, we can observe a clear delay in the first birth. Half of the women in cohort 4 (born 1971-1977) have a child by age 23 (one year later than earlier cohorts), while at the same age only about 36% of the women from cohort 5 (born 1978-1986) have given birth.
postponement of childbearing to later ages. We also cannot predict whether there will be a significant rise of the proportion of childless women from the younger cohorts. It is common to suppose that postponement of childbearing leads not only to lower ultimate fertility but also to higher childlessness. However, many factors interfere in the decision to stay childless and are specific to different societies, so such a straightforward conclusion cannot be made. We can only suggest one speculative argument: Suppose that when the proportion of childless women is below 10%, childlessness is involuntary, i.e. due to infertility or to the lack of partner. As far as Figure 5 indicates, it can be expected that the proportion of childless women by age 45 in the cohorts born during the 1970s and later will be above 10%, i.e. voluntary childlessness will have occurred among cohorts 4 and 5.
2.1.4 Tempo and quantum of fertility
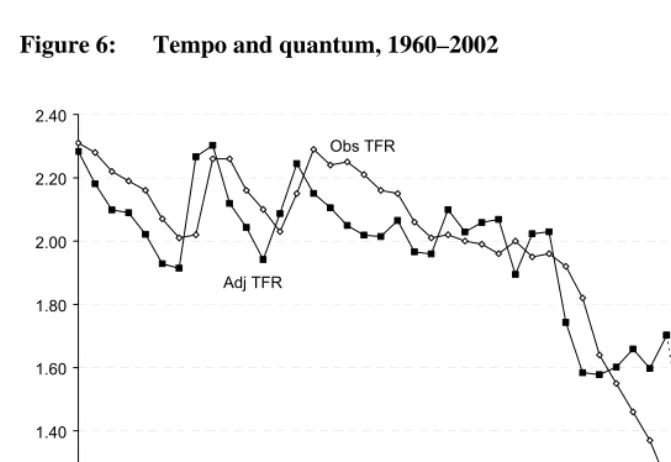
The significance of postponement of childbearing can be seen from Figures 6 and 7, which graph the period total fertility rate and the corresponding curve of adjusted rates (accounting for quantum effect).
The total fertility rate stayed around the replacement level over almost the whole observed period before the start of the societal transition. At the end of the 1980s there is a slight decrease, which becomes stronger at the beginning of the 1990s. The lowest level of TFR is observed in 1997 when the value is 1.09. Since 2002 there has been a slight but sure increase of the rate, reaching 1.38 in year 2006.
The observed and adjusted TFRs7 have similar values in the period of the socialist regime in Bulgaria. After the start of the transition, the adjusted TFR remains higher than the observed TFR, which shows that there is a significant postponement of childbearing. However, the adjusted TFR shows a large fluctuation in 1997 (we have plotted it with a dotted line), which indicates that the period quantum of fertility dropped sharply for about two years and then increased steeply for another two years. This change is more typical for fertility tempo, not for quantum. There was a hyperinflation in the economy at the end of 1997 and beginning of 1998. It is likely that this led to a drastic postponement. One of the assumptions under which the Bongaarts-Feeney formula is valid is that fertility changes should not be drastic; hence the formula is inapplicable for the hyperinflation period, and the corresponding estimates of the adjusted TFR shown in Figure 6 can be misleading. We would call for caution therefore in the interpretation of tempo and quantum in times of rapid fertility change.
Figure 6: Tempo and quantum, 1960–2002
1.00 1.20 1.40 1.60 1.80 2.00 2.20 2.40
1960 1965 1970 1975 1980 1985 1990 1995 2000 2005 Adj TFR
Obs TFR
Source: Author’s calculations.
Figure 7a: Tempo and quantum after 1988 for first birth
0.0 0.2 0.4 0.6 0.8 1.0 1.2
1988 1990 1992 1994 1996 1998 2000 2002 21.5 22.0 22.5 23.0 23.5 24.0 24.5
obs TFR adj TFR mean age
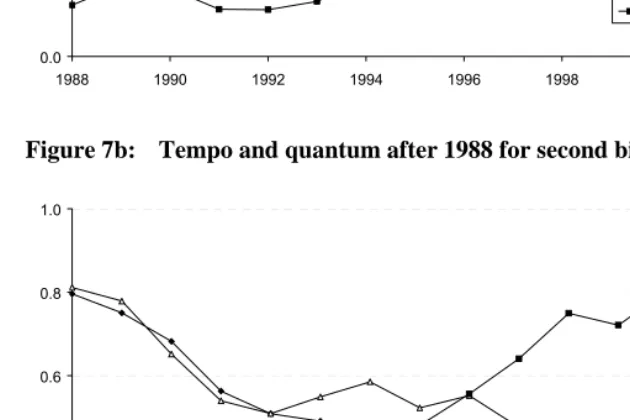
Figure 7b: Tempo and quantum after 1988 for second birth
0.0 0.2 0.4 0.6 0.8 1.0
1988 1990 1992 1994 1996 1998 2000 2002 24.0 24.6 25.2 25.8 26.4 27.0
obs TFR adj TFR mean age
2.1.5 Ethnic dimension
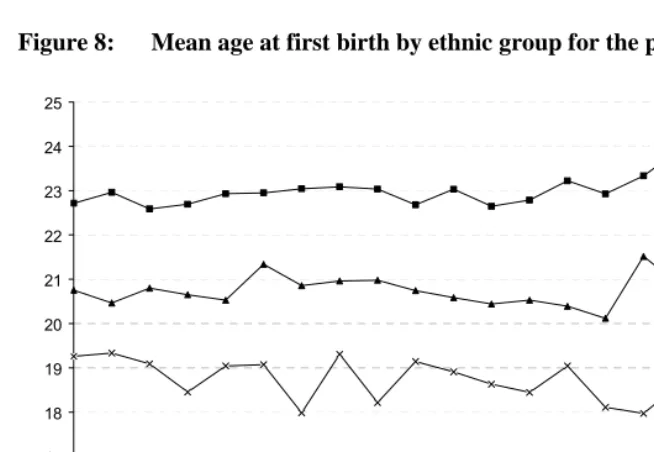
Fertility trends in Bulgaria differ substantially across ethnic groups. The three main ethnic groups in the country are Bulgarians (84%), Turks (9%), and Roma (5%), and the various smaller ethnic groups make up the remaining 2% (NSI 2001). Many studies have described the different fertility and family behaviours of the ethnic groups (e.g., Sougareva 1995, Pamporov 2005, Koytcheva 2006). In general, the Roma population is characterized by a high fertility level and an early start of reproduction, while the Bulgarian ethnic group has the lowest fertility level and longest postponement of entry into motherhood. The Turks stay somewhere in the middle. These differences between the ethnic groups remain also when one controls for important socio-economic factors such as level of education, place of residence, level of religiosity, and union status (Koytcheva 2006). The total fertility rate in year 2000 (according to 2001census data) was 1.1 for the Bulgarian ethnic group, 2.1–2.3 for the Turks, and around 3.0 for the Roma. Figure 8 presents the mean ages at first birth according to ethnic group and calendar year. There are substantial differences between the mean ages at the start of reproduction according to ethnic group. Roma often enter into motherhood as teenagers, while for the Turks the mean age at entry is between 20 and 21, and Bulgarians start childbearing above age 23 on average. Also, in the second half of the 1990s we observe a rise in the mean age at first birth that is especially evident for the Bulgarians and the Roma.
The differences in fertility trends by ethnic groups are closely connected to differences in family formation patterns. We give more information on this aspect in section 2.2.
2.2 Proximate determinants of fertility
2.2.1 First marriages
Figure 8: Mean age at first birth by ethnic group for the period 1980–2000
15 16 17 18 19 20 21 22 23 24 25
1980 1982 1984 1986 1988 1990 1992 1994 1996 1998 2000 Bulgarians Turks Romas
Source: Author’s calculations, 2% sample of 2001census.
Figure 9: Mean age at first marriage by gender and period
20 21 22 23 24 25 26 27 28 29 30
1980 1985 1990 1995 2000 2005 Year
Ag
e
female male
Source: NSI 2005.
In 2005 the mean age at first marriage for men was 29.1 and for women 25.8. The increase of the mean age seems to develop in parallel for both genders – we observe an increase of 4.4 years over the last 15 years for men as well as for women. After the continuous, relatively stable trend for several decades, this increase seems quite strong. However, when we compare the mean ages of marriage for many Western countries, they still appear very low in Bulgaria. Thus, it will not be surprising if the increase continues in coming years, as we do not find any signs of slowdown.
2.2.2 Entry into non-marital unions (cohabitation)
Together with the decline of marriages and the rise of mean age of marriage, we observe the emergence of a new form of union formation, namely cohabitation. This form of union is also closely connected to the strong increase of non-marital births, as described in Section 1.1. Recent data show that 13.1% of the population aged 15–59 live together without being married (Belcheva 2003). The increase in non-marital unions implies that the high percentage of non-marital births “is not necessarily synonymous with children being born outside a family union of some type” (Council of Europe 2001). According to the last census (conducted in March 2001), the proportion cohabiting at ages 15–29 was 17.6%, at ages 30-44 it was 12.1%, and at ages 45–59 it was 10.4%.
In Figure 10 we have plotted the transition intensities for the various types of unions. The results were obtained with a hazard regression model, separately for each transition event. The data came from the 2002 Social Capital Survey. The results show that there has been a marked decline of direct marriage formation and of marriage after cohabitation ever since the start of the 1990s. At the same time a rise in cohabitation is observed, though this becomes really pronounced only after the mid-1990s. These findings show that the change in union formation patterns has occurred over a span of some years; it was not an immediate reaction after the start of the political transition. The change in union formation pattern seems to be a slower process than the change in fertility pattern, for instance. Given this background, we expect that there will be a further rise in cohabitation in Bulgaria.
Figure 10: Intensities of direct marriage formation, first cohabitation, and transformation of cohabitation to marriage, by period
0.0 0.1 0.2 0.3 0.4 0.5 0.6
1985 1990 1995 1997 2000 2002 Year
In
ten
sit
ie
s
direct marriage First cohabitation Marriage after cohabitation
Source: Koytcheva 2006.
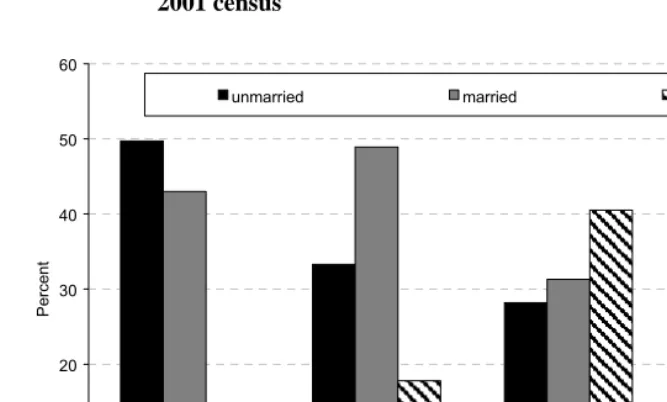
Figure 11: Distribution of women (aged 18–34) by union status and ethnic group,
2001 census
0 10 20 30 40 50 60
Bulgarian Turk Roma Total
Pe
rce
n
t
unmarried married cohabiting
Figure 12: Distribution of women from the Bulgarian ethnic group (aged 18–34) by union status and level of education
0 10 20 30 40 50 60 70
Lower Secondary Higher Total
Pe
rcen
t
unmarried married cohabiting
The differences in cohabitation according to region (the capital, Sofia, versus the rest of the country) for women from the Bulgarian ethnic group is not so high (see Figure 13). In both regions cohabitation appears to be less than 10%. There are, however, differences in marital status. About 60% of the young Bulgarian women living in the capital are unmarried at ages 18–34, and fewer than 30% are married. This is a much more skewed distribution than in the rest of the country. So, in the case of Bulgaria, postponement of marriages is highest in the capital of the country.
Figure 13: Distribution of women from the Bulgarian ethnic group (aged 18–34) by type of union and region
0 10 20 30 40 50 60 70
Sofia Rest of BG Total
Pe
rcen
t
unmarried married cohabiting
2.2.3 Divorces and separations
In the curve for the total divorce rate8 (Figure 14) we can observe peaks and troughs, but as a whole the rate stays in the range 0.15–0.20 (with few exceptions) for a considerable period. We observe a rather steep increase twice – between years 1993 and 1995 and after 2002. However, compared to other European countries, the divorce rate in Bulgaria is relatively low. According to Zhekova (2000), this trend is due to “still preserved old traditional norms and values regarding marriage and family”. In addition, a trend can be observed in the increase in divorces from first marriages whilst at the same time there is a decrease in the divorces during the first ten years of marriage (Council of Europe 2001).
Figure 14: Total divorce rate for the period 1980–1999
0.00 0.05 0.10 0.15 0.20 0.25 0.30
1980 1982 1984 1986 1988 1990 1992 1994 1996 1998 2000 2002 Year
Tot
a
l di
vo
rc
e ra
te
Source: Council of Europe 2003.
2.2.4 Abortions and contraception
A prominent characteristic of Bulgarian fertility is also the high number of legal abortions; for a long time Bulgaria was among the countries with the highest abortion rates in the world, even though under-registration of abortions is significant (Carlson and Tzvetarsky 2000). However, in the most recent decade the number of abortions has decreased somewhat (Figure 15). Since year 2000, for the first time in several decades, abortions do not outnumber live births. Nevertheless, the number of abortions is still very high.
Figure 15: Number of live births and legal abortions for the period 1980–2002
0 20000 40000 60000 80000 100000 120000 140000 160000 180000
1980 1982 1984 1986 1988 1990 1992 1994 1996 1998 2000 2002 Year
Nu
mb
er
Live births, total Legal abortions, total
Source: Council of Europe 2003
Figure 16: Total abortion rate and total fertility rate
0.0 0.5 1.0 1.5 2.0 2.5 3.0
1990 1995 2000 Year
Total abortion rate
Total fertility rate
Source: Data for total abortion rate: Kotzeva and Kostova (forthcoming). Data for total fertility rate: Council of Europe 2003.
The abortion rate9 (NSI 2003) also shows a significant drop. The value of the rate in 1990 was 69.7, while in 2002 it had declined to a level of 26.7. For a very long time abortion was one of the most common means of control for birth and family size, but the use of modern contraceptives is gaining strength, and this trend results in the lower number of abortions. Carlson and Lamb (2001) describe these changes in more detail: according to them, a drop in the number of abortions can only be observed in the younger generations living in larger towns. The number of abortions remains high in small towns and villages.
Parallel with the drop in abortion rates there is a rise in the use of contraceptive methods. However, more women still use more traditional means of contraception (Table 1). The three most used contraceptive methods are withdrawal, condom, and intra-uterine devices. Condom is used more by younger women and withdrawal by older women. The use of intra-uterine devices is almost as common as the use of the pill and it is mostly popular among women aged 30 to 40 years. From the FFS data we
9
cannot discern much difference with regard to the age of women in the use of the pill. The GGS data reveal that the pill is used more by younger women. In any case, the overall use of the pill is very low in Bulgaria compared to the Western societies.
Table 1: Usage of contraceptive methods by age (in percent)
Method 20-24 25-29 30-34 35-39 40-44 Total
1997 2004 1997 2004 1997 2004 1997 2004 1997 2004 1997 2004
Pill 16.8 17.8 22.0 12.6 7.6 13.8 16.9 10.2 23.3 8.2 16.9 11.3 IUD 10.1 5.8 8.1 11.6 27.4 17.0 18.9 19.6 16.6 18.2 16.7 15.6 Diaphragm 1.7 0.0 2.1 0.0 4.9 0.0 0.0 0.0 2.8 0.0 1.9 0.0 Condom 30.0 44.9 27.1 33.1 25.9 31.1 28.3 27.1 19.4 18.4 26.3 29.2 Abstinence 13.4 2.7 9.5 6.2 2.7 4.8 5.7 4.8 2.8 8.0 6.0 5.5 Withdrawal 24.9 28.0 31.2 36.3 31.5 32.9 29.5 37.3 34.3 46.1 30.9 37.6 Other methods 3.1 0.9 0.0 0.2 0.0 0.5 0.7 1.0 0.8 1.0 1.3 0.8
Source: For year 1997: Philipov 2001 (FFS 1997). For year 2004: GGS 2004, author’s calculations.
Note: In the GGS questionnaire, the respondents can give more than one answer to the question of which contraceptive means they use. To make the data comparable with the FFS, we chose the strongest method, in case the respondent is using several contraceptive methods.
There have been no substantial changes in contraceptive use in Bulgaria in recent years. When we compare the data from the Fertility and Family Survey (FFS 1997) with the Gender and Generation Survey (2004), we do not find any profound changes in the contraceptive methods that women use in different age groups.
2.2.5 Education
Figure 17: Baseline intensities for first birth according to age of woman, for women with higher education and women with secondary or primary education
0.00 0.05 0.10 0.15 0.20 0.25
18 19 22 25 28 31 43 Age of Woman
In
ten
sit
y
secondary or primary
higher education
Source: Koytcheva 2006.
Figure 18: Mean age at first birth by calendar year and education level of Mothers
17 19 21 23 25 27 29
1970 1975 1980 1985 1990 1995 Year
Age
High Secondary Primary
Source: 2001 census 2% sample; Author’s calculations.
A rise of the mean age at first birth is observed for university- and secondary-school educated women only (Figure 18). The increase is highest for highly educated women – a rise of almost three years over the last decade, while for secondary educated women the increase is one year for the same period. For women with primary education we observe a gradual decline.
Figure 19: Average length of interval between first and second birth by calendar year and level of education of mothers
2.0 2.5 3.0 3.5 4.0 4.5 5.0 5.5 6.0
1970 1972 1974 1976 1978 1980 1982 1984 1986 1988 1990 1992 1994 Calendar year
Ti
m
e
(i
n
yea
rs)
High Secondary Primary
Source: 2001 census, 2% sample; Author’s calculations.
Table 2: Relative risk of second birth. Effect of education level and relative age at first birth. Secondary education level and “below average” age at first birth as a reference group, 2001 census data.
Age at first birth
Education level Below average Above average
Relative risk Relative risk
Primary 1.88 *** 1.13
Secondary 1 0.74 ***
Higher 0.84 * 0.72 ***
Source: Koytcheva 2006.
Notes: ***: p ≤ 0.01 ***: 0.01<p≤0.05*: 0.05<p≤0.10. Source: Koytcheva 2006.
Neither educational group has an elevated risk of second birth if the first birth occurred relatively later than average. Conversely, the risk of conceiving for a second time is lower if the first birth happened later than the average; and this is true for each education level. So, in the Bulgarian case, we do not find signs of the time squeeze effect. Women who start childbearing late in their lives, relative to their educational level, tend to have lower second-birth risks.
3. Explaining the changes: a discussion
3.1 Economic aspects
Demographers search for explanations of fertility developments in two main directions. The first one refers to the economic change that has taken place both at the macro and at the micro level. Its effect on the decrease of fertility follows diverse paths. A significant rise in the direct costs of children is an insuperable obstacle for many people who experience impoverishment or just a drop in income. For others the opportunity costs of childrearing are overwhelming.
The political and economic changes in Bulgaria after the fall of communism were accompanied by economic crises, high inflation, and devaluation of individual income. For instance, in 1996/97 the country was struck by unprecedented inflation that reached more than 1000%. In the middle of 1997 the government concluded an agreement with the International Monetary Fund and put the economy under the operation of a currency board, which still continues to operate. This contributed to the financial and economic stabilization of the country, but did not lead to a substantial improvement in the standard of living of the population.
Unemployment was an unknown problem in Bulgaria in the times before the political and economic changes. The loss of working places for the economically active population meant not only a loss of income but also the impossibility of professional realization and development. In recent years unemployment has remained at about the level of 16%; the highest level (18.5%) was reached in March 2000. Unemployment in the 1990s has always been highest in the younger age groups, where it is twice as high as average (Beleva and Tsanov 2001). Nevertheless, there has also been a slight decrease in this percentage, and according to the same authors this is not the result of a higher number of jobs, but rather due to young people withdrawing from the labour market and entering the shadow economy or staying longer in the educational system.
and women in times of societal change (not shown here). In the young age groups higher numbers of men are unemployed, but the difference between genders in the last years is disappearing.
The contribution of women’s unemployment to the fertility decision in Bulgaria has been discussed by Philipov et al. (2006). According to the authors, women’s unemployment could have diverse effects. On the one hand, an unemployed woman could opt for childbearing since she stays at home anyway – this could be the case in families where the husband’s income is sufficient for the household. On the other hand, an unemployed woman could prefer to go back to work in order to contribute to the household income or to pursue a professional career. The authors suggest that it is more likely that the effect of unemployment is in the second direction, as a woman’s income became necessary for the family budget in the period of difficult economic times in the 1990s.
Unemployment has its ethnic dimension too (Figure 20). Usually, the Roma population is the one that suffers most from a harsh economic situation. The unemployment rate in this group was never lower than 35% throughout the 1990s. The reason for this could be educational desegregation; the Roma population most often drops out from school and remains lower educated. The group of Turks also has a considerable level of unemployment. In the case of this ethnic group, the reason could be the regional settlement patterns of the people; they live mostly in rural and mountain areas, which were very severely struck by unemployment from the very beginning of the 1990s.
Figure 20: Unemployment rate by ethnic groups
Source: UNDP 1997, Koytcheva 2006
3.2 Ideational changes
The second direction in a search for explanations of the fertility decline is the effect of ideational change. The idea of changes in the value system of a society and the impact of those changes on fertility behaviour is most often associated with the notion of a Second Demographic Transition, a notion which was introduced for the first time by Lesthaeghe and van de Kaa (1986). Their theory is based on observed tendencies in Western countries. It is still unresolved whether this theory also applies to the transition countries of Eastern Europe and to the Bulgarian case in particular. There is a debate on modernization and individualization of Bulgarian society in the public media as well as in scientific research, but a definite answer is yet to be found.
However, there are differences in the way new ideas penetrate the lifestyle of a society, especially when we regard the changes in the 1960s in the Western countries and in the 1990s in the Eastern countries. Koytcheva (2006) argues that Bulgarian society can be described as having strong secularization with little individualization from 1950 until 1990, due to the effects of the socialist regime. After 1990, there are
0 5 10 15 20 25 30 35 40 45 50
1992 Census 1994 survey 2001 Census
tendencies toward ideological pluralization (including de-secularization) and individualization. Some parts of society, particularly the younger cohorts, are strongly oriented toward Western experiences and Western lifestyles (and many work or study abroad). On the other hand, Bulgarian society has experienced tremendous societal, economic, and political transformation at one and the same time. It is generally considered that the overall transition to a democratic society would imply a transition of values and norms towards those characteristics typical of such a society.
Nevertheless, it is likely that before the establishment of new values there could be a period of normlessness, or anomie (Philipov et al. 2006, Genov 1998). This is a period of extreme uncertainty, lack of guidance from norms, and when many people are likely to be unable to make rational decisions about their own life. Empirical support for this view is available in a comparative study of Bulgaria and Hungary, based on demographic surveys in the two countries (Philipov et al. 2006). Their results show that anomie, social capital, and economic factors play a higher role in the decision to have a first or second child in Bulgaria than in Hungary. In Hungary there is evidence that the decision to have a child or a second child is highly driven by ideational factors. Koytcheva (2006) finds that during the 1990s the changes in fertility in Bulgaria were influenced to a higher degree by economic factors than by changes in values and ideas.
The limited research on the influence of social capital on intra-family relationships and its impact on fertility show that in Bulgaria the division of labour in the household is rather traditional. Baytchinska and Garvanova (2005) analyze gender differences in the value system in Bulgaria and find that value differences between men and women match traditional social-gender roles, with an instrumental/autonomous orientation of men and an expressive/communicative orientation of women. Nikolova (2005) also has carried a study about domestic labour and the division between genders. She finds out that the difference in time allotted by men and women for domestic work grows progressively. Women in Bulgaria invest more time in household work recently than in the past and men invest less. Of the invested time at household work for men, about 67% is devoted to the care of children, while women invest about double time in care of children but this is only 43% of their total household work time. An interesting result of the investigation is that the higher the education of the parents is, the more time men invest in the care for children. Also men in households in large towns or the capital help more in the household work than men in villages and small towns do.
Furthermore, the help for children is relatively frequent – more than 70 % of the help comes on a weekly basis. Philipov et al. (2006) also find out that in the case of Bulgaria, the higher the help that parents receive from their social network, the higher the intentions of having a child (or another child). Similar results were obtained by Bühler and Philipov (2005). Their research shows that the processes of interpersonal exchange in Bulgaria are relevant to the reproductive decisions when they provide access to resources that help to reduce the costs of having children and to stabilize the economic situation of the household.
4. Decreasing fertility, society, and policy
4.1 Public opinion on demographic matters
Mass media in Bulgaria frequently report about demographic change in the country, about policy measures that the government discusses and makes, and about the results of scientific investigations. Unfortunately, there is a tendency to report “sensational” news and to look for more spectacular conclusions. This provides space for reporting speculations. Titles like “Demographic collapse presses the economy” (Dnevnik, March 2004), “Today we are in demographic crisis, a demographic catastrophe looms” (Uchitelsko Delo, March 2004), or “We have three years to stop the demographic collapse” (Business Post, May 2004) were normal in the Bulgarian newspapers during recent years. In this respect, Bulgaria is not much different from other countries.
The high percentage of pre-marital births is mostly viewed as having a very negative consequence on the quality of the children (Standart, March 2004). Also, there is a belief that if a couple living together and having children is not married, this is due to problems with their parents, or one of the partners has had a previous marriage without divorce and thus is not able to marry, or that there are very serious problems with the feelings that partners have for each other (Dnevnik, February 2005). As a whole, living together without being married but having children is viewed as deviant behaviour of some groups of the young population.
4.2 Low fertility and the government
Together with the economic change in the country, there is also a development in political aspects, in particular in family policies.10 Until 1989, the policy of the government was explicitly pro-natalist, with a main goal to maintain a moderate population growth. This started at the end of the 1960s, at which time the net reproduction rate was below 1.0. At the beginning of the 1970s, pro-natalist policy instruments were aggressively introduced and included a “bachelor” tax and a ban on abortions. With time the policy was relaxed and incentives like maternal leave and child allowances were accentuated. A decree on birth incentives was introduced in the beginning of the 1970s; it was in place until 2002, although its contents changed considerably through time. In this section we cite further policy instruments that have been active for a long time. Numerous amendments made throughout the last three decades are beyond the scope of this chapter.
The birth incentive was oriented mostly to second and third children. For example, the child allowance increased until the third child, and for the fourth and each subsequent child it was equal to that of the first. Women were entitled to maternity leave of 135 days, 45 of which could be taken before the birth. In addition, mothers had the right to use a paid vacation for two years for the care of the child; this could alternatively be taken by the father or by one of the grandparents. On request, the woman or the person who took care of the child could take one additional year of unpaid vacation until the child was three years old. The time spent in paid and unpaid vacation was considered to be work practice; it contributed to the mother’s pension. Additionally, the mother had the right to return to her original workplace.
The policies on maternity leave in Bulgaria are very liberal regarding the persons who have the right to take such a leave. According to Kovacheva and Pancheva (2003),
10
Bulgaria is among the few countries where parental leave could and still can be taken by the grandparent generation – not only by the mother or the father.
In the years before 1990 kindergartens and crèches were widespread; it was part of the policy for integrating women into the labour market. After the change of political regime, the number of places in kindergartens and crèches decreased, but not as substantially as in other countries in the region (Kovacheva and Pancheva 2003). The decrease was more a response to the decreasing number of children of these ages and thus an attempt to avoid surpluses in the places available. Additionally, the parents’ payment for the kindergartens has also risen, although kindergartens are still subsidized by the state, the local budget, sponsorships, and other sources.
The right to abortion was recognized comparatively early, in 1957, and it was largely associated with an attempt at gender equality. However, this right was restricted in 1973 in order to stimulate the growth of birth rates. In parallel with its tight-fisted handling of abortion, the state was also reluctant to facilitate mass access to contraception (Todorova 2000). This resulted in an increase of illegal abortions and the establishment of specific social norms in the area of the family and reproduction. For example, the public would tolerate voluntary abortion much better than divorce (Todorova 2000).
Housing support for the family was never well developed in Bulgaria (Kovacheva and Pancheva 2003) in contrast to some other ex-socialist countries. During state-socialism young families had the right to receive bank loans for longer periods and at lower interest rates than other people. However, “there were insufficient flats to be bought in the cities and families signed up on long waiting lists” (Kovacheva and Pancheva 2003). Young families in villages most often managed to build family houses with their own resources. With the transition toward a market economy, the housing market started a slow improvement, but the state programs for support of young families were discontinued (Kovacheva and Pancheva 2003).
considerable demographic changes in Bulgaria were already recognized by the government in 1996 when a National demographic strategy and population policy was developed. The aim of the government was to slow down the unfavorable tendencies in the main demographic processes in the country. The government abandoned quantitative policy goals such as a positive population growth and focused instead on family life and the care of mother and child.
As of 2006 a new strategy was implemented and is planned to be in force over the period 2006–2020. Its main aim is to raise the human capital of the population to attain a contemporary knowledge-based society. The increase in human capital will be sought through improved education and improved health care. Quantitative goals are not lacking in the new strategy. Life expectancy is expected to increase by two years by 2020; infant mortality should drop from 12.3 to 9.5 per thousand. Teenage fertility should decrease by half, a measure that responds to the necessity to improve the sexual culture of the population. The regional distribution of the population is also a concern since a number of villages and areas in the country have been abandoned. The strategy takes general note of a number of features in societal life whose improvement is closely related to demographic problems, such as gender issues, part-time work, and housing. A specific topic is the legal regulation of non-marital cohabitation. It is expected to be achieved with a new Family Code now under discussion.
5. Fertility: which way?
The title poses a question that does not have a rigorous answer. What we present is our “informed speculation” of the likely fertility change in the future based on the exposition in this paper as well as on the cited literature.
The societal transformation that started with the fall of the totalitarian regime encompassed all spheres of life at both the macro- and the micro-level. Individuals and families have had to adapt to a drastically changing political and economic environment that required new knowledge, for example, about democracy and the market economy. The speedy transition caused a break of norms and traditions. Disorientation, anxiety, and uncertainty were unavoidable consequences. It is no wonder that demographic behaviour changed considerably under these conditions.
accept contemporary democratic values. On the other side, the “losers” of the transition are people who cannot adapt. They include those who are most disoriented, those who feel most strongly the pressure of social anomie, since they cannot rely on the directive role of established norms. They postpone or avoid births because they need to care about personal survival, at present or in the future. Overall, the drop in fertility is a consequence for “losers” and for “winners” alike, albeit for different reasons. Although Philipov et al. (2006) have provided some evidence on this topic, we feel that a further elaboration could be beneficial for the better understanding of fertility change in Bulgaria and other central and eastern European countries.
What can we say about the future of fertility? We may expect that changes in the reasons for not having children may lead to a change in fertility. Our conjectures follow.
Before looking into the likely effect of the changes in reasoning, we must recall the speed of change in the trends of fertility and its proximate determinants. This speed is fast in comparison with the past but it is not as fast as what can be observed in other central European countries such as the Czech Republic (see papers in the present volume). In fact not only demographic change but also general societal change proceeds more slowly in Bulgaria. There is therefore a demographic and societal lag in a change that has the same direction as in the neighboring countries. We find it likely, therefore, that in the next few years or over about a decade, we will observe the continuation of some ongoing trends and the stabilization of others.
In particular, we expect stabilization in Bulgarian fertility levels. Voluntary childlessness is on the rise, but the data do not indicate that it will reach levels observed in other countries in western and central Europe. The TFR reached its lowest point at the end of the 1990s but we see it as likely to remain around 1.3 to 1.5 during the next few years, i.e., around the level observed in 2006.
We expect postponement of childbearing to be pervasive. The mean age of entry into a first marriage or of transition to parenthood is still considerably lower than those observed in other countries in transition. This means that there could be more “room” for a change in Bulgaria.
The rise in cohabitation observed during recent years is also likely to continue. The same is expected of the spread of family planning and a further drop in abortions.
We now turn to the reasons for these expectations.
Ongoing ideational change is likely to intensify and to include an increasing number of people. Its impact on fertility in Bulgaria is unknown; we speculate, though, that a rise in the surge for individual autonomy, significant changes in gender relations, and similar developments will work toward a continued postponement of births.
The economic situation in the country is improving, as indicated by diverse economic indices included in the website of the National Statistical Institute. We do not know well its impact on fertility, so it is hard to predict whether a rise in incomes will lead to more children or to a desire for an increased quality of each child’s life.
Finally, we need to consider the impact of population policies. The National Strategy for demographic development from 2006 sets as its task the improvement of those spheres of life that we know will influence fertility. It will not be introduced aggressively as was the case in the past, but we expect its effect to be pronounced in the long run. It may well bring about a moderate increase in fertility. Our subjective opinion is that its contribution may come mainly through those policy instruments that make it easier for couples to assure a higher quality of life for their children, rather than through instruments that encourage quantity of children.
References
Baizan, P., A. Aassve, and F. Billari. 2003. Cohabitation, marriage, and first birth: the interrelationship of family formation events in Spain, European Journal of Population
19:147–69.
Baytchinska, K., and M. Garvanova. 2005. Gender differences in value system–individual and sociocultural influences, Sociological Problems (1–2): 244–61. (in Bulgarian).
Belcheva, M., 2003. Census 2001, Volume 6: Sample Surveys, Book 2: Fertility and Reproductive Behavior. Sofia, National Statistical Institute, Bulgaria: Dunav press (in Bulgarian). Beleva, I., and V. Tzanov. 2001. Labour Market Flexibility and Employment Security. Geneva:
International Labour Office.
Bhaumik, S., and J. Nugent. 2002. Does economic uncertainty have an impact on decision to bear
children? Evidence from Eastern Germany. MPIDR Working Paper WP 2002–037.
Rostock: Max Planck Institute for Demographic Research. http://www.demogr.mpg.de/ papers/working/wp-2002-037.pdf.
Billari, F., and D. Philipov. 2003. Mutual relationship between education and women's entry into a first union: the case of Central and Eastern Europe, in I. Kotowska and J. Jozwiak (Eds.), Population of Central and Eastern Europe. Challenges and Opportunities. Warsaw: Statistical Publishing Establishment, pp: 201–18.
Billari, F., and D. Philipov. 2004. Education and the transition to motherhood: a comparative
analysis of Western Europe. European Demographic Research Paper 3. Vienna: Vienna
Institute of Demography.
Blossfeld, H-P., and J. Huinink. 1991. Human capital investments or norms of role transition? How women's schooling and career affect the process of family formation, American Journal of Sociology 97(1):143–68.
Bongaarts, J., and G. Feeney. 1998. On the quantum and tempo of fertility, Population and
Development Review 24(2):271–91.
Buber, I. 2001. The effect of the completion of education on entry into motherhood in Austria.
Working Paper Nr. 22. Vienna: Institute for Demography, Austrian Academy of Sciences. Bühler, C., and D. Philipov. 2005. Social capital related to fertility: theoretical foundations and empirical evidence from Bulgaria, in W. Lutz and G. Fechtinger (Eds.), Vienna Yearbook of Population Research 2005. Vienna: Austrian Academy of Sciences Press, pp: 53–81. Carlson, E., and S. Tsvetarsky. 2000. Birth weight and infant mortality in Bulgaria’s transition
crisis, Pediatric and Perinatal Epidemiology 14:159–162.
Carlson, E., and V. Lamb. 2001. Changes in contraceptive use in Bulgaria, 1995–2000, Studies in Family Planning 32(4):329–38.
Council of Europe. 2001. Recent Demographic Developments in Europe, Strasbourg: Council of Europe Publishing.
Council of Europe. 2003. Recent Demographic Developments in Europe, Strasbourg: Council of Europe Publishing.
Council of Europe. 2004. Recent Demographic Developments in Europe, Strasbourg: Council of Europe Publishing.
Di Giulio, P., and E. Koytcheva. 2007. The changing meaning of cohabitation: an analysis of
selected European countries. Poster presented at the Annual Conference of the
Frejka, T., and J.-P. Sardon. 2004. Childbearing Trends and Prospects in Low-Fertility Countries. A Cohort Analysis. Dordrecht, Netherlands: Kluwer Academic Publishers. Genov, N. 1998. Transformation and anomie: problems of quality of life in Bulgaria, Social
Indicators Research 43:197–209.
Heikkilä, M., and S. Kuivalainen. 2003. Using social benefits to combat poverty and social exclusion: opportunities and problems from a comparative perspective. European Synthesis Report, Trends in Social Cohesion 3. 45–46.
Hoem, B. 1996. The social meaning of the age at second birth for third-birth fertility: a methodological note on the need to sometimes respecify an intermediate variable,
Yearbook of Population Research in Finland 33:333–39.
Hoem, J., A. Prskawetz, and G. Neyer. 2001. Autonomy or conservative adjustment? The effect of
public policies and educational attainment on third births in Austria. MPIDR Working
Paper WP 2001-016. Rostock: Max Planck Institute for Demographic Research. http://www.demogr.mpg.de/Papers/Working/wp-2001-016.pdf.
Holzer, J. 1995. From state to market economy: the population dimension. Paper presented at the European Population Conference, Milan, Italy, September 1995.
Kaltchev, I. 2001. Emigration of the Bulgarian Population. Russe, Bulgaria: Dunav Press (in Bulgarian).
Kohler, H-P., F. Billari, and J. Ortega. 2002. The emergence of lowest-low fertility in Europe during the 1990s, Population and Development Review 28(4): 641–80.
Kohler, I., J. Kaltchev, and M. Dimova. 2002. Integrated information system for demographic
statistics ‘ESGRAON TDS’ in Bulgaria. MPIDR Working Paper WP 2002-010. Rostock:
Max Planck Institute for Demographic Research. http://www.demogr.mpg.de/ papers/working/wp-2002-010.pdf.
Kotzeva, T., and D. Kostova. 2004. Living arrangements and attitudes toward sex and wedlock of young adults in 1990s in Bulgaria, Naselenie (1-2). (in Bulgarian), pp. 55–66.
Kotzeva, T., and D. Kostova. 2006. (forthcoming). Young People and Intimacy in Times of Social Change. Sofia, Bulgaria: Marin Drinov Publishing house, (in Bulgarian).
Kovacheva, S., and T. Pancheva. 2003. Country contextual report: Bulgaria, in C. Wallace (Ed.),
Households, Work and Flexibility Research Report Nr. 2. HWS Series of Project
Research Reports, Vienna: Institute for Advanced Studies, pp. 239–294.
Koytcheva, E. 2006. Social-demographic differences in fertility and family formation in Bulgaria before and after the start of the societal transition. Rostock, University of Rostock. Kreyenfeld, M. 2002. Time-squeeze, partner effect or self-selection? An investigation into the
positive effect of women's education on second birth risks in West Germany,
Demographic Research 7(2): 15–48.
Lappegard, T., and M. Ronsen. 2004. The multifaceted impact of education on entry into
motherhood. Paper presented at the Conference of the Population Association of
America, Boston, April 2004 .
Lesthaeghe, R., and D. J. van de Kaa. 1986. Twee Demografische Transities?, in D. J. van de Kaa and R. Lesthaeghe (Eds.), Groei en Krimp. DDeventer: Van Loghum–Slaterus, pp. 9–24. Liefbroer, A., and M. Corijn. 1999. Who, what, where, and when? Specifying the impact of
educational attainment and labour force participation on family formation, European Journal of Population 15:45–75.
National Statistical Institute (NSI). 2005. See www.nsi.bg/Cpi/Cpi.htm and www.nsi.bg/ Gdp/Gdp.htm
Nikolova, M. 2005. Domestic labour: results from empirical sociological survey, Naselenie (1– 2):136–47. (in Bulgarian)
Pamporov, A. 2003. The Second Demographic Transition is impossible: Family patterns of Roma
(Gypsies) in Bulgaria. Poster Presented at the Euresco Conference 2003: The Second
Demographic Transition in Europe, Spa, Belgium, 19–24 June 2003.
Pamporov, A. 2005. Structures of Romany everyday life in Bulgaria. PhD Thesis. Institute of Sociology at the Bulgarian Academy of Sciences, Sofia.
Philipov, D. 2001. Fertility and Family Surveys in Countries of the ECE Region: Standard Country Report – Bulgaria. Geneva, Switzerland: United Nations.
Philipov, D. 2002. Fertility in times of discontinuous societal change: the case of Central and
Eastern Europe. MPIDR Working Paper WP 2002–024. Rostock: Max Planck Institute
for Demographic Research. http://www.demogr.mpg.de/papers/working/wp-2002-024.pdf.
Philipov, D., and H.-P. Kohler. 2001. Tempo effects in the fertility decline in Eastern Europe: evidence From Bulgaria, the Czech Republic, Hungary, Poland and Russia, European Journal of Population 17(1):37–60.
Philipov, D., Z. Spéder, and F. Billari. 2006. Soon, later or ever? The impact of anomie and social capital on fertility intentions in Bulgaria (2002) and Hungary (2001), Population Studies
60(3.): 289–308.
Pisankaneva, M. 2003. The forbidden fruit: sexuality in communist Bulgaria. Paper presented at the conference “Past and Present of Radical Sexual Politics,” University of Amsterdam, 3–4 October 2003.
Ranjan, P. 1999. Fertility behavior under income uncertainty, European Journal of Population
15:25–43.
Sobotka, T. 2002. Ten years of rapid fertility changes in the European post-communist countries:
evidence and interpretation. Population Research Center, Working Paper Series, 02–1,
University of Groningen.
Sougareva, M. 1995. Marriages and divorces of the ethnic groups in Bulgaria (with the data of the last population census), Naselenie (1–2):113–23 (in Bulgarian).
Sowards, S. 1996. Twenty-five lectures on modern Balkan history, Lecture 23: Social and
economic change in the Balkans. [Web Page]. Available at www.lib.msu.edu/
sowards/balkan/lect23.htm.
Todorova, V. 2000. Family law in Bulgaria: legal norms and social norms, International Journal of Law, Policy and the Family 14:148–81.
van de Kaa, D. J. 2003. Demographies in Transition': an Essay on Continuity and Discontinuity in Value Change, in E. Kotowska and J. Jozwiak (Eds.), Population of Central and
Eastern Europe. Challenges and Opportunities. Warsaw: Statistical Publishing
Establishment, pp: 641–643.
Zhekova, V. 2000. Tendencies in the development of fertility in Bulgaria, Naselenie (2):80–97 (in Bulgarian).