University of New Orleans University of New Orleans
ScholarWorks@UNO
ScholarWorks@UNO
University of New Orleans Theses and
Dissertations Dissertations and Theses
5-20-2011
Assessing Microbial Diversity Through Nucleotide Variation
Assessing Microbial Diversity Through Nucleotide Variation
Ahmet Eren
University of New Orleans
Follow this and additional works at: https://scholarworks.uno.edu/td
Recommended Citation Recommended Citation
Eren, Ahmet, "Assessing Microbial Diversity Through Nucleotide Variation" (2011). University of New Orleans Theses and Dissertations. 1307.
https://scholarworks.uno.edu/td/1307
This Dissertation is protected by copyright and/or related rights. It has been brought to you by ScholarWorks@UNO with permission from the rights-holder(s). You are free to use this Dissertation in any way that is permitted by the copyright and related rights legislation that applies to your use. For other uses you need to obtain permission from the rights-holder(s) directly, unless additional rights are indicated by a Creative Commons license in the record and/ or on the work itself.
Assessing Microbial Diversity Through Nucleotide Variation
A Dissertation
Submitted to the Graduate Faculty of the
University of New Orleans
in partial fulfillment of the
requirements for the degree of
Doctor of Philosophy
in
Engineering and Applied Science
Computer Science
by
Ahmet Murat Eren
B.S., Canakkale Onsekiz Mart Universitesi, 2002
M.S., Canakkale Onsekiz Mart Universitesi, 2005
ACKNOWLEDGEMENTS
I would like to thank my advisor Christopher M. Taylor for his help, guidance and his open mindedness. When I decided to change my research focus to microbial ecology in the middle of my Ph.D. education, he accepted the offer to be my advisor, facilitated an
energetic collaboration with Michael J. Ferris and let me be a part of it.
I owe my deepest gratitude to Michael J. Ferris. It has been almost 2 years since I started working under his supervision, and I can clearly see that meeting with Michael J. Ferris was one of the most important milestones of my life. Among many other reasons, I am very thankful to him for tolerating my excitement, patiently teaching me and
introducing me to the world of microbes.
I would also like to thank the invaluable members of my Ph.D. committee, Christopher M. Summa, Daniel Bilar and Huimin Chen. I wish I had been wise enough to benefit from their vision just a little more.
I honestly do not think that I would be able to finish this Ph.D. if it were not for the support of Seth Pincus, director of the Research Institute of Children's at Children's
I am grateful to my dear colleagues Marcela Zozaya-‐Hinchliffe, Caroline E. Hennigan and Johana Norori for their support. Thanks to all faculty and staff of Children's Hospital and the Department of Computer Science in University of New Orleans.
My appreciation also extends to James Nachtwey, Richard Feynman, Kurt Vonnegut and Oğuz Atay for all the inspiration and strong influence.
I would also like to express my deep gratitude to those whom I met, and who had an impact on the course of my life: Nefin Huvaj, Mihail Guber, Mevzun Yüksel, Necdet Yücel, Doruk Fişek, Koray Löker, Oğuzhan Dinçer, Alp Öztarhan, Barış Metin, S. Çağlar Onur, Gürer Özen, Erkan Tekman, Murat Gündüz, Kevin Simpson and Aslı Şahin. Thank you very much.
There are people that I cannot thank enough. Therefore I will not dare to try. However, I would like to mention their names here: B. Duygu Özpolat, Arpat Özgül and Ashley Wright.
Finally, I frankly admit that I am here, writing this page in this library carrel, simply because I was lucky.
TABLE OF CONTENTS
LIST OF FIGURES ... ix
LIST OF TABLES ... xiii
ABSTRACT ... xiv
INTRODUCTION ... 1
CHAPTER I ... 3
Microbial Beings ... 3
Microbial Ecology ... 4
16S Ribosomal RNA Gene ... 6
Powerful Duo: Pyrosequencing and 16S Ribosomal RNA Gene ... 7
Microbial Communities and Human Health ... 9
Microbial Community Analysis from a Computational Perspective ... 13
Quality Control ... 13
Taxonomic Classification ... 14
Alpha Diversity Analyses ... 15
True Diversity Estimation ... 16
Species Diversity Assessment ... 17
Rarefaction Curves ... 17
Beta Diversity Analyses ... 18
Clustering ... 18
Principal Coordinate Analysis ... 21
CHAPTER II ... 22
A Framework for Analysis of Metagenomic Sequencing Data ... 23
Motivation ... 23
Technical Features ... 25
Server ... 26
Client ... 27
Limitations ... 27
Workflow ... 28
Future Work ... 32
Discussion ... 35
CHAPTER III ... 37
Methods ... 39
Sample Collection and Clinical Measurements ... 39
Molecular Methods ... 40
Extracting Gardnerella vaginalis Sequences and Alignment ... 41
Identifying Variable Regions within Aligned Sequences and Generating Oligotypes ... 42
Creating Parsimony for Oligotypes and UniFrac Analysis of Samples ... 43
Results ... 45
Discussion ... 49
CONCLUSION ... 51
EPILOGUE ... 53
Diversity Assessment ... 53
Sampling ... 54
Species Concept ... 56
REFERENCES ... 60
APPENDIX ... 71
G. vaginalis Oligotype Profile Comparison Between Couples ... 71
Pearson Correlation Table for G. vaginalis Oligotype Profiles Among Couples ... 74
Summary of Specimens After BLAST Filtering ... 75
Oligotype Distribution Among Sample Groups ... 76
Cascading clustering of G. vaginalis Sequences from Normal and BV Diagnosed Women .. 78
LIST OF FIGURES
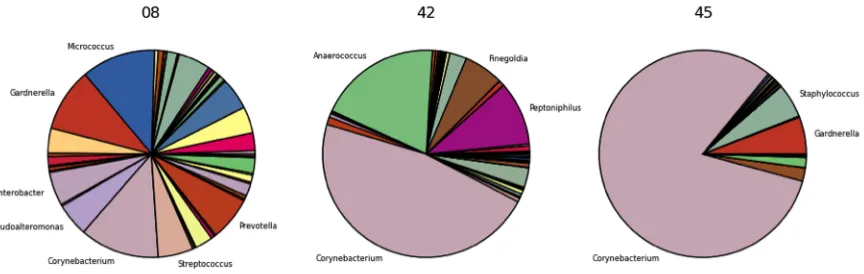
Figure 1. Architectural overview of the framework. ... 26 Figure 2. Basic workflow of the framework. Analysis begins with the submission of a FASTA formatted 16S rRNA sequence file. ... 29 Figure 3. Example pie chart figures show bacterial composition at the genus level of three
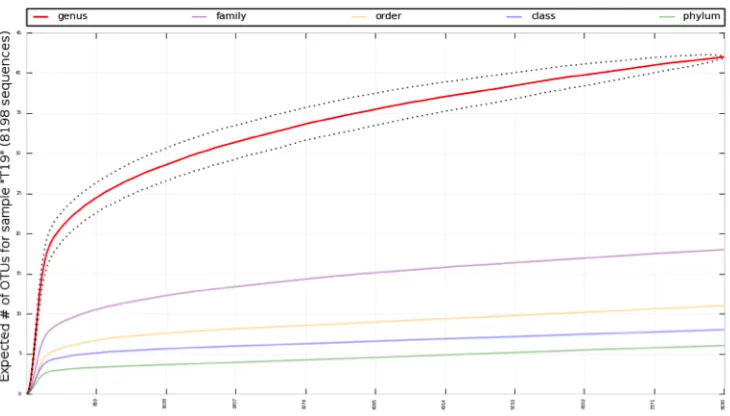
random samples from a bacterial vaginosis study analyzed using the framework. ... 30 Figure 4. In this example set of rarefaction curves, species richness and expected number of OTUs are shown at different taxonomic levels of a sample that was analyzed using the framework. ... 32 Figure 5. Example dot plot of a subset of samples assigned to two categories, NEC (green)
or NORMAL (red) showing differences in the percent abundance of three different OTUs at the phylum level. ... 33 Figure 6. Example heatmap generated by the framework showing how a subset of samples
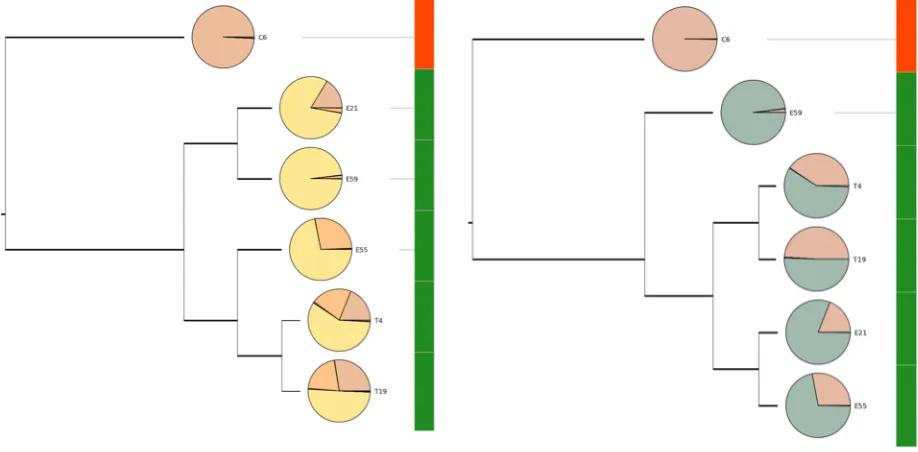
heatmap, while the penile skin swab samples cluster together on the right side of the heatmap. ... 34 Figure 7. Example dendrograms generated by the framework showing samples from a
necrotizing enterocolitis study clustered based on their microbial composition at the genus and family level. Smaller versions of the pie chart representations of samples attached to dendrograms to provide additional visual evidence for clustering results. ... 35 Figure 8. Visual representation of 500 aligned tag sequences that cover V4-‐V6 regions of
16S rRNA gene. Red, green, blue and yellow colors denote A, T, C and G bases
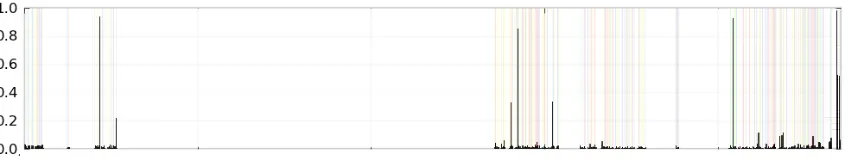
respectively. White regions are gaps that were introduced by alignment process. ... 42 Figure 9. Shannon entropy analysis per column for 70,037 reads overlaid on the visual
representation of aligned sequences. Peaks in entropy indicate nucleotide variation at given locations. ... 42 Figure 10. Oligotype profiles in various female patients and their sexual partners. Different
colors in pie charts correspond to different oligotypes. Despite the number of different compositions among women, significant correlations between sexual partners
supported the idea that G. vaginalis types are shared between sexual partners. ... 44 Figure 11. Oligotype distribution among samples. Bars show the percentage of samples in a
Figure 12. Parsimony of 65 oligotypes that were present in any sample with more than 1% abundance. Bars next to oligotypes indicate in how many samples they were present out of 130 total. Rectangles, diamonds and triangles denote the presence of a given oligotype in vaginal swab, urethra and penile skin samples, respectively. Red, orange and green colors indicate BV, intermediate and normal female patients and their sexual partners. ... 48 Figure 13. Hierarchical clustering of oligotype profiles from vaginal swab samples (a)
(clustering significance: p < 0.001, UniFrac significance: p = 0.016), urethra samples (b) (clustering significance: p < 0.001, UniFrac significance: p = 0.077) and penile skin samples (c) (clustering significance: p = 0.011, UniFrac significance: p = 0.001) based on their UniFrac distances. Red, orange and green colors indicate samples from BV, intermediate and normal diagnoses, respectively. ... 49 Figure 14. Comparison of G. vaginalis oligotype profiles from 654 vaginal swab sequences
versus 495 penile skin sequences of BV couple 11 (r = 0.956, p < 0.001). ... 71 Figure 15. Comparison of G. vaginalis oligotype profiles from 357 vaginal swab sequences
versus 421 penile skin sequences of BV couple 14 (r = 0.970, p < 0.001). ... 72 Figure 16. Comparison of G. vaginalis oligotype profiles extracted from 2686 vaginal swab
sequences versus 3653 penile skin sequences of BV couple 22 (r = 0.999, p < 0.001). 72 Figure 17. Comparison of G. vaginalis oligotype profiles extracted from 308 vaginal swab
Figure 18. Comparison of G. vaginalis oligotype profiles extracted from 932 vaginal swab and 575 urethra sample sequences of BV Couple 26 (r = 0.984, p < 0.001). ... 73 Figure 19. Comparison of G. vaginalis oligotype profiles extracted from 895 vaginal swab
and 1313 penile skin sample sequences of BV Couple 29 (r = 0.948, p < 0.001). ... 73 Figure 20. Comparison of G. vaginalis oligotype profiles extracted from 1193 vaginal swab
and 10 penile skin sample sequences of Intermediate Couple 03 (r = 0.995, p < 0.001). ... 73 Figure 21. Comparison of G. vaginalis oligotype profiles extracted from 93 vaginal swab and 3 penile skin sample sequences of Normal Couple 23 (r = 0.937, p < 0.001). ... 74 Figure 22. Clustering of 373 16S rRNA V4-‐V6 G. vaginalis sequences collected from vaginal
swab samples of 13 normal women (a) and randomly selected 373 sequences from 39 women who were diagnosed with bacterial vaginosis (BV) (b; c; d). Every tier
represents clusters at a certain sequence similarity level. Starting from the innermost tier (92% similarity) to the outermost (100%), clusters are being re-‐clustered with an increased similarity threshold by 2%. Unlike sequences from normal women,
LIST OF TABLES
Table 1. Pearson correlation (r) between sexual partners based on their G. vagnialis oligotype profile. For every couple, oligotype profile of female patient's vaginal swab was compared to her sex partner's oligotype profile drawn from his urethra sample, and penile skin sample in order to quantify correlation. 2 Couples, whose male
partners haven't yielded any Gardnerella vaginalis sequences, are not included. ... 74 Table 2. The number of specimens in the original pyrosequencing library versus the
ABSTRACT
Microbes are the most abundant and most diverse form of life on Earth, constituting the largest portion of the total biomass of the entire planet. They are present in every niche in nature, including very extreme environments, and they govern biogeochemical
transformations in ecosystems. The human body is home to a diverse assemblage of
microbial species as well. In fact, the number of microbial cells in the gastrointestinal tract, oral cavity, skin, airway passages and urogenital system is approximately an order of magnitude greater than the number of cells that make up the human body itself, and changes in the composition and relative abundance of these microbial communities are highly associated with intestinal and respiratory disorders and diseases of the skin and mucus membranes. In the early 1990's, cultivation-‐independent methods, especially those based on PCR-‐amplification and sequences of phylogenetically informative 16S rRNA genes, made it possible to assess the composition of microbial species in natural
INTRODUCTION
Life is one of the most interesting phenomena in the observable universe –and as far as we know, the most abundant, diverse, and adaptable form of life in the universe is
"microbial life".
Biology, the study of life, is itself living its golden age thanks to the recent
breakthroughs in genetics and advancements in sequencing technologies. It has been only 40 years since Walter Fiers and his team sequenced a complete gene for the first time (Min Jou, Haegeman, Ysebaert, & Fiers, 1972), and today high-‐throughput sequencing platforms can sequence more than 400,000,000 nucleotides in a matter of hours.
It is impossible to make sense of this tremendous amount of sequence data without state-‐of-‐the-‐art computer technology and bioinformatics; but in order to approximate what nature has to say, computational methodologies should be more biology-‐aware. This
dissertation presents a novel computational approach in order to assess diversity, which is being missed by de facto approaches, at finer scales of microbial communities through tracing subtle nucleotide variations.
Aside from the Introduction, Conclusion and Epilogue, there are three main chapters in this study.
RNA genes, the impact of microbial communities on human health, and finally, commonly used techniques to analyze vast amounts of genetic sequence data. In this section, notable publications and suggested readings from the literature are cited.
Chapter II describes a computational framework, developed by the author, which empowers biologists to analyze metagenomic sequence data. This framework was
developed to provide a powerful, easy to use, computational tool to researchers in the field of microbial ecology. It is essentially a visualization and statistical analysis environment, which is currently being used by numerous research projects and was supported by funding from the Research Institute for Children in New Orleans and a grant from the NIH 5RO1AI79071-‐2.
Chapter III presents a discussion regarding the novel contributions of this study: assessing microbial diversity through nucleotide variation within 16S rRNA gene tags.
CHAPTER I
Microbial Beings
In addition to their critical role in evolution, microbes are an essential component of life on Earth.
Microbes are ubiquitous in nature. They dominate life on the planet, not only in terms of total number of individuals and total biomass, but also in terms of their incredible
metabolic diversity (Whitman, Coleman, & Wiebe, 1998). They are the driving force behind global biogeochemical cycles; they govern global carbon flux and carbon fixation, nitrogen flux and nitrogen fixation. Microbes globally control sulfur, iron and other essential
molecules for biological processes. In addition, their vigorous metabolic adaptations have allowed them to colonize even the most extreme environmental niches our planet has to offer (Rothschild & Mancinelli, 2001).
Microbial beings make up the vast majority of the species in all three domains of life on earth, which were first proposed by Woese (Woese & Fox, 1977; Woese, Kandler, &
theories about whether bacteria, archea or eukaryotes, or other now extinct cells, were the first life forms to evolve (Zimmer, 2009; Brown, 2003), archea and bacteria constitute the most diverse and ecologically interesting clade on the tree of life and they are the primary focus of this study.
Microbial Ecology
Microbial ecology, the relatively young and flourishing juncture of ecology and microbiology, is the study of microbes and their interactions with their environment.
Identifying and classifying microbes, and studying them in their natural environments, has long been an obstacle to progress in microbial ecology. The advent of PCR, genetic sequencing and other cultivation-‐independent molecular methods led to remarkable advancements in microbiology and microbial ecology has become a well-‐established field. Advancements in microscopy made it possible to observe bacteria in environmental samples however the simple morphological characteristics of bacteria are not sufficient to identify individual species or to establish a phylogenitically meaningful system of
taxonomy based on the principles of evolution. In the past, to identify bacteria, it was necessary to cultivate them in a laboratory setting and test them for certain physiological and biochemical traits. Bacterial culture studies done under controlled laboratory
conditions were needed in order to produce enough cells to observe their responses to certain required tests for identification. Unfortunately, most of the bacteria that are
Schleifer, 1995). Recent developments in sequencing technologies, in addition to the introduction of 16S Ribosomal RNA (rRNA) gene as a phylogenetic marker for
identification (Olsen, Lane, Giovannoni, Pace, & Stahl, 1986), ultimately made cultivation-‐ independent studies possible and allowed microbial ecologists to develop a better
understanding of the diversity within microbial communities.
Sanger's method for DNA sequencing (Sanger, Nicklen, & Coulson, 1977) was one of the critical breakthroughs in biological sciences and became one of the core components of basic biological research. Almost a decade after Sanger's achievement, Pål Nyrén developed the idea of bioluminometric DNA sequencing, which depends on measuring pyrophosphate release during DNA synthesis (Nyrén, 2007). Nyrén’s idea eventually enabled 454 Life Sciences, a biotechnology company now a subsidiary of Roche, to introduce massively parallel high-‐throughput pyrosequencing method (Margulies et al., 2005) with the capacity of sequencing millions of bases in a matter of hours (as of today, ~5x10⁵ reads in less than
8 hours with 454 GS FLX). Since 2005, pyrosequencing has been utilized in numerous applications from whole genome sequencing to genotyping (King & Scott-‐Horton, 2007) and detecting single-‐nucleotide polymorphisms (Fakhrai-‐Rad, Pourmand, & Ronaghi, 2002).
Ribosomal RNA gene, pyrosequecinging today is a lieutenant of microbial ecology to obtain sequence data that would undergo an analysis to characterize microbial populations sampled from natural environments. Due to the vast amount of sequencing data being produced, microbial ecology research depends heavily on computer science and computational statistics.
16S Ribosomal RNA Gene
For a long time, investigating relationships between organisms depended on observable phenotypical patterns. Then molecular techniques such as DNA-‐DNA hybridization
(Southern, 1975) let researchers measure whole genome similarities between two or more species (Socransky et al., 2004; Sibley & Ahlquist, 1984). Along with the emergence of sequencing technologies, measurement of evolutionary relationships and building phylogenies based on the genomic information gained a new direction (Zuckerkandl & Pauling, 1965).
Woese and Fox were the first to reveal the potential of Ribosomal RNA genes as
efficient sources of information to build phylogenetic trees that would reflect evolutionary descent of species (Woese & Fox, 1977).
Ribosomal RNA genes, namely 5S, 16S and 23S in prokaryotes, are essential
components of bacterial and archeal genomes as they are responsible for the formation of the ribosome: the vital organelle in all living cells that administers protein assembly. Even though 5S and 23S Ribosomal RNA genes also exhibit phylogenetic value, the 16S
The 16S rRNA gene, due to its structural function in the formation of the ribosome, has been under relentless evolutionary pressure. Through the journey of prokaryotes, this pressure created compartments within this 1542 nucleotide long curious and ancient gene into numerous highly conserved and variable regions.
DNA-‐DNA hybridization studies show a significant correlation between 16S rRNA gene similarity and whole genome similarities (Keswani & Whitman, 2001). This proves the 16S rRNA gene very useful for phylogenetic purposes on one hand. On the other hand, there are also purely biological concerns about relying on Ribosomal RNA sequence similarity as a measure of evolutionary relatedness, especially for closely related taxa. The majority of these concerns stem from poor ultrametric attributes of the 16S rRNA gene (Sneath, 1993), mostly due to low resolution and incongruities between Ribosomal RNA divergence and evolutionary divergence (Keswani et al., 1996). Despite these concerns, today, the 16S rRNA gene is still the most popular tool for studying microbial populations in depth.
Powerful Duo: Pyrosequencing and 16S Ribosomal RNA Gene
Although pyrosequencing gives relatively longer read lengths than other prominent high-‐throughput sequencing technologies (~150bp for Genome Analyzer IIx by Illumina Inc., and ~75bp for SOLiD™ by Applied Biosystems as of today), the full-‐length 16S rRNA gene is quite a bit longer than the maximum read length of pyrosequencing (~400-‐500bp), rendering it unviable to sequence the entire 16S rRNA gene without requiring assembly.some of the hypervariable regions of the 16S rRNA gene are not only below the maximum read length that pyrosequencing can reach, they are also specific enough to be used as phylogenetic markers (Liu, Lozupone, Hamady, Bushman, & Knight, 2007) for taxonomical assignment purposes, and diversity analyses of the microbial communities in
environmental samples (Pace, 1997). This method is known as hypervariable tag
sequencing (Huse et al., 2008), and it allows researchers to utilize massively parallel high-‐ throughput pyrosequencing to observe a very large number of individuals from a microbial sample by using only partial information from the 16S rRNA gene.
Another technique called DNA barcoding (Binladen et al., 2007; Hamady, Walker, Harris, Gold, & Knight, 2008), allows researchers to generate 16S rRNA gene tag sequences from multiple samples with one pyrosequencing run by incorporating unique tags into each PCR primer that are going to be used during the PCR amplification. As of today, one pyrosequencing run can generate hundreds of thousands of sequences from hundreds of samples simultaneously and provides great advantages over the traditional methods of working with microbial samples.
of sample coverage, these methods are not comparable to the depth of unexplored biodiversity revealed with the pyrosequencing of 16S rRNA gene tags.
Microbial Communities and Human Health
Bacteria colonize the human body in the gastrointestinal tract, oral cavity, skin, airway passages and urogenital system (Group et al., 2009). One estimation indicates that there are 500 to 1000 different bacterial species harbored in different sites of the human body (Sears, 2005). Yet another striking discovery is that the number of bacterial cells that live on an average person's body is ten times more than the number of eukaryotic cells that make up the body itself (Savage, 1977; Berg, 1996). Considering the astronomical numbers and the diversity of bacterial cells that are harbored in different sites of the human body, it is not surprising that there are correlations between health and disease states and changes in the composition of microbial communities (Sandoval & Seeley, 2010).
From extracting nutrition trapped in the diet, to training our immune system, we do rely on bacteria throughout our lives (Dethlefsen, McFall-‐Ngai, & Relman, 2007). At the moment of birth all body sites that are eventually going to become home to an assemblage of microbes are essentially sterile. Heavily influenced by the type of delivery (Biasucci, Benenati, Morelli, Bessi, & Boehm, 2008), swift colonization starts with the bacteria from the mother as well as the surrounding environment (Mackie, Sghir, & Gaskins, 1999). Advancements in microbial ecology have shed light on the dynamics of early
compositions; moreover, these communities show similarities among other people in respect to body site, more than other criteria such as sex or age (Costello et al., 2009). When pervasive effects of antibiotic treatments on gastrointestinal tract microbial communities have been characterized with deep sequencing, it has also revealed the sensitive and resilient nature of bacterial communities (Dethlefsen, Huse, Sogin, & Relman, 2008).
Struggling to understand the actual impact of microbial communities in the
gastrointestinal tract is an active field of research. Using model organisms to investigate the relationships between microbial communities and their hosts is also being conducted. Recent studies with rats, mice and primates that try to address how microbial communities affect the organ development and organ function rendered previously unknown aspects of this relationship, and gave hints about the rest of the iceberg. While a recent study showed that microbial flora in the gastrointestinal tract changes the liver function of mice by modulating gene expression patterns (Björkholm et al., 2009), another one presented evidence indicating that early microbial colonization might affect brain development (Heijtz et al., 2011). Yet another study shed light on how commensal bacteria in the gastrointestinal tract plays a key role on adaptive immunity against respiratory virus infections and shows that after antibiotic treatment viral replication remains high in lungs while immune response decreases (Ichinohe et al., 2011). Moreover, links between
that have been investigated. Besides the impact on physiological functions, recent preliminary findings suggested that commensal bacteria modulate serotonin levels (Desbonnet, Garrett, Clarke, Bienenstock, & Dinan, 2008) and anxiety-‐like behavioral patterns (Heijtz et al., 2011) in rats, which provokes us to question the extent of the bacterial influence on psychological traits.
Due to the intimate relationship between bacteria and humans (Sekirov & Finlay, 2006), consideration of a human being as a superorganism (Wilson & Sober, 1989) is not a new suggestion (Goodacre, 2007). Even though bacteria certainly have an interest in its hosts' well-‐being (Lederberg, 2000), there are tormenting diseases and medical conditions associated with the changes of the bacterial flora, such as obesity, Crohn’s disease, necrotizing enterocolitis and bacterial vaginosis.
Obesity is one of the medical conditions that are associated with microbial
communities. According to biochemical studies on microbial communities sampled from gastrointestinal tracts of obese and lean mice, the obese microbiome is more capable than the other in terms of the ability of extracting energy from diet (Turnbaugh et al., 2006), and this correlation has been explained with a slight shift in diversity and the relative
abundance of two phyla; Bacteroidetes and Firmicutes (Ley et al., 2005), indicating that even subtle changes in the diversity and composition may affect the functional outcome of the community.
genetic predisposition for developing Crohn's disease (Barrett et al., 2008), 16S rRNA gene tag-‐based analysis shows that the dominant members of Crohn's disease patients'
microbial communities manifest a significant temporal instability compared to the healthy group (Scanlan, Shanahan, O’Mahony, & Marchesi, 2006).
Necrotizing enterocolitis is a frequent disease among premature infants with a very high fatality rate (Wang et al., 2009). Necrotizing enterocolitis causes portions of the intestines to undergo tissue death and fall off. A very low diversity of microbes occupying the gastrointestinal tract has been associated with necrotizing enterocolitis cases and it is believed that microbial communities play an important role in the pathogenesis of the disease (Emami et al., 2009).
Bacterial vaginosis is a very common vaginal disorder associated with preterm delivery (Hillier et al., 1995). Drastic shifts in vaginal flora with the absence of Lactobacillus species in Bacterial vaginosis diagnosed women causes a decrease in the pH of the vaginal flora, which has been suggested as a cause of weak immune responses to sexually transmitted viruses (Sha et al., 2005). 16S rRNA gene-‐tag based studies revealed novel bacterial species in the flora of patients that are diagnosed with Bacterial vaginosis that were previously unknown (Oakley, Fiedler, Marrazzo, & Fredricks, 2008). There will be a more
comprehensive discussion of bacterial vaginosis in Chapter III.
Microbial Community Analysis from a Computational Perspective
Microbial communities have been explored in a wide range of environments and broadened our understanding about unforeseen diversity of prokaryotes (Sogin et al., 2006). There are various challenges attached to almost every step of working with microbial communities from sampling to sequence analysis, but nonetheless, 16S rRNA gene tag sequencing-‐based studies have provided invaluable information about the dynamics of microbial life in almost every natural environment.Numerous steps and methods are required to reveal the structure of a microbial community of interest. Once pyrosequencing reads are gathered from an environment as raw sequence data, it is necessary to quantify distributions of organisms. Following this step statistical and computational inference methods are utilized to shed light on microbial diversity, compare different environments to each other, perform cluster analysis, and to emphasize similarities between environments based on various distance metrics.
Quality Control
estimations. Therefore, in order to improve the trustworthiness of the data to meet the assumption of conventional algorithms, it is a required step to improve the overall quality of pyrosequencing reads by eliminating the low-‐quality ones before any analysis. Both the formulation of the quality issues and their impacts on analysis results (Quince et al., 2009; Reeder & Knight, 2009; Kunin, Engelbrektson, Ochman, & Hugenholtz, 2010), and
suggestions to overcome these (Huse, Welch, Morrison, & Sogin, 2010; Reeder & Knight, 2010; Malde, 2011; Quince, Lanzen, Davenport, & Turnbaugh, 2011) are an active field of research.
Taxonomic Classification
Once the quality expectations are satisfied, the next step for most of the studies working with a large number of sequences is to start revealing the content of their libraries by either (1) assigning taxonomy to their sequences by comparing sequences with the ones in public databases that contain sequences from known species, (2) clustering sequences into groups of operational taxonomic units (OTUs) based on an arbitrary sequence similarity threshold, or (3) a hybrid of these two to ease the time and computational power
requirements: first clustering sequences into OTUs and then picking representative sequences from every group, then assigning taxonomy to representative sequences and propagating it back to the original OTU group.
The Ribosomal Database Project (Cole et al., 2009) maintains a curated database of full length, high quality 16S rRNA genes and provides a naïve Bayesian classifier (Wang, Garrity, Tiedje, & Cole, 2007) to query environmental sequences against the RDP database for rapid assignment of higher-‐order taxonomy up to the Genus level. The RDP Classifier is the most commonly used tool to assign taxonomy to 16S rRNA gene tag sequences; but it does not provide any genetic distance metric.
BLAST (Basic Local Alignment Search Tool) (Altschul, Gish, Miller, Myers, & Lipman, 1990) is also used to find the most similar sequence in a database by measuring the pairwise aligned distance of a given sequence and the sequences in a target database. GreenGenes (DeSantis et al., 2006) provides a database specifically designed for 16S rRNA gene tag sequence analyses along with a pre-‐computed phylogenetic tree, so identification numbers of highest BLAST hits can later be used to generate phylogenetic comparison-‐ based distance matrices for various analyses.
Alpha Diversity Analyses
Alpha diversity analysis methods are among the most fundamental descriptive tools of ecology and have been used to describe species richness or diversity in an environment. Today, most alpha diversity measurements are being used for statistical examination of samples collected from microbial communities. These measurements may be broken up into the following categories: True Diversity, Species Diversity Assessment and Rarefaction Curves.
True Diversity Estimation
One of the major issues of microbial ecology is to address how well a sample represents a community's true diversity since it confronts researchers with a fundamental problem: sampling bias. Mostly due to the vast scaling differences involved with sampling, reliable and applicable solutions to measure how well a sample represents a community’s true diversity is very hard to develop. However, microbial ecologists still have to rely on their samples to speculate about the diversity of their original communities and this requires heavy use of computational statistics (Hughes, Hellmann, Ricketts, & Bohannan, 2001).
There are several widely used non-‐parametric and computationally lightweight "true diversity" estimators that rely on abundance data, such as Chao1 (Chao, 1984) and ACE (Chao & Lee, 1992). But these are known to be prone to skewed results when working with very high diversity situations, which is expected to be the case with most microbial
community analysis studies (Sogin et al., 2006), where rare members create a long tail in the frequency count distribution curve of a sample (Bunge & Barger, 2008). One of the ideas to overcome this problem as much as possible is to combine statistics with heuristics, rather than only using a single coverage-‐based nonparametric richness estimation method for approximation. CatchAll (Bunge, 2011), a recently developed method, is a precursor to this approach.
recommendations along with confidence intervals, goodness-‐of-‐fit estimations and
standard errors for researchers to investigate and select. It is the first application to carry out parametric species richness estimation this way and being used by The International Census of Marine Microbes (ICoMM, http://icomm.mbl.edu), and various software
packages designed to study microbial communities such as MOTHUR (Schloss et al., 2009) and QIIME (Caporaso et al., 2010b).
Species Diversity Assessment
Diversity indices, generally, aim to provide a statistic about the distribution of different types of objects in a set. Shannon-‐Wiener Index and Simpson's diversity index (Simpson, 1949) are two widely used indices within ecology to measure species diversity in an environment, and serving microbial ecology for the same purpose, despite the tremendous difference in observation size between conventional ecology and microbial ecology.
Shannon index is more sensitive to changes in abundance of rare OTUs (Hill, Walsh, Harris, & Moffett, 2003) compared to other diversity indices including Simpson's, and is
considered a better general diversity index. Since neither of these indices considers the species richness of other samples and they are biased with the sample size, comparability of these measurements among different samples is very limited. But it is a very common practice to compare microbial communities to each other with respect to Shannon's diversity index.
Rarefaction Curves
Rarefaction is yet another statistical technique that has been used within various
expected number of species versus the total number of individuals in a sample. One of the uses of rarefaction in conventional ecology was to predict whether two samples might be sampled from the same environment (Simberloff, 1978). A somewhat useful and
concurrent utilization of rarefaction curves in microbial ecology is to estimate whether the minimum feasible sample has been met; in order to cover most of the diversity in a given environment by answering how many more OTUs would have been observed if sample size were larger. Rarefaction curves are expected to reach a horizontal asymptotic convergence, which would indicate that increasing sample size would not have revealed more OTUs, and therefore it could be argued that environment was sampled sufficiently.
Beta Diversity Analyses
Beta diversity analyses are useful to exhibit patterns in a data set that would otherwise be missed. Microbial ecologists struggle to make sense of the massive and complex data extracted from environmental samples using various multivariate analysis methods that have become standards of the field.
Here in this part, some of those methods are going to be explained briefly, namely: Clustering, Principle Coordinate Analysis and Correspondence Analysis. Ramette's survey (Ramette, 2007) would be a suitable suggestion for a more comprehensive review of available methods.
Clustering
variation, but also maximizing inter-‐group variation so that every group would be composed of data that present similar characteristics.
Depending on the type of data, various types of clustering algorithms are popular in different fields. For microbial ecology, where OTUs are believed to branch out from common origins based on their phylogenetic distribution, hierarchical clustering algorithms seem to be more popular to explain sample similarities than partitional clustering algorithms.
Hierarchical clustering is a clustering approach where hierarchies of clusters are built based on distances between pairs of objects. Complete-‐linkage is one of the ways for mediating the order of clusters to be merged in an agglomerative way. This is achieved by calculating distances between clusters via distances between farthest objects in two clusters (Levcopoulos, 1998). It is the most common practice to perform hierarchical cluster analysis of microbial communities. Results of complete-‐linkage clustering are usually shown as tree diagrams (dendrograms), as it is a very standard way of visualizing and communicating relationships between groups of samples.
The anticipated outcome of a successful clustering is an accurate description of the underlying structure of samples based on the relationships of components that assemble them. Naturally, relationships between those components are subject to the chosen way of computing the distance between them.
which can be treated as an n-‐dimensional feature vector from the contingency table, where
n is the number of different OTUs in all samples. A distance matrix can then be populated from Euclidian distances between these vectors and used for clustering analysis and visualization. One big problem with this method arises from the fact that phylogenetically very similar OTUs and phylogenetically very distinct OTUs contribute equally to the
distance between samples. This may result in missing subtle differences during the cluster analysis. For instance, the distance between two communities that have different but phylogenetically very closely related OTUs may not be smaller than a third community that has different, and also phylogenetically very distinct OTUs than the first two communities, and this may result in an unrealistic portrayal of their relative overall association.
One other way to compute distances between samples relies on the phylogenetic inference. Phylogeny provides better resolution for asserting the resemblance or the
magnitude of diversification between communities more accurately (Martin, 2002). UniFrac (Lozupone & Knight, 2005; Hamady, Lozupone, & Knight, 2010), a relatively new method that allows the computation of differences between microbial communities based on phylogenetic information, has become one of the standard metrics for comparing
investigating the statistical significance of clustering results with Monte Carlo simulations is a common approach for comparing different environments.
Principal Coordinate Analysis
Principal coordinate analysis (PCoA) is a multi-‐dimensional scaling method that makes it possible to visualize a distance matrix in a two or three-‐dimensional Cartesian coordinate system by choosing the orthogonal axes ordered to explain maximum variation between objects.
PCoA is a popular way to exploit UniFrac results that are stored in a distance matrix in order to visualize distances between samples based on their overall phylogenetic profiles. Since distances between the objects on the projection are expected to be reflective of the distances within the matrix, PCoA is a handy method to understand and communicate comparison results.
Correspondence Analysis
CHAPTER II
As discussed in the previous chapter, advances in sequencing technologies that can utilize 16S rRNA gene made deep exploration of microbial communities in environmental samples easy and affordable.
Also the correlations between human microbial community composition and health conditions generated even a greater interest in analyzing microbial communities.
Due to the large amount of sequence information associated with PCR amplification and pyrosequencing of 16S rRNA genes from the microbial communities, a variety of statistical methods and extensive computational aid is mandatory for the analysis of the data. While sequencing becoming more and more affordable, most of the available software pipelines remained arduous to be utilized by people who are not computer experts and required researchers to invest a substantial amount of time to analyze their own sequences.
The primary goal of the work that is going to be presented in this chapter was to bring the analysis of large amounts of microbial community sequence data within the reach of scientists who have only basic computer skills and to create an extensible framework where new methods can be incorporated and applied to existing data easily.
A Framework for Analysis of Metagenomic Sequencing Data
There are several methods available to understand and compare microbial community structures in samples from different environments through 16S rRNA gene sequence data. However, most of these methods are not designed to manipulate large high-‐throughput pyrosequencing data. One solution that is being employed by researchers in the field is to prepare individual scripts in order to manipulate large sequencing files for each analysis, which requires extensive programming skills and experience to maintain. Another solution is to rely on more general approaches and to use online tools and/or pipelines to perform basic analyses and tests on data, which introduces another set of caveats that are going to be addressed in the Motivation subsection. The framework that is going to be presented in this section is designed to overcome many of the challenges of metagenomic sequencing data analysis and to provide researchers an easy way to analyze and interpret their data with a lot of visualization capabilities.The framework was reported in a paper titled "A Framework for Analysis of
Metagenomic Sequencing Data" (Eren, Ferris, & Taylor, 2011) in The Pacific Symposium on Biocomputing 2011, Hawai'i. It is an open source project and licenced with General Public Licence. The source code is available at a repository hosted by GitHub:
https://github.com/meren/viamics
Motivation
benefits and their limitations. Online ribosomal sequence analysis applications and
pipelines, such as the Ribosomal Database Project (RDP) pipeline (Cole et al., 2009) or the online tool chain of GreenGenes (DeSantis et al., 2006), require researchers to upload their data over the Internet and work using web interfaces that are designed to be easy to operate. However, online analyses usually have stringent limitations on the number of sequences that can be analyzed (or number of runs, or number of permutations). This is primarily due to the fact that scarce resources, such as CPU time, memory size and network bandwidth, must be shared by many researchers in any centralized approach. Another limitation of this approach is that the software cannot be customized and enhanced for specialized analysis since it is running on another group’s server.
On the other hand software that can be downloaded and run locally such as MOTHUR (Schloss et al., 2009) and QIIME (Caporaso et al., 2010b), permits researchers to use their own computational resources without requiring them to upload their data to another server. However, since most of these applications necessitate the use of command line interfaces to perform function calls, the learning curve for these tools is steep and a significant investment of time is required to learn and operate them.
Another aspect of available 16S rRNA analysis software that limits its utility is the “pipeline” approach. Pipeline approaches are a model of computing where a set of applications are connected to each other such that output from one application becomes input to one or more applications in the subsequent stage. A pipeline approach is not an efficient structure for an application that is designed to analyze sequencing data.
need to be re-‐allocated or re-‐computed at every stage of the pipeline. This redundancy is not efficient use of computational resources and negatively impacts overall performance. In addition, the process of file upload, analysis and download, which may be repeated at different stages, is time consuming since the user must wait for output and must often upload results again for the next stage of analysis. Lastly, the preponderance of
intermediate results from different stages of the pipeline that the user must manage is a large burden that can easily lead to mistakes due to human error.
It was necessary to design an extensible and easy-‐to-‐use software framework that is liberated from these issues as much as possible by offering a hybrid solution.
During its development, the framework has been tested and used by microbial
community researchers studying the microbiota associated with various diseases such as bacterial vaginosis and necrotizing enterocolitis. Researchers using the framework were empowered to analyze their own samples, test hypotheses, and produce publication quality figures in order to communicate their results.
Technical Features
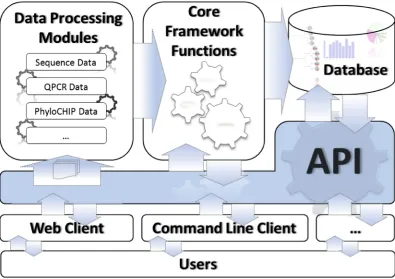
Figure 1. Architectural overview of the framework.
Figure 1 shows an architectural overview of the framework with two major
components: A multi-‐threaded server application that runs in the background performing data processing and core framework functions and interfaces for users to interact with the server.
Server
The server performs all manner of computational tasks. The multi-‐threaded design of the server allows it to run multiple analyses concurrently and handle queries
both the graphical, user-‐friendly manner, or invoked by scripts for automated analysis of large numbers of data sets.
The server has more than one data processing module, and a set of core functions that is separated from the data. This modularity allows server’s core functions and analysis capabilities to be extended for different types of inputs, such as quantitative real-‐time PCR data.
Client
Any client that can communicate via UNIX domain socket or TCP/IP protocols can query and submit tasks to the server through the API. The default client of the framework is a set of Django (http://www.djangoproject.com) powered web interfaces. The web client allows users to connect to and use the framework via their web browser. Thus, they can interact with the default client of the framework using any operating system and Internet browser they choose. This separation also makes scaling easy: it is possible to host the framework on a computer in a local network for a group of researchers to use, it is also possible to use it on a personal computer.
Limitations
more intricate population comparisons based solely on sequence similarity may be possible.
When this dissertation was being written, several biological researchers were using the framework for sequence data analysis, statistical comparison and visualization purposes for a number of active research projects. The most demanding project that analyzed on the framework was consisted of 166 samples with more than 2 million sequences.
It is also important to note that the classification of sequence data is independent and orthogonal to the downstream analysis and visualization tools. In fact, any data set that contains names and associated abundance values can be slipped into the framework and processed through the downstream analysis and visualization. As a concrete example of this, a facility for quantitative PCR data was implemented. Quantitative PCR results can be loaded into the framework and analyzed in a similar manner to classified 16S rRNA sequencing data.
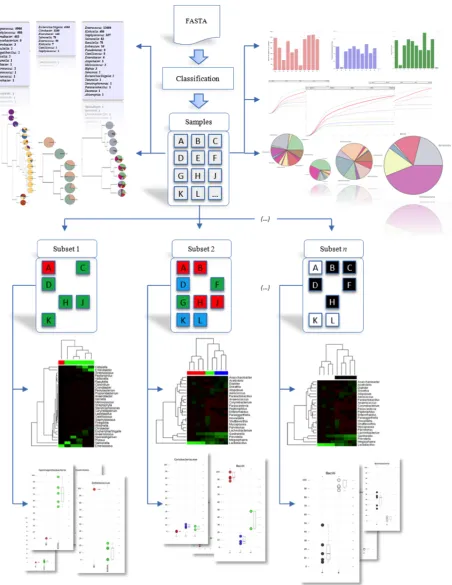
Workflow
Ease of use and extensibility were the key design concerns for the framework. Hence, most of the analysis tasks were performed on the framework without requiring any a priori knowledge to be provided by the researcher. The basic workflow of the framework for a sequence analysis is illustrated in Figure 2. Readers are also encouraged to visit