Print ISSN: 2383-451X Online ISSN: 2383-4501 Web Page: https://jpoll.ut.ac.ir, Email: [email protected]
Preparation and Characterization of Nano-lignin Biomaterial to
Remove Basic Red 2 dye from aqueous solutions
Azimvand, J., Didehban, Kh*. and Mirshokraie, S.A.
Department of Chemistry, University of Payame Noor, P.O.Box 19395-3697, Tehran, Iran
Received:05.10.2017 Accepted: 20.11.2017
ABSTRACT: The present study prepares alkali lignin (AL) via acidification of black liquor, obtained from a pulp and paper factory. The average molecular weight of AL (equal to 2,530 g/mol) has been determined with gel permeation chromatography. AL has been modified by ethylene glycol, while lignin nanoparticles (LN) has been prepared through acid precipitation technology, their size being assessed by means of DLS to show that the average diameter of the nanoparticles at pH = 4 has been 52.7 nm. Afterwards, it has used AL and LN to remove Basic Red 2 (BR2) from aqueous solutions. The absorbent structures and morphologies of AL and LN have been investigated using SEM, and FT-IR spectroscopy. The optimal conditions for the absorption of AL and LN, using 0.1 gr of the absorbent, include 100 min of duration, at pH of 7, and an initial dye concentration amounting to 100 mg/L. Furthermore ,the absorption amount has been mathematically described as a function of experimental parameters, modeled by means of
Response Surface Methodology (RSM) . A central composite design (CCD) has been
applied to evaluate the impacts of four independent variables .Optimum absorption values, obtained via empirical methods, completely match with the values, calculated by the program called Design-Expert. Both absorbent AL and LN show agree with Langmuir Isotherm with maximum absorption capacities of AL and LN being 55.2 mg/gr and 81.9 mg/gr, respectively. The experimental results show that both absorbent LN and AL follow both pseudo-second kinetic and the intraparticle diffusion models.
Keywords: Nanoparticles, Polymer, Absorbent, Natural compound, Cationic dye.
INTRODUCTION
An increase in color reproduction through the use of dyes along with diverse applications of dye throughout the world has resulted in huge production of wastewater, in turn leading to dangerous pollution (Kaur et al., 2007). Many substances in dye wastewater are toxic and carcinogenic (Gong et al., 2005); therefore, several strict rules have limited the government to remove wastewater, containing organic compounds, prior to discharge.
* Corresponding Author, Email: [email protected]
adsorption techniques, which utilize natural materials, are highly regarded as being effective to a large extent (Amin et al., 2008).
Adsorption processes are chemical processes that have advantages to other waste technologies: They are cheap, accessible, and capable of treating dye in high concentrations .In order to bleach the dyes, they use a variety of natural and synthetic absorbents, which are generally environmentally friendly and cheap ,have high absorption capacity, lack toxicity, and cause few problems during the final desorption phase (Mohan et al., 2002; Nigam et al., 2000; Crini et al., 2008; Batzias et al., 2007; Bulut et al., 2008; Mall et al., 2005).
After cellulose ,lignin is the second most abundant natural polymer, containing phenylpropane structural units with carbon– carbon and ether connections. It is an amorphous and super complex structure, yet to be fully investigated (Sixiao et al., 2015; Daliang et al., 2017; Sarocha et al., 2018; Camilla et al., 2017). Lignin constitutes 15– 36% of the weight of wood; thus, its sources are abundant and suitable for use in wood and paper industry (Göran et al., 2015). It also has aromatic and aliphatic parts, containing many functional groups, including phenolic, hydroxyl, carboxyl, benzyl alcohol, methoxy, and aldehyde ones (Guo et al., 2008; Daliang et al., 2017). Recently, alkali lignin (AL), cellulose, and hemicellulose have been proven to have characteristics, suitable for adsorption and ion exchange. However, the absorption capacity of lignin macromolecules is relatively low; therefore, it is essential to conduct chmical modification of lignin from natural material.
Some natural nanoadsorbents are highly capable of absorbing materials, yet only a limited number of researches have dealt with lignin absorbent and their derivatives for dye removal, so far, e.g. in 2012 Camille et al. prepared LN, using the solution-deposition method, wherein the
structures of the nanoparticles remained almost unchanged (Camille et al., 2012).
Camille et al. used chitosan-polyacrylic acid/montmorillonite nanocomposites to adsorb methylene blue, only to find out that the nanotechniques effectively eliminated more than 30% of the dye (Camille et al., 2012). Yuan, in 2016, absorbed methylene
blue, using alginate-graphene
2.610-6 mol/g at 50 °C ( ibid. .)Adsorptive removal of hazardous anionic dye “ Congo red ”from wastewater, was also investigated, using waste materials and recovery via desorption. The adsorption characteristics and dye removal efficiency of the adsorbents got determined by investigating factors such as the impact of pH, effect of dye concentration ,the amount of the adsorbents , contact time ,and temperature ( Mittal et al., 2009 .)Finally, synthesis and characterization of alumina-coated carbon nanotubes and their application for lead removal were investigated by Mittal et al .(2009) too.
The purpose of this research is to prepare LN through acid precipitation technology for the removal of BR2 cationic dye from aqueous solutions. The study has increased adsorption capacity and removal efficiency of BR2 by addinng to the surface area of LN. In addition, it aims at studying the pH, adsorbent dosage, dye concentration, and contact time as factors in the absorption process, in which Langmuir ,Freundlich ,and Temkin models are examined. Also ,pseudo-first order, pseudo-second order, and intraparticle diffusion have been investigated as absorption kinetics.
MATERIALS AND METHODS
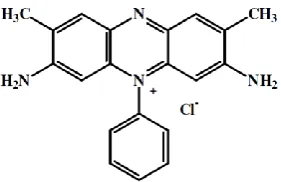
AL was prepared by acidifying black liquor, obtained from the Pars Khuzestan paper factory, Iran. BR2 dye (99.5%), sodium hydroxide (99%), hydrochloric acid (wt% 36), and ethylene glycol (98%) were purchased from Merck, Germany, and Ethanol (99.9%) was prepared at Bidestan, Iran. Figure 1 and Table 1 show the chemical structure and features of the BR2 dye.
Fig. 1. Chemical structure of Basic Red 2 dye.
Table 1. Chemical and physical characteristics of Basic Red 2 dye (Xiao-Feng et al, 2014)
Basic red 2 50240 Basic red 2 Safranin-O, Safranin T
Safranin Basic
5.45 Red 517 C20H19N4Cl
350.85 C.I. name
C.I. number Common name
Other name Class Ionization Aqueous solubility
(%) Colour Absorption maximum
(nm) Chemical formula
Formula weight (g/mol)
Image
Fourier Transform Infrared
Spectroscopy (FT-IR) was employed to determine the chemical structures of the compounds within the range of 400 to 4,000 cm-1, using a Tensor 27 FT-IR spectrophotometer, made by Brucker, Germany. In order to determine the amount of dye absorption, BR2 dye was used and as for the amount of ultraviolet-visible absorption, it was determined by means of
a Model M350 Double Beam
Spectrophotometer (UK). The pH was identified, using a Model Metrohom 827 pH-meter. In addition, a Scanning Electron Microscope (SEM) device (Model LEO 1455VP) made in UK, was employed in order to establish the particle size and morphology of the surface of the absorbent. Gel permeation chromatography (GPC) was performed with a Shimadzu 6-A, made in US6-A, to determine the molecular weight of AL.
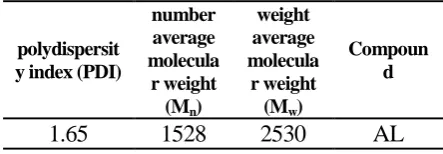
reached a pH of about 7. For purification puroses, lignin was dissolved in relatively warm ethanol (50–60°C) and ethanol-soluble fractions were separated via filtration, with the solid residue being discarded afterwards. The bulk of the ethanol (75%) inside the evaporator got evaporated at low pressure. Distilled water was poured into the remaining solution as well as lignin sediment in a colloidal form. After centrifugation for 10 min at a speed of 4,500 rpm, at room temperature, a considerable amount of purified lignin was obtained (Gupta et al., 2014). Table 2 offers the molecular weight and polydispersity index of the AL, obtained using gel permeation chromatography.
Table 2. Molecular weight of alkali lignin bagasse
Compoun d weight average molecula r weight (Mw)
number average molecula r weight
(Mn)
polydispersit y index (PDI)
AL 2530
1528 1.65
AL (0.28 gr) got dissolved in 50 ml of polyethylene glycol (wt% 0.56), to be stirred for 2 h, after which it was filtered through 0.4-μm filters for purification. Next, hydrochloric acid (0.25 M) was slowly dropped into 45 ml of the filtered solution with a pH of 4, resulting in the formation of Lignin nanoparticles in the solution. Following the centrifugation, the nanoparticles got washed with distilled water and dried under a vacuum at a temperature of 50° C (Gupta et al., 2014). Paunov et al., in 2012, proposed similar mechanisms to produce LN (Frangville et al., 2012).
A stock solution with a concentration of 100 mg/L was prepared and maintained at a temperature of 4°C, while all experiments were carried out with 100 ml of dye at a temperature of 25°C on a shaker at 70 rpm. The samples got filtered after each step so that dye concentration could be measured, and the absorption rate was determined, using ultraviolet-visible absorption
spectroscopy at a wavelength of 517 nm. Each sample was tested three times, the averages of which were recorded. The effects of various factors, including pH, contact time, adsorbent dosage, and initial dye concentration, were evaluated in terms of absorption percentage and capacity, with the amount of dye, adsorbed at equilibrium (qe(mg/gr)), along with dye removal efficiency (R%) being determined by means of Equations (1) and (2), respectively (Fanchiang et al., 2009; Madrakian et al., 2012).
e 0 e
q C C V / M (1)
0 e
0%R100 C C / C (2)
C0 and Ce represent the initial and final concentrations of dye in the solution (mg/L), respectively. V is the volume of the solution (L); M, the adsorbent mass (gr); and qe, the amount of dye, adsorbed at equilibrium (mg/gr).
Response Surface Methodology (RSM), a collection of statistical and mathematical techniques, was successfully employed to oth determine the effects of several variables and optimize the processes .Its main advantage is in the fewer experimental trials needed by this method to evaluate multiple variables and their interactions.
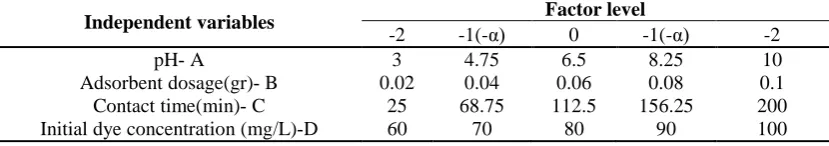
RSM is a statistical method that employs quantitative date from appropriate experimental design to determine optimal conditions ; therefore ,here it was used with a central composite design (CCD )in order to determine the optimum conditions for removal of Basic Red 2 dye from aqueous solutions with LN. The experimental factors were ascertained on the basis of the preliminary experiments ’results.
Table3.Independent variables and their levels,used in the response surface design
Independent variables Factor level
-2 -1(-α) 0 -1(-α) -2
pH - A 3 4.75 6.5 8.25 10
Adsorbent dosage(gr) - B 0.02 0.04 0.06 0.08 0.1 Contact time(min) - C 25 68.75 112.5 156.25 200 Initial dye concentration (mg/L)-D 60 70 80 90 100
The experimental data were analyzed by means of response surface regression procedure to fit the following quadratic model ,providing regression coefficients . The full quadratic model , used in the response (Y) , was i , described as the following polymeric E.3.
4 4
2 0
1 1
4 5
1 j i 1
q mg / gr( ) βiXi+ βiiXi +
βijXij
i i
i
(3)
where ,𝛽 ,0 , , and are the regression coefficients for intercept, linear, quadratic, and interaction terms, respectively ;while and are the independent variables.
The Statistical Analysis System was the computer program, used to conduct the analysis of variance (ANOVA) and response surface studies.
on coefficients of individual linear, quadratic, and interaction terms were determined, according to the analysis of variance with the regression coefficients used afterwards to do statistical calculation, thus generating dimensional and contour maps from the regression models. The RSM was applied to the experimental data, using a commercial statistical package, Design-Expert, version 9.0.6 (Minneapolis, USA).
The point zero charge (pHpzc), characteristic of AL and LN, was determined, using solid addition method (Yufang et al., 2016). The experiment was conducted in a series of 100 mL, glass-stoppered flasks, each filled with 20 mL of potassium nitrate, 0.1M solutions of
different initial pH values (pH0), and 0.20 g of AL or LN. The pH values of KNO3 solutions were adjusted to 2-10 with 0.1M sodium hydroxide and diluted hydrochloric acid. The suspensions were then sealed and shaken for 24h at a speed of 100 rpm and a temperature of 24°C. The final Ph values (pHf) of the supernatant liquid were noted. The difference between the initial and final pH values was plotted against pH0 and the point of intersection of the resulting curve with the abscissa giving .
RESULTS AND DISCUSSION
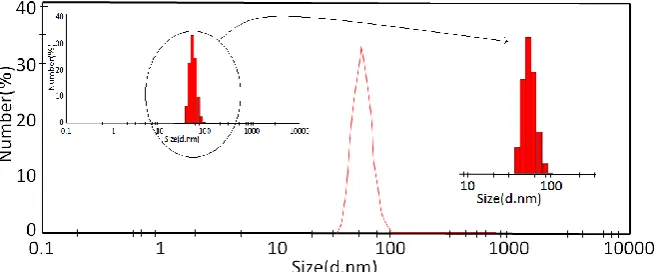
Figure 2 demonstrates the particle size distribution of lignin nanoparticles at pH = 4, as a function of the nanoparticles’ percentage. The AL nanoparticle size at this pH rate was estimated to be between 40 nm and 60 nm, with the average diameter of the nanoparticles determined as 52.7 nm. Li et al., in 2014, estimated the average diameter of AL nanoparticles, produced by nitric acid and pH reductions to be 278 ± 13 nm (Yuanyuan et al., 2014).
Fig. 2. Particle size distribution of Nano-lignin.
Fig. 3. SEM images of AL and LN before and after the absorption of BR2 dye
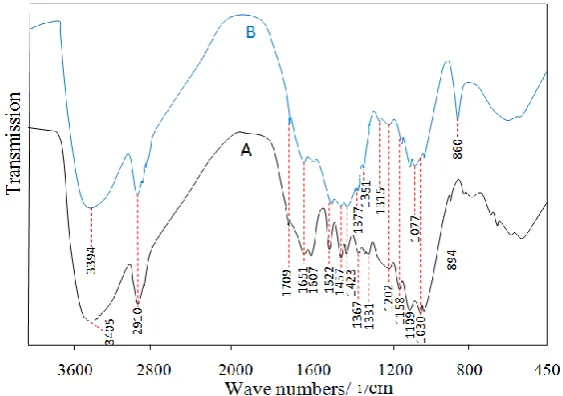
Figure 4 shows FT-IR spectra of AL and LN, showing that the chemical structure changed within the nanoparticle-creation process. Table 4 compares the FT-IR spectra of AL and LN and demonstrates the stability of phenol propane rings in nanoparticles’ synthesis. The weak peak at 1,709 1/cm indicates good vibration of
1/cm, respectively; furthermore, the absorption peak at 1,158 1/cm was a result of -C-O vibration in para-hydroxyphenyl (H), more intense for LN than AL, and was attributed to the interaction of -OH phenolic groups in H units. In the AL compound, The peak at the 3,405 1/cm area was related to the vibration of -OH bonds, which thanks to the connection with ethylene glycol in LN moved to 3,394
1/cm, growing in its intensity. The increased peak intensity at 1,077 1/cm was attributed to overlapping -C-O vibrations within the connection of carboxylic acid groups with ethylene glycol as well as -C-H vibrations within the connection with alcohol type 2. In 2016, Zhang et al. gave similar information about extracting lignin from rice (Shoujuan et al., 2016).
Fig. 4. FT-IR spectra of (a) Alkali lignin and (b) Nano-lignin.
Table 4. Evaluation of FT-IR spectra of lignin and Nano-lignin compounds.
Absorption region )1/cm( Origin of absorption bands
LN AL
3394 3405
Stretching vibration of O-H in aliphatic and phenolic compounds
2910 2910
Stretching vibration of C-H bonds in CH3 groups
1709 1709
Stretching vibration of -C=O in carboxylic acid groups (non-conjugated)
1651 1651
Stretching vibration of -C=O(conjugated)
1606 1607
Stretching vibration in the aromatic ring
1517 1522
Stretching vibration in the aromatic ring
1457 1457
Bending vibration of C-H bonds in CH3 groups
1421 1423
Stretching vibration in the aromatic ring
1377 1367
O-H Bending vibration of phenolic and non-ether, stretching vibration in the S ring
1351 1331
Stretching vibration in the G ring
1315
-
Stretching vibration of the bond between S and G
1202 1202
Stretching vibration of C-O in alcohol type 1, C-O stretching vibration of S and G in the aromatic ring
1158 1158
Stretching Vibration of C-O in phenolic and carboxylic acid hydroxyls
1109 1109
Stretching vibration of C-H in units S, G, and H
1077 1030
Figure 5 shows the optimal pH. As it can be seen BR2 dye is stable within pH range of 2–10 (Yuzhong et al., 2013; Caner et al., 2009; Mahmoud et al., 2013). LN dissolves in an alkaline environment at a pH rate, greater than 10, and loses its efficiency at a pH rate, below 3, as it has an aggregate structure (Camille et al., 2012). Thus, according to LN stability, the absorption of BR2 dye was evaluated at a pH range between 3 and 10.
As shown in Figure 5 (b), the isoelectric points ( ) of AL and LN compounds
were 5.3 and 5.6, respectively. The increase of in LN composition was attributed to increased polarization and the number of electron donor groups on the surface of nanoparticles. As shown in Figure 5 (a), a decrease in pH, from to 2, reduced both absorption capacity and dye removal percentage; since by dropping the pH, the concentration of H+ grew thus quite many -NH2 functional groups were protonated on the dyes quantitatively, unable to create hydrogen bonds.
At , the compounds had no electric charge; however, at , the electrical charge was negative due to the loss of acidic hydrogen in the carboxylic acid groups of lignin and nanolignin. By introducing electrostatic attraction with BR2 dye, the absorption capacity and dye removal percentage increased. In a pH range of 5–6, the adsorption capacity and dye removal percentage soared dramatically. The maximum adsorption capacities of AL and LN occurred at a pH = 10. This significant increase in the absorption capacity of LN was caused due to the widespread presence of ethylene glycol polar compounds in lignin macromolecules, which through creation of nanoparticles, and thereby LN, increased the surface area.
In addition, the percentages of dye removal in AL and LN at pH = 10 were 38% and 82%, respectively. The results showed that the performance of nanotechnology in LN preparation was twice more effective.
The adsorption data at pH = 10 demonstrate the significant effect of carboxylic acid groups on the creation of electrostatic attraction within absorption process of. At pH > 7, the degree of acid dissociation dropped, hence few carboxyl groups got involved in absorption. Therefore, the maximum change occurred at a pH rate, between 5 and 7.
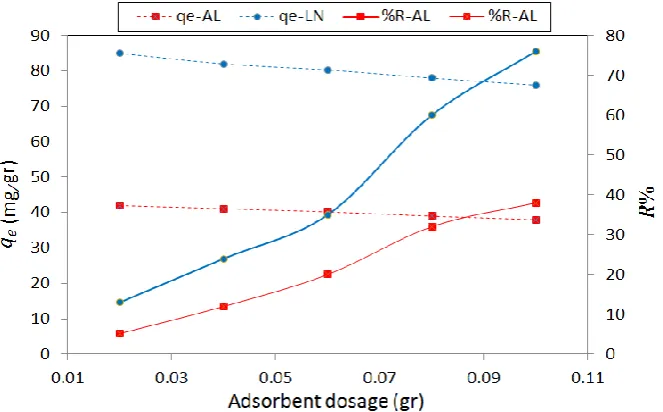
Having investigated the impact of adsorbent dosage on BR2 dye adsorption (Figure 6), it was revealed that increases in the amount of AL and LN adsorbents raised the percentage of BR2 dye removal and optimum adsorbent dosage for both AL and LN compositions was set as 0.1 gr. The percentage of BR2 dye removal for both AL and LN were 38% and 76%, respectively, in optimal conditions. In other words, the percentage of dye removal rose, which was attributed to the increased surface area of LN. Further, by increasing the amount of absorption, the absorption capacity reduced slightly, since lower amounts of the absorbent lead to greater competition among dye molecules to get connected to the absorbent (Gomez et al., 2007; Zhu et al., 2007; Amin et al., 2008). Thus, the absorption capacities of AL and LN compounds, while using 0.02 gr of the absorbent, were 42 mg.g-1 and 85 mg.g-1, respectively. By increasing the amount of the absorbent to 0.1 gr, the absorption capacities of AL and LN compounds fell.
al., 2000; Crini et al., 2008; Batzias et al., 2007; Bulut et al., 2008). The optimal time
for the absorbance of dyes is estimated to be about 100 min.
Fig. 5. (a) Effect of pH on BR2 dye removal (dye concentration = 100 mg/L, adsorbent amount = 0.1 gr, contact time = 100 min), and (b) determination of isoelectric point
Fig. 7. Effect of contact time on BR2 dye removal (dye concentration = 100 mg/L, pH = 7, adsorbent amount = 0.1 gr)
The effect of initial dye concentration on absorption capacity and percentage of dye removal was investigated, using AL and LN adsorbent (Figure 8). With higher initial dye concentrations, greater amount of dye interacts with the surface of the absorbent, thereby increasing the absorption capacity. In addition, by
increasing the concentration of dye, the number of dye molecules per unit area ascends, while the percentage of BR2 dye removal descends. Therefore, by increasing the dye concentration from 60 mg/L to 100 mg/L, the percentage of BR2 removal in AL and LN compounds declined from 47% to 38% and 82% to 76%, respectively.
Adsorption isotherms provide equations to describe the adsorption equilibrium between solid and fluid phases (Shoujuan et al., 2016). As such, Langmuir and Freundlich Equations are shown in Equations (4) and (5), respectively (Yuzhong et al., 2013).
e e
max L
e max
C C
1 / q .K
q q
(4)
e F e
Ln q Ln K 1/ n Ln C (5)
where, KL(L/gr) represents the Langmuir isotherm constant and qmax (mg/gr), the maximum absorption capacity, while both n and KF(mg/L) are Freundlich isotherm constants. Also, Ce(mg/L) stands for the concentration of adsorbates after reaching equilibrium in the liquid phase, whereas qe (mg/gr) is the amount of adsorbates in the unit mass of the absorbent.
In the Langmuir model, it is assumed that absorption occurs in a number of homogeneous locations within the absorbent. An essential characteristic of
Langmuir isotherm is a constant and dimensionless parameter, called RL, which can be obtained from Equation (6) (Yuzhong et al., 2013).
L L 0
R 1 / 1 K .C (6)
In which, C0 (mg/L) represents the initial dye concentration in the solution.
Isotherms describe the actions of both adsorbates and absorbents. In the Langmuier model, a layer of dye molecules is absorbed, and the amount of absorption energy is equal in all the surfaces of the absorbent. Absorption bonds in the Langmuir model are assumed to be reversible. In the Freundlich model, however, the surface areas of absorbents are non-uniform, and their absorption abilities differ (Caner et al., 2009). KF represents the absorption capacity and 1/n, the adsorption intensity. Table 5 shows the relations of RL and n with the isotherms. The Temkin isotherm is linear and can be determined via Equation (7) (Caner et al., 2009).
Table 5. Relationship of RL and 1/n with isotherms (Yuzhong et al, 2013)
Langmuier isotherm Freundlich isotherm RL isotherms type n isotherms type
1< RL
Undesirable 1<1/n
Undesirable
=1 RL
Linear =0 1/n
Reversible
1 > RL0 >
Desirable 1 > 1/n >0
Desirable
=0 RL
Irreversible
e t t t e
q B . Ln K B . Ln C (7)
Bt and Kt were determined by the slope and intercept of the curve qe in Ln Ce,.
Figures 9, 10, and 11 illustrate the Langmuir, Freundlich, and Temkin isotherm models, respectively; their data, presented in Table 6. The RL data in Langmuir Model and 1/n in Freundlich Model for both AL and LN absorbents were between 0 and 1. Using Langmuir and Freundlich models, it was assessed that BR2 dye absorption of both AL and LN absorbents was desirable. The correlation coefficient R2 values in AL and LN absorbents turned out to be 0.996 and 0.994 for Langmuir, 0.74 and 0.77 for
Freundlich, and 0.75 and 0.72 for Temkin isotherm, respectively. The greater R2 in both AL and LN absorbents proved that dye absorption followed the Langmuir isotherm. Surface energy absorbents were homogeneous with the maximum adsorption capacity of AL being 55.24 mg/gr and for LN, 81.96 mg/gr in the Langmuir model. Both were close to the experimental values. The large absorption capacity of LN was attributed to the high contact of surface dye with the LN absorbent from nanoparticle processes, which rendered the surface molecules highly porous.
Fig. 9. Langmuir isotherm curve for BR2 dye removal
Fig. 10. Freundlich isotherm curve for BR2 dye removal
Fig. 11. Temkin isotherm curve for BR2 dye removal
Table 6. Effect of Langmuir, Freundlich, and Temkin isotherm on BR2 dye adsorption (dye concentration = 100 mg/L, pH = 7, adsorbent dose = 0.1 gr, contact time = 100 min).
Temkin isotherm Freundlich isotherm
Langmuier isotherm Temp
(°C) Absorbent
type KF R2 Bt Kt
(L/mg) n
1/n R2
RL
KL
(L/g) qe max
(mg/gr) R2
0.1 23.2 0.75 3.63 1.7
0.58 0.746 0.52 0.009 55.24
0.996
2±25 AL
9996.5 6.14 0.72 56.68
10.86 0.092 0.77 0.97 0.0002 81.96
0.987
Table 7. Response surface central composite design and results for qe
Run
Independent variables Response variables
A: pH
B: Adsorbent
dosage
C: Contact
time
D:
Initial dye concentration qe- AL qe- LN
1 6.50 0.06 112.50 80.00 53.25 84.25
2 6.50 0.06 112.50 60.00 52.125 83.125
3 6.50 0.06 112.50 80.00 53.25 84.25
4 6.50 0.10 112.50 80.00 52.75 83.75
5 4.75 0.04 68.75 90.00 51.62 82.7
6 4.75 0.08 156.25 90.00 53.125 84.21
7 6.50 0.06 25.00 80.00 51.25 82.2
8 4.75 0.04 156.25 70.00 52.5 83.53
9 4.75 0.08 68.75 90.00 51.125 82.2
10 6.50 0.06 112.50 80.00 53.25 84.3
11 8.25 0.08 156.25 90.00 56 87.1
12 6.50 0.06 112.50 80.00 53.25 84.2
13 8.25 0.04 156.25 70.00 55.37 86.35
14 4.75 0.08 68.75 70.00 50 81.1
15 6.50 0.02 112.50 80.00 53.75 84.85
16 6.50 0.06 112.50 100.00 54.37 85.4
17 6.50 0.06 200.00 80.00 55.25 86.3
18 6.50 0.06 112.50 80.00 53.25 84.2
19 4.75 0.04 68.75 70.00 50.5 81.48
20 4.75 0.04 156.25 90.00 53.62 84.7
21 8.25 0.04 156.25 90.00 56.5 87.53
22 8.25 0.08 68.75 70.00 52.87 83.88
23 8.25 0.08 68.75 90.00 54 85.1
24 4.75 0.08 156.25 70.00 52 83.14
25 10.00 0.06 112.50 80.00 56.18 87.21
26 8.25 0.04 68.75 70.00 53.37 84.34
27 8.25 0.04 68.75 90.00 54.5 85.53
28 8.25 0.08 156.25 70.00 54.87 85.91
29 6.50 0.06 112.50 80.00 53.25 84.35
30 3.00 0.06 112.50 80.00 51.37 82.39
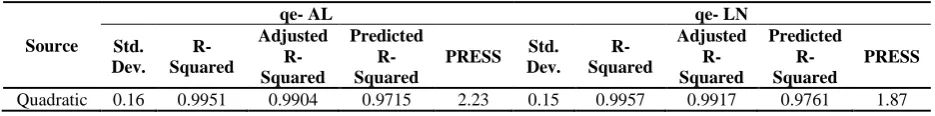
Table 8. R-Squared results for Basic Red 2 dye removal with AL and LN
Source
qe- AL qe- LN
Std. Dev.
R-Squared
Adjusted R-Squared
Predicted R-Squared
PRESS Std.
Dev. R-Squared
Adjusted R-Squared
Predicted R-Squared
PRESS
Quadratic 0.16 0.9951 0.9904 0.9715 2.23 0.15 0.9957 0.9917 0.9761 1.87
Table 8 shows the regression coefficients of the intercept, linear, quadratic ,and interaction terms of the model ,calculated by means of the least square technique and software-proposed quadratic .The “Pred R-Squared” was as close to “ Adj R-Squared ”as one might normally expect .A high R2 indicates that
the variation could be accounted for by the data satisfactorily fitting the model.
qe-AL = 41.65224 + 0.30553 pH -5.98810 Adsorbent dosage +0.025453 Contact time +0.091699 Initial dye
concentration -0.017857 pH. Adsorbent dosage +2.35413E-017 pH. Contact time+1.07143E-004 pH. Initial dye concentration +2.23631E-015 Adsorbent dosage. Contact time+3.12500E-003 Adsorbent dosage. Initial dye concentration +4.47261E-018 Contact time. Initial dye concentration +0.035646 pH2 -55.20833 Adsorbent dosage2 -1.15374E-005 Contact time2 -2.27083E-004 Initial dye concentration2 (8)
qe-LN = 73.10107+ 0.21031 pH -5.54613Adsorbent dosage +0.027050Contact time +0.083905Initial dye concentration -8.68849E-014 pH. Adsorbent dosage -4.89796E-005 pH. Contact time +7.85714E-004 pH. Initial dye concentration +1.42857E-003 Adsorbent dosage. Contact time -0.056250 Adsorbent dosage. Initial dye concentration -1.71429E-005 Contact time. Initial dye concentration + 0.038605pH2 -16.92708 Adsorbent dosage2 -1.00680E-005 Contact time2 -1.61458E-004 Initial dye concentration2 (9)
The statistical significance of the second order model equation was checked with an F-test (ANOVA) and the related data can be seen in Table 9. The regression model for Basic Red 2 dye removal was highly significant with a satisfactory value of determination; moreover, the Model F-value implied that the model was significant, indicating that the model equation as expressed in Eq. (8) and Eq. (9) provided a suitable model to describe the response of the experiment, pertaining to percentage recovery. All these statistical parameters showed the models’ reliability.
The predicted values, calculated from Eq. (2) and Eq. (3), were in very good agreement with the experimental values, as shown in Figure 12. Hence, this quadratic model was well suited for this experimental set up.
Perturbation plot shows the comparison among all factors at a selected point in the considered design space with Figure 13 illustrating the perturbation plot for Basic Red 2 dye removal.
Dye removal response was drawn by changing only one factor over its range, while the other factors remained constant. The plot demonstrated the effect of all factors at a central point in the design space.
Not all factors indicated a positive effect on dye removal .The relatively flat line of Adsorbent Dosage shows lower effect of this factor on dye removal in the design space, which can be understood from Eq . (3) and Table 4.
pH=7
Adsorbent dosage= 0.1 gr Contact time= 100 min
Initial dye concentration= 100 mg/l
qe-AL = 52.8 mg/gr qe- AL obtained from the software
pH=7
Adsorbent dosage= 0.1 gr Contact time= 100 min
Initial dye concentration= 100 mg/l
qe- LN = 84.8 mg/gr qe- LN obtained from the software
Conditions obtained from empirical data
Table 9. ANOVA results for Basic Red 2 dye removal with AL and LN
Source
qe- AL qe- LN
Sum of Squares
Degrees of freedom
Mean
Square F Value
p-Value
Prob > F
Sum of Squares
Degrees of freedom
Mean
Square F Value
p-Value
Prob > F
Model 77.82 14 5.56 215.66 < 0.0001 78.07 14 5.58 247.59 < 0.0001
A-pH 44.31 1 44.31 1719.04 < 0.0001 43.52 1 43.52 1932.54 < 0.0001
B-Adsorbent Dosage 1.50 1 1.50 58.00 < 0.0001 1.36 1 1.36 60.53 < 0.0001
C- Contact time 24.00 1 24.00 931.12 < 0.0001 24.68 1 24.68 1096.04 < 0.0001
D-Initial Concenteration
BR2 7.59 1 7.59 294.61 < 0.0001 8.04 1 8.04 356.94 < 0.0001
AB 6.250E-006 1
6.250E-006 2.425E-004 0.9878 0.000 1 0.000 0.000 1.0000
AC 0.000 1 0.000 0.000 1.0000
2.250E-004 1
2.250E-004
9.990E-003 0.9217
AD 5.625E-005 1
5.625E-005 2.182E-003 0.9634
3.025E-003 1
3.025E-003 0.13 0.7191
BC 0.000 1 0.000 0.000
1.0000
2.500E-005 1
2.500E-005
1.110E-003 0.9739
BD 6.250E-006 1
6.250E-006 2.425E-004 0.9878
2.025E-003 1
2.025E-003 0.090 0.7684
CD 0.000 1 0.000 0.000
1.0000
9.000E-004 1
9.000E-004 0.040 0.8442
A2 0.33 1 0.33 12.68 0.0028 0.38 1 0.38 17.02 0.0009
B2 0.013 1 0.013 0.52
0.4824
1.257E-003 1
1.257E-003 0.056 0.8164
C2 0.013 1 0.013 0.52 0.4824 0.010 1 0.010 0.45 0.5115
D2 0.014 1 0.014 0.55
0.4703
7.150E-003 1
7.150E-003 0.32 0.5815
Residual 0.39 15 0.026 0.34 15 0.023
Lack of Fit 0.39 10 0.039 0.32 10 0.032 9.39 0.0117
Pure Error 0.000 5 0.000 0.017 5
3.417E-003
Cor Total 78.21 29 78.41 29
Fig. 13. Pertubation plot for rate response (for A: pH, B: Adsorbent Dosage, C: Contact time, and D: Initial Concenteration BR2 )
Table 10. Reported maximum adsorption capacities for BR2 adsorbed onto different adsorbents.
Reference Adsorption capacity
(mg/gr) Adsorbent
Present work 81.9
Nano-lignin
Kayode et al, 2014 16.23
Kaolinite clay (nanoparticles)
Malekbala,et al, 2012 43.47
Mango Seed
Chowdhury et al, 2012 37.97
NaOH-treated rice husk
Samaka, 2014 66.22
Iraqi porcellanite
Table 10 compares the adsorption capacity, derived from cationic dye absorption via LN absorbent, with the one, found in other studies. According to the table, the highest adsorption capacity was observed in the studied absorbent.
occured from inside a layer and was proportional to the number of unoccupied locations in the surface of an adsorbent. The linear pseudo-first-order kinetic model is shown in Equation (10) (Ho et al., 2005).
e t
e 1Ln q q Ln q K t (10)
In which, qe (mg/gr) represents the amount of dye adsorbed at equilibrium, qt (mg/gr) shows the amount of dye adsorbed at time t, and K1(1/min) stands for constant first-order kinetics in equilibrium.
The pseudo-second-order kinetic model indicates that the chemical absorption process is a retarder stage. It is shown in equation (11) (Gil et al., 2011).
2
t 2 e e
t 1 t
q k .q q
(11)
where K2(gr/mg.min) represents constant first-order kinetics in equilibrium.
In the intraparticle diffusion model, adsorption is carried out in three distinct phases: Initially, the adsorbate molecules are transferred from the soluble phase to the adsorbent surface. In this step, adsorbate molecules must pass the film solvent, surrounding them, and is known as the penetration process. Afterwards, the absorbed molecules are transported to
places with porosity in the adsorbent. This step is called the influence on porosity. Finally, the particle attaches to the surface of the absorbent and is absorbed. The intraparticle diffusion model is presented in Equation 12 (Siddique et al., 2009).
1/ 2
t p
q K .t C (12)
where, Kp (mg/gr.√ ) is the intraparticle diffusion constant and C (mg/gr), Intraparticle diffusion constant. Using the curve qt in √ , both Kp and C were determined.
K, qe, and R2 in the pseudo-first-order and pseudo-second-order kinetic models and Kp and C in the intraparticle diffusion model (Table 11) are demonstrated in Figures 14 ,15 ,and 16, respectively. The correlation coefficients (R2) in the pseudo-second-order and intraparticle diffusion kinetic models are similar, being greater than the correlation coefficient in the pseudo-first-order kinetic model. Therefore, the bleaching process can be described by both pseudo-second-order and intraparticle diffusion models. In the pseudo-second-order model, chemical adsorption affects the connection of BR2 dye to AL and LN absorbents.
Fig. 15. Pseudo- second -order kinetic curve for the removal of BR2 dye.
Fig. 16. Intraparticle diffusion kinetic curve for the removal of BR2 dye.
Table 11. Pseudo-first-order, pseudo-second-order, and intraparticle diffusion kinetic models for BR2 dye adsorption (dye concentration = 100 mg/L, pH = 7, adsorbent dose = 0.1 gr, and contact time = 100 min).
Coefficient C in the intraparticle diffusion kinetic model is nonzero, and the curve does not pass the coordinates’ origin; therefore, the dye concentration and diffusion process are not the only rate-determining steps in dye adsorption. On the contrary, other processes, such as complex formation or ion exchange, are effective for connecting BR2 to AL and LN absorbents and can control adsorption (Gil et al., 2011; Siddique et al., 2009). In the pseudo-second-order kinetic model, the absorption capacities of AL and LN were
47.84 mg/gr and 85.47 mg/gr in the computational results, and 39 mg/gr and 78 mg/gr in experimental results, respectively. The proximity of the experimental and theoretical results shows that the pseudo-second-order kinetic model is appropriate to determine BR2 dye adsorption in both AL and LN.
CONCLUSION
The present study was conducted to assess the efficacy of Nano-lignin as cheap bioadsorbents that are environmentally
intraparticle diffusion model Pseudo-second -order
model Pseudo-first –order
model qe(Exp)
(mg/gr) Temp
(°C) Absorben
t type
C Kp
R2
K2
(1/min) qe(Cal)
(mg/gr) R2
K1
(1/min) qe)Cal)
(mg/gr) R2
12.12 2.74 0.991 0.0009 47.84
0.997 0.03
31.5 0.818
39 2±25
AL
46.13 3.2
0.999 0.0011 85.47
0.998 0.033
42.5 0.846
friendly for the removal of cationic BR2 from aqueous solutions. Results showed that the absorption capacity in LN increased to about 1.5. In this regard, optimum absorption values, using the empirical method, correspond with the values, calculated by the Design-Expert software program.
With the increase of electrostatic attraction ,hydrogen bonding, and surface area ,absorption capacity and percentage of dye removal increased, as well .The presence of polar groups of - COOH to the structure of natural absorbents for creation of electrostatic attraction, was the most important factor to absorb BR2 dye .
Absorption by means of pseudo-second-order and intraparticle diffusion kinetic models for AL and LN absorbents occurred according to the principles of two-stage absorption kinetics. In the first stage, the rate of dye removal was increased with adsorption; in the second stage, dye removal rate declined due to the influence of the porous surface. Thus, LN achieved a suitable absorption capacity and compatibility with the environment and is suitable for the removal of wastewater, containing BR2 dye.
ACKNOWLEDGEMETS
The authors are grateful for the financial support from Vice-Presidency for Science and Technology (Fund for the support of Researchers and Technologists of the Country).
REFERENCES
Bahadir, K. and Korbahti, M.A. (2008). Application of response surface analysis to thepHotolytic degradation of Basic Red 2 dye. Chemical Engineering Journal., 138 (2); 166–171.
Batzias, F. A. and Sidiras, D. K. (2007). Simulation of dye ads orption by beech sawdust as affected by pH. J. Hazard. Mater., 141(7); 66-68.
Bulut, E., Özacar, M. and Şengil, İ. A. (2008). Equilibrium and kinetic data and process design for adsorption of Congo Red onto bentonite. J. Hazard. Mater., 154 (28); 613–622.
Camilla, L., Mike, K. and Tanja, B. (2017). Organosolv extraction of softwood combined with lignin-to-liquid-solvolysis as a semi-continuous percolation reactor. Biomass and Bioenergy., 99(8); 147-155.
Camille, F., Marius, R., Alexander, P., Richter, O., Velev, S. and Paunov, N. (2012). Fabrication of Environmentally Biodegradable Lignin Nanoparticles. ChemPHysChem., 13(5); 4235 – 4243.
Caner, N., Kiran, I., Ilhan, S. and Iscen, C. (2009). Isotherm and kinetic studies of Burazol Blue ED dye biosorption by dried anaerobic sludge. Journal of Hazardous Materials., 165(19); 279-284.
Caner, N., Kiran, I., Ilhan, S. and Iscen, C. (2009). Isotherm and kinetic studies of Burazol Blue ED dye biosorption by dried anaerobic sludge. Journal of Hazardous Materials, 165(32); 279-284.
Chowdhury, S., Mishra, R., Kushwaha, P., Saha, P. (2012). Removal of safranin from aqueous solutions by NaOH-treated rice husk: thermodynamics, kinetics and isosteric heat of adsorption. Asia-Pacific Journal of Chemical Engineering. 7( 2); 236-249.
Crini, G. and Badot, P. M. (2008). Application of chitosan, a natural aminopolysaccharide, for dye removal from aqueous solutions by adsorption processes using batch studies. A review of recent literature. Prog. Polym. Sci., 33(8); 399- 447. Daliang, G., Shubin, W., Gaojin, L. and Huiping, G. (2017). Effect of molecular weight on the pyrolysis characteristics of alkali lignin. Fuel., 193(5); 45-53. Daliang, G., Shubin, W., Gaojin, L. and Huiping, G. (2017). Effect of molecular weight on the pyrolysis characteristics of alkali lignin. Fuel., 193(29); 45-53. Fanchiang, J.M. and Tseng, D.H. (2009). Degradation of anthraquinone dye Reactive Blue 19 in aqueous solution by ozonation. ChemospHere., 77(29); 214-221.
Farzaneh, M., Moonis A. K., Ehsan, M. and Bayesti, I. (2015). Soraya Hosseini, Kinetics, thermodynamics, and isotherm studies for the adsorption of BR2 dye onto avocado integument. Desalination and Water Treatment., 53 (5); 826–835.
Frangville, C., Rutkevičius, M., Richter, A.P., Velev, O.D., Stoyanov, S.D. and Paunov, V.N. (2012). Fabrication of environmentally biodegradable lignin nanoparticles. ChempHyschem., 13(18); 4235-43.
Gomez, V., Larrechi, M.S. and Callao, M.P. (2007). Kinetic and adsorption study of acid dye removal using activated carbon. ChemospHere., 69(7); 1-8. Gong, R., Li, M., Yang, C., Sun, Y., and Chen, J. (2005). Removal of cationic dyes from aqueous solution by adsorption on peanut hull. Journal of Hazardous Materials., 121(1); 247-50.
Göran, G. (2015). Softwood kraft lignin: Raw material for the future. Industrial Crops and Products., 77, 23 (17); 845-854.
Guo, X., Zhang, S. and Shan, X. (2008). Adsorption of metal ions on lignin. J. Hazard. Mater.,151 (21); 134–142.
Gupta, A.K., Mohanty, S. and Nayak, S. K. (2014). Synthesis, Characterization and Application of Lignin Nanoparticles (NLPs). Materials Focus., 3(6); 444-454.
Gupta, V. K. Jain, R. Mittal, A. Saleh, T. A. Nayak, A. Agarwal, S. Sikarwar, S. (2012). Photo-catalytic degradation of toxic dye amaranth on TiO2/UV in aqueous suspensions. Materials Science and Engineering C ., 32(1 ); 12-17.
Gupta, V.K. Agarwal, S.Saleh, T.A. (2011). ynthesis and characterization of alumina-coated carbon nanotubes and their application for lead removal. Journal of Hazardous Materials., 185(1); 17-23.
Gupta, V.K.Srivastava, D.Mohan, S.K. Sharma, S. (1998). Design parameters for fixed bed reactors of activated carbon developed from fertilizer waste for the removal of some heavy metal ions. Waste Management., 17( 8); 517-522.
Ho, Y., Chiu, W. and Wang, C. (2005). Regression analysis for the sorption isotherms of basic dyes on sugarcane dust. Bioresource Technology., 96(20); 1285–1291.
Kaur, S. and Singh, V. (2007). TiO2 mediated pHotocatalytic degradation studies of Reactive Red 198 by UV irradiation. Journal of Hazardous Materials., 141(1); 230-6.
Kayode, O., Adebowale1, B., Olu-Owolabi1, E. and Chigbundu, C. (2014). Removal of Safranin-O from Aqueous Solution by Adsorption onto Kaolinite Clay. Journal of Encapsulation and Adsorption Sciences., 4(3); 89-104.
Madrakian, T., Afkhami, A. and Ahmadi, M. (2012). Adsorption and kinetic studies of seven different organic dyes onto magnetite nanoparticlesloaded tea waste and removal of them from wastewater samples. Spectrochimica Acta Part A: Molecular and Biomolecular Spectroscopy., 99(20); 102-109.
Mahmoud, M., Farah, J. and Farrag, T. (2013). Enhanced removal of Methylene Blue by electrocoag ulation using iron electrodes. Egyptian Journal of Petroleum., 22 (11); 211-216.
Malekbala, M.R., Masoudi, S., Soltani, Kazemi, S. and Hosseini, S. (2012). Equilibrium and Kinetic Studies of Safranine Adsorption on Alkali-Treated Mango Seed Integuments. International Journal of Chemical Engineering and Applications., 3( 16); 160-166.
Malekbala, M.R., Soltani, S. M., Kazemi, S., Hosseini, S. (2012). Equilibrium and Kinetic Studies of Safranine Adsorption on Alkali-Treated Mango Seed Integuments. International Journal of Chemical Engineering and Applications., 3(3; 160-166.
Mall, I. D., Srivastava, V. C., Agarwal, N. K. and Mishra, I. M. (2005). Removal of congo red from aqueous solution by bagas sefly ash and activated carbon: Kinetic study and equilibrium isotherm analyses . ChemospHere., 61(25); 492–501. Mittal, A. kaKaur, D. Malviya, A. Mittal, J.Gupta, V.K. (2009). Adsorption studies on the removal of coloring agent phenol red from wastewater using waste materials as adsorbents. Journal of Colloid and Interface Science ., 337(2); 345-354.
Mittal, A. Mittal, J. Malviya, A. Gupta, V.K. (2009). Adsorptive removal of hazardous anionic dye “Congo red” from wastewater using waste materials and recovery by desorption. Journal of Colloid and Interface Science., 340(1); 16-26. Mittal, A. Mittal, J. Malviya, A. kaKaur, D. Gupta, V.K. (2010). Decoloration treatment of a hazardous triarylmethane dye, Light Green SF (Yellowish) by waste material adsorbents. Journal of Colloid and Interface Science., 342(2); 518-5277.
Mohan, D., Singh, K. P., Singh, G., Singh, G. and Kumar, K. (2002). Removal of dyes from wastewater using flyash a low –cost adsorbent. Ind. Eng. Chem. Res., 41(2); 3688–3695.
Nigam, P., Armour, G., Banat, I. M., Singh, D. and Marchant, R. (2000). PHysical removal of textile dyes and solid state fermentation of dye-adsorbed agricultural residues. Bioresour. Technol., 72(11); 219-226.
Shoujuan, W., Yunyun S., Fangong, K., Guihua, Y. and Pedram, F. (2016). Preparation and Characterization of Lignin-Acrylamide Copolymer as a Paper Strength Additive. BioResources., 11(1); 1765-1783.
Shoujuan, W., Yunyun, S., Fangong, K., Guihua, Y. and Pedram, F. (2016). Preparation and Characterization of Lignin-Acrylamide Copolymer as a Paper Strength Additive. BioResources., 11(1); 1765-1783.
Siddique, M., Farooq, R., Khalid, A., Farooq, A., Mahmood, Q. and Farooq, U. (2009). Thermal-pressure-mediated hydrolysis of Reactive Blue 19 dye. Journal of Hazardous Materials.,172(19); 1007-1012.
Sixiao, H. and You-Lo H. (2015). Synthesis of surface bound silver nanoparticles on cellulose fibers using lignin as multi-functional agent. Carbohydrate Polymers., 131(20); 134-141. Vinod, K., Gupta, A., Mittal, R., Jain, M. M. and Shalini, S. (2006). Adsorption of Safranin-T from wastewater using waste materialsactivated carbon and activated rice husks. Journal of Colloid and Interface Science., 303(3) ; 80–86.
Xiao-Feng, S., Qing, Y., Zhanxin, j. and yajing, l. (2014). Preparation of hemicellulose-g-poly(methacrylic acid)/carbon nanotube composite hydrogel and adsorption properties. Polymer Composites., 35( 1); 45–52.
Yuan, Z., Fei, Y., Junhong, C. and Jie, M. (2016). Batch and column adsorption of methylene blue by grapHene/alginate nanocomposite: Comparison of single-network and double-network hydrogels. Journal of Environmental Chemical Engineering., 4(1); 147–156.
Yuanyuan, G., Qiang, W. and Zhili, L. (2014). Preparation and Evaluation of the Free Radical Scavenging Activities of Nanoscale Lignin Biomaterials. BioResources., 9(4); 6699-6706. Yufang, T., Yongde, Z., Tao, H., Qiang, Z. and Yongzhen, P. (2016). Preparation of lignin sulfonate-based mesoporous materials for adsorbing malachite green from aqueous solution. Journal of Environmental Chemical Engineering., 4 (16); 2900–2910.