Max Planck Institute for Demographic Research Konrad-Zuse Str. 1, D-18057 Rostock·GERMANY www.demographic-research.org
DEMOGRAPHIC RESEARCH
VOLUME 21, ARTICLE 15, PAGES 427-468
PUBLISHED 09 OCTOBER 2009
http://www.demographic-research.org/Volumes/Vol21/15/ DOI: 10.4054/DemRes.2009.21.15
Research Article
The Likoma Network Study:
Context, data collection, and initial results
Stéphane Helleringer, Hans-Peter Kohler,
Agnes Chimbiri, Praise Chatonda,
James Mkandawire
This publication is part of the proposed Special Collection “HIV/AIDS in sub-Saharan Africa”, edited by Susan Watkins, Jere Behrman, Hans-Peter Kohler, and Simona Bignami-Van Assche.
c
°2009 Stéphane Helleringer et al.
2 Background: Network epidemiology 430
3 Practical challenges facing network studies 431
3.1 Potential sources of bias in network tracing 431 3.2 Likoma Island as an “epidemiological laboratory” 432 4 Data collection procedures in the Likoma Network Study 433
4.1 Rosters of potential network partners 434
4.2 ACASI network survey 435
4.3 Relationship and health data 439
4.4 HIV testing 439
5 Results 440
5.1 Study context: Household listing data 440
5.2 Patterns of participation and nonresponse 442
5.3 Sexual partnerships: descriptive statistics 444
5.3.1 Outdegree distributions 444
5.3.2 Characteristics of sexual relations reported during the network survey 445
5.3.3 Patterns of partner tracing 451
5.3.4 Indegree distributions 453
5.3.5 Total degree distributions 453
5.3.6 Comparison of total degree distributions and outdegree distributions: 456
5.4 Analysis of network data quality 457
5.4.1 Selectivity of the tracing process 458
5.4.2 Jointly reported relationships 459
5.5 HIV prevalence 460
6 Conclusion 461
7 Acknowledgements 462
The Likoma Network Study:
Context, data collection, and initial results
Stéphane Helleringer1 Hans-Peter Kohler2
Agnes Chimbiri3
Praise Chatonda4
James Mkandawire5
Abstract
The extent and structure of sexual networks have important consequences for the spread of sexually transmitted diseases such as HIV. However, very few datasets currently ex-ist that allow a detailed investigation of sexual networks in sub-Saharan African settings where HIV epidemics have become generalized. In this paper, we describe the context and methods of theLikoma Network Study(LNS), one of the few studies that have collected extensive information on sexual networks in sub-Saharan Africa. We start by review-ing theoretical arguments and empirical studies emphasizreview-ing the importance of network structures in the epidemiology of HIV and other sexually transmitted infections (STI). The island setting of this study is described, and we argue that the choice of an island as a research site limited potential biases that may make the collection of sexual network data difficult. We then document our empirical strategy for the collection of sexual net-work data and the subsequent identification of sexual netnet-work partners. A description of the protocol for the collection of biomarker data (HIV infection) is provided. Finally, we present initial results relating to the socioeconomic context of the island, the size and composition of sexual networks, the quality of the sexual network data, the determinants of successful contact tracing during the LNS, and the prevalence of HIV in the study population.
1Assistant Professor at the Mailman School of Public Health, Columbia University, 60 Haven Ave, New York,
NY 10032, USA;Email:[email protected].
2Professor of Sociology at the University of Pennsylvania, Population Studies Center, 3718 Locust Walk,
Philadelphia, PA 19104-6299, USA;Email:[email protected].
3Assistant Resident Representative at UNDP Malawi, P.O Box 30135, Lilongwe 3, Malawi; Email:
1. Introduction
Sexual networks are the primary mechanism through which HIV is spread in Sub-Saharan Africa (SSA). Theoretical network models have shown that individuals’ positions within these sexual networks, and the structural characteristics of the network itself, are impor-tant determinants of HIV infection risks and disease dynamics (Kretzschmar and Morris 1996; Ghani and Garnett 2000; Newman 2002). Several features of sexual networks that are predicted by these models to enhance the spread of HIV have been empirically docu-mented in SSA, includingconcurrencyof sexual partnerships (Morris 1997) andskewed distributionsof the number of sexual partnerships (Anderson and May 1991; Jones and Handcock 2003a). Despite this evidence, empirical network studies of HIV infection risks and disease dynamics in SSA remain very limited. Available data on sexual networks are often based on small populations, frequently restricted to egocentric networks, and are not based on an integrated design that includes tracing of sexual networks, HIV testing, and extensive socioeconomic data for all members of a population.
In this paper we provide a comprehensive description and the initial results of the
Likoma Network Study(LNS), an innovative sociocentric network study that documents the sexual networks connecting the young adult population in a sub-Saharan context with high HIV prevalence (see also Helleringer and Kohler 2007, 2008; Helleringer et al. 2007, 2009a, 2009b). As we will elaborate in the subsequent sections, the sociocentric network design of this study allows us to overcome—or at least, ameliorate—several of the limi-tations that have hampered earlier studies of sexual networks and HIV infection risks in sub-Saharan Africa.
By choosing Likoma Island, a small island on Lake Malawi (Figure 1), as its study lo-cation, the LNS follows a long tradition of epidemiological island studies (Cliff, Haggett, and Smallman-Raynor 2000; Whittaker 1999) and takes advantage of the limited range of mobility and the well-defined population boundaries of insular communities: these fea-tures imply that a high proportion of the islanders’ sexual partners are likely to reside on the island, thereby increasing the probability of tracing sexual partners. Studies using a design similar to that of the LNS have been conducted in different contexts (e.g, Bearman, Moody, and Stovel 2004; Klovdahl et al. 1994), but were lacking for African populations with generalized HIV epidemics. Our presentation of the LNS is structured as follows:
procedures for the identification of sexual networks (Section 4).Fourth, we discuss initial results relating to(i)the socioeconomic context of the island (Section 5.1),(ii) participa-tion in different stages of the study (Secparticipa-tion 5.2),(iii)sexual behaviors and relationships (Section 5.3), (iv)network data quality (Section 5.4), and(v)HIV prevalence (Section 5.5).
2. Background: Network epidemiology
The classical models of mathematical epidemiology (Bailey 1975; Anderson and May 1991) rely on the assumption that sexual partners are randomly selected from the popula-tion of interest. In this framework, two key measures to study epidemics are (1) the basic reproduction number,R0, and (2) the final size of an epidemics∞. The basic
reproduc-tion number,R0, is the expected number of secondary infections arising from a single,
typical infectious individual in a completely susceptible population (Heesterbeek 2002). In a well-mixed and socially unstructured population (i.e., where individuals randomly select their partners among other members of the population),R0is the product of three
quantities: the transmissibility of the infectionτ, the duration of infectiousnessδ, and the rate of contact between susceptible and infectious individuals¯c. This latter parameter is the focus of the LNS.
Epidemics are nonlinear phenomena andR0is a threshold parameter. WhenR0>1,
an epidemic is certain in a deterministic model and has nonzero probability in a stochastic model. Strategies for disease control and eradication are aimed at bringingR0below the
3. Practical challenges facing network studies
The collection of large-scale data on sexual networks, which can provide information about¯c, is a challenging undertaking facing abundant practical obstacles (Morris 2004; Doherty et al. 2005).
3.1 Potential sources of bias in network tracing
Doherty et al. (2005) identifies three difficulties that may lead toincomplete-network bias: “the incomplete ascertainment of sociometric networks is inevitable in both clinical and research settings, because (1) people may be reluctant to name all sex partners [. . . ]; (2) they may be unable or unwilling to provide adequate contact information for locating partners; or (3) partners may be locatable but difficult to reach.”
The first aspect, the misreporting of sexual partners and sexual relationships, is perva-sive in all inquiries of sexual behaviors (Cleland et al. 2004), including large-scale indi-vidual centered surveys such as the Demographic and Health Surveys (DHS). The second and third aspects (insufficient information for partner tracing and failures to locate nomi-nated partners), on the other hand, are specific to sociocentric studies of sexual networks. In developed countries, data on sexual networks are frequently collected within health-care settings during contact tracing interviews of STI cases (Klovdahl et al. 1994; Wylie, Cabral, and Jolly 2005; Ghani et al. 1996). Such data have provided seminal insight on the role of sexual network structures in shaping disease diffusion among high-risk groups. Contact tracing procedures involve collecting and managing extensive identifying infor-mation on partners of infected individuals, including inforinfor-mation such as names, address, phone number, and various sociodemographic characteristics. Even in resource-rich con-texts, the collection and management of such information can be very cumbersome, and it is often the case that the information provided by respondents during contact tracing in-terviews is not accurate, or is not detailed enough to eventually find the nominated partner (Potterat et al. 2004). As a result, a large proportion of contacts are never traced during sociocentric studies (Potterat et al. 1999; Koumans et al. 2001; Ghani et al. 1996) and the descriptions of the networks produced during similar inquiries are partial. These difficul-ties of contact tracing appear compounded even further in SSA, because individuals are not easily identified. For example, often there are no street names, house numbers, and/or phone numbers where contacts can be reached. It may also happen that someone uses different names or nicknames under various circumstances or changes names after impor-tant events of the life cycle (e.g., sexual initiation among certain ethnic groups), making identification and contact tracing problematic.
is not clear where to draw the line between members and nonmembers of a population. Influential individuals may well reside outside of a specific area or may not belong to a group defined by a certain criteria. In a reanalysis of the classic study of the adoption of the drug Tetracycline among a network of medical practitioners in Illinois for example (Burt 1987; Coleman, Katz, and Menzel 1966), Van Den Bulte and Lilien (2001) show that marketing agents were the most influential proponents of the drug. However, the net-work data collected by Coleman and others (Coleman, Katz, and Menzel 1966), did not include such actors within its boundaries. In the case of HIV spread, groups of “outsiders” such as truck drivers, people from town, etc., have been identified as playing a dispropor-tionate role within sexual networks transmitting HIV in rural areas of SSA (Hudson 1996; Caldwell, Caldwell, and Quiggin 1989). Such groups represent epidemiologically impor-tantbridge populations(Lurie et al. 2003; Lagarde et al. 2003; Caldwell, Caldwell, and Quiggin 1989) who may continually reintroduce HIV within rural villages. Because these important populations reside outside of local communities and/or are highly mobile, they are challenging to reach and are likely to be systematically underrepresented in sexual network studies.
3.2 Likoma Island as an “epidemiological laboratory”
Following this tradition of studying networks in well-defined populations, the LNS aimed at tracing the sexual networks of young adults on Likoma Island in Malawi. Likoma Island is located in the northern region of Lake Malawi (Figure 1), extends over only 18 square kilometers, has limited transportation to the mainland, and its population is small with just over 7,000 persons living in a dozen villages (Section 5.1). As a result, a limited set of identifying information allows tracing contacts nominated during a sociocentric network study.
The choice of an island as research site for the LNS also follows a long tradition of is-land studies in epidemiology and biology (Whittaker 1999; Cliff, Haggett, and Smallman-Raynor 2000). Researchers have been able to use islands to study and identify the mech-anisms through which an infection diffuses locally through a population as diseases are less likely, than on the mainland, to be continuously re-introduced through migration or travel. For example, analyses of flu or measles epidemics in Iceland and the Pacific Is-lands have contributed greatly to our understanding of the spread of airborne diseases. This advantage of island studies also pertains to the study of HIV, where many epidemio-logical studies have emphasized the role of migration and mobility in the spread of HIV (Glynn et al. 2001b; Coffee et al. 2005; Lurie et al. 2003).
4. Data collection procedures in the Likoma Network Study
In this section we describe the data collection procedures that were implemented as part of the LNS to try and reconstruct the sexual networks connecting the inhabitants of the study villages chosen for this project (Figure 2). The protocol for this study was approved by institutional review boards at the Malawi College of Medicine and the University of Pennsylvania. Community approval was obtained during meetings with local represen-tatives (traditional chiefs, district represenrepresen-tatives), and informed consent from the study participants was obtained prior to interviews and HIV testing.
Figure 2: Geographic location of the sampled villages and village-specific participation rates
Each circle represents a dwelling unit. Dark circles represent housing units that were included in the sexual network survey. Empty circles represent housing units that were not included in this sampling frame. Denominators of the survey participation rates are the total number of eligible respondents (aged 18–35 and their spouses) in a given village, based on the initial household census. Denominators of the HIV testing participation rates are the total number of respondents who completed the sexual network survey in a given village. Island boundaries and location of dwelling units are approximate.
4.1 Rosters of potential network partners
included being older than 18 years old, and being a regular member of the household. The LNS household census also included vacated dwellings: neighbors of empty houses were asked to answer a one-page questionnaire about former residents of the house. The vacated dwellings questionnaire included questions about family name, former head of the household, time since the house had been vacated, and reason for departure.
b) Migration and mortality:Because migrants and recently deceased individuals have been identified as crucial for disease spread (Lurie et al. 2003; Wawer et al. 2005; Coffee et al. 2005; Coffee, Lurie, and Garnett 2007), household informants were asked about
(i)temporary migrants from their households,(ii)household or extended family members who moved permanently out of Likoma over the last five years, and(iii)household or ex-tended family members who died over the last five years. For each of these, the informant was asked to provide names, potential nicknames and sociodemographic characteristics (age, sex, education, marital status, etc.). For migrants, the date of departure, the reason for departure as well as the destination were noted. For the deceased, the date of death as well as a few questions relating to the cause of death and probable final illness were col-lected. The lists gathered through the household census and migration/mortality modules constitute additional rosters of potential social and sexual network partners that we use to link records of relationships (see below).
c) GPS data: During the household listing, we collected the GPS coordinates of all the dwelling units we visited. We tracked the main roads and pathways people use to travel around the islands. Finally we referenced the main landmarks and public places in each village: for example, each school, church, well, or village center were located. This information is extensively used to identify sexual partnerships (see below).
4.2 ACASI network survey
stronger ties to the mainland of Malawi, and remittances represent a significant source of income for many households. As a result, fishing is not the focus of social and economic life, and on most days large groups of people can be found gathering close to the grocery stores or at the village center, playing games of bawo (a local board game), chatting and, for men, drinking beer. Geographically, the sample thus stretches from the southern tip of the island to the northern shores of Likoma.
In the sampled villages, we interviewedall inhabitants aged 18–35 and their older spouses. We limited our sample to this age group, because (1) it represents the age range during which most incident HIV infections occur (e.g Heuveline 2003), and (2) it repre-sents the age range during which most nonmarital sexual networking seems to take place (Nnko et al. 2004; Glynn et al. 2001a). This limitation of the sample to the younger age groups generated some confusion among the population, especially because we explained the purpose of our study as trying to identify the factors affecting the spread of HIV. Older respondents argued (rightly so) that they were also at risk of acquiring HIV and as such should have been interviewed by the survey team (and especially tested during the collection of biomarker data).
Prior to the start of the study, we conducted a pilot of the interviewing software in two separate nonsample villages of Likoma. We chose these two villages for their con-venience as they were immediately bordering the trading center where the research team was staying. In the first village, we interviewed 20 respondents using an initial version of the sexual network interviewing software. After getting feedback from both interviewers and respondents during this pilot, we realized that our initial strategy to identify sexual network partners was unlikely to be successful (see Section h). We thus significantly re-vised our interviewing strategy (see below) and conducted a second, more extensive pilot with roughly 80 respondents and updated interviewing software. This second pilot proved largely successful and initial releases of the network data included relationships identified from pilot interviews. But, because interviews were conducted with only 60% of village inhabitants (a response rate significantly lower than in the other sample villages and one that does not allow drawing a quasi-complete picture of the village network), these data are discarded from the final analyzes. In addition, the final version of the software used during fieldwork is slightly different from the version we used during this pilot.
how-ever, prone to cause informants to forget partners (Brewer and Webster 1999). To reduce this effect of partial recall in the construction of the population-level network, a sexual relationship was assumed to have taken place between two partners if it was reported by at least one partner.
f) Fixed choice design: As we argued above (Section 2), the variance of the degree distribution is an important parameter in mathematical models of STI spread. Unfortu-nately, the behaviors of highly active network members are often difficult to measure in empirical studies. For example, highly sexually active survey respondents may grossly misestimate the number of their partnerships (Handcock and Jones 2004). Several studies have also shown that respondent’s fatigue builds up quickly in network surveys (White and Watkins 2000), and respondents become bored with answering the same set of ques-tions about a (possibly large) number of different partners. As a result (and also because of software and programming constraints), we followed a common practice in network research and imposed a cutoff on the number of partnerships to be reported. This value was set at five. Such a research design may lead to bias in estimates of network properties (Kossinets 2006; Costenbader and Valente 2003) if it is close or even below the mean of the underlying degree distribution. However, if the mean of the underlying degree dis-tribution is well below the cutoff used during a network survey, then various structural properties (e.g., dyad or triad census) of the underlying networks are less affected by missing data (Wasserman and Faust 1994, Chap. 13). We estimate in Section 5.3.1 the proportion of respondents who might have reported more sexual partnerships if such a fixed choice design had not been used.
h) Strategy for identifying sexual partners: Tracing sexual networks during empiri-cal studies generally involves looking up names generated during a survey and comparing them to preexisting rosters of potential network partners. While previous studies of sex-ual networks having used ACASI technology (Bearman, Moody, and Stovel 2004) put this burden on respondents and asked them to directly browse through rosters of poten-tial partners, this was found to be highly impractical in Likoma, where computer literacy is minimal. Indeed, during pilots and pretests, we experimented by inputting the ros-ters created from the household census into audio files and incorporating them in our interviewing software, so that respondents themselves could establish links. But pilot re-spondents were surprised (and at times angered) that a machine could know the names of actual people. Furthermore, the thousands of audio-files (*.wav files) required to enable this interviewing strategy were significantly slowing down the ACASI software.
It is important to note that this linkage strategy involves absolutely no “active” contact tracing, during which the researcher approaches the partner(s) of initial cases using the information gathered during interviews. Contacting a nominated partner as part of the sur-vey would signal to other community members (including spouse and family members) that a person belongs to an extended network of (possibly extramarital) sexual relations in a tightly knit rural/island setting. Our approach on the other hand is inclusive as respon-dents are only approached by the research team on the basis of their residence and their age.
4.3 Relationship and health data
In addition to questions allowing the identification of sexual partners, respondents were asked a short series of relationship-specific questions during the ACASI interview. These questions related to the initial meeting and conditions that surrounded the initiation of the relationship, including how the two partners knew each other before the start of the relationship, where and when the first meeting occurred, when the relationship ended and what caused the relationship to end. Additional questions related to sexual activity within the relationships, including whether or not the relationship involved sexual intercourse, the frequency of sexual intercourse within the relationship, and whether condoms were used during sexual intercourse. The final series of questions related to respondents’ per-ceptions of HIV/STD risk at the time of the relationship.
After completion of the sexual networks part of the ACASI interview, respondents were asked to answer questions regarding their own health, including: a self-reported assessment of general health; the presence and frequency of specific symptoms such as headache, stomach ache, general weakness, joint aches, painful urination or discharge during urination, ulcers in the genital area; the use of healthcare when these symptoms occur; previous use of HIV testing services, and reasons for not being tested (e.g., dis-tance, cost, stigma associated with testing centers). Additionally, a history of injections received during healthcare, as well as the date, location and the reason for the last injection received by the respondent were incorporated into the assessment.
4.4 HIV testing
2—could not be included due to funding and timing constraints limiting the scope and duration of the fieldwork. As a result, this village is included only in analyses of sexual network structures, but is excluded from all analyses relating to HIV risk factors. When approached by the health counselors, respondents were offered the opportunity to receive HIV counseling and testing in their homes using rapid HIV tests. Because individuals might be concerned about the privacy of in-home HIV tests, respondents were also given the option to be tested at another location (i.e., the team’s hotel). The rapid HIV tests were conducted using a parallel testing algorithm approved by WHO (World Health Or-ganization 2002) and the Malawian Ministry of Health. Two rapid HIV tests, Unigold (Trinity Biotech, Ireland) and Determine (Abbott, Japan) were run simultaneously at the respondent’s home. Blood samples that were concordantly negative or positive were con-sidered to be a true result. Four discordant results were obtained and were referred to local testing centers for confirmatory testing after a few weeks. Results were available to the respondents after 20 minutes, but respondents were also given the option to retrieve their test results at a latter date if they so desired.
5. Results
5.1 Study context: Household listing data
on Likoma than in the rest of rural Malawi, where out-migration of young adult males to the larger cities of Lilongwe, Blantyre and Mzuzu (Figure1), or abroad is also quite frequent.
Figure 3: Age and sex distribution of all inhabitants residing on Likoma Is-land.De Jurepopulation as of November 2005
Source:Likoma Network Study Household Listing
Trips to visit relatives and/or to get medical treatment may last much longer. On average, men between the ages 18–59 have completed 8.1 years of schooling, while women in the same age range have completed 7.2 years (p < 0.01). 46.3% of men in this age range had completed primary schooling in 2005 (8 years of formal schooling), but this was the case for only one-third of women. Five percent of the adult island inhabitants had never attended school, and this proportion did not differ by gender.
5.2 Patterns of participation and nonresponse
Seventeen households refused to be interviewed during the initial stage of this study, and we do not know how many individuals were members of these households. We selected 7 of the 12 villages for inclusion in the sexual network study (Figure 2), representing 50.9% of the total adult population aged 18–35 of Likoma. Men in villages not included in the sample had on average one more year of schooling than men in sample villages (p < 0.001). Women in nonsample villages were also more educated than women in sample villages by an average of nine months (p <0.001). This is likely the case because administrative services and NGOs operating on the island (who employ individuals with a high school certificate and often some college education) were located at the trading centre (a larger village called “Mbamba”). This trading centre was not part of the LNS sample. In addition, sampled households were slightly larger than nonsampled households (5.8 vs. 5.1,p = 0.03). Inhabitants of sampled villages, however, were not more likely to have ever been married than out-of-sample inhabitants suggesting that patterns of sexual networking, may be relatively similar in sampled and nonsampled villages (Figure 4).
A total of 923 inhabitants in the sampled villages were interviewed during the sexual network survey (422 Males and 501 Females), and the participation rate was 88% (923 participants out of 1,052 eligible respondents). The main reason for nonparticipation in the survey was temporary migration to the mainland of Malawi or Mozambique. Very few potential respondents refused to participate in the survey (N = 21, 2.5%). Response rates by village are displayed in Figure 2. Participation rates ranged from 82% to 93%, but did not differ significantly by village nor by gender. Eligible respondents who refused to participate in the study did not differ from study participants on most socioeconomic characteristics. However, men who did not participate in the survey were generally more educated than men who participated (8.2 years of schooling vs. 7.6 years,p= 0.09).
the possibility to skip or refuse to answer every question of the audio-survey by a simple touch on the computer’s touchpad, few refused to name partners or to answer questions concerning partners’ residence. Such refusals usually came after two or three partners had already been named, and might indicate an inadvertent error from the respondent or fatigue. Comparatively, refusal rates for single items were significantly higher for questions about occasions of initial meeting (10% missing data), or questions relating to condom use. We suspect, however, that when a respondent wanted to keep a relationship secret, he/she used names such as “Andreya Banda” or “Esther Phiri” for their partners, which are the equivalent of “John Doe” or “Jane Doe” in the U.S. We generally had difficulties linking such common names to our village/migration rosters.
Figure 4: Kaplan-Meier estimates of age at first marriage among inhabitants of Likoma Island
5.3 Sexual partnerships: descriptive statistics
5.3.1 Outdegree distributions
The outdegree of a respondent is the number of partners that were nominated by a respon-dent during the sexual network survey. Males reported having been involved in a total of 2.41 relationships per respondent (Figure 5a) during the three years prior to the survey, whereas women reported a total of 1.82 relationships over the same time span (p <0.01). Only 2% of women and 8.4% of men reported five partnerships, implying that they were potentially involved in more relations but were not allowed to report more by the inter-viewing software. The variance of the outdegree distribution was significantly lower than its mean (0.92 for women, 1.3 for men), but this is likely due to the fact that the outdegree distribution was truncated at five. A little over 5% of respondents reported no sexual part-nerships during this survey, and among these the proportion of males was slightly higher (Figure 5a). When the period of observation is restricted to the year prior to the survey (Figure 5b), more respondents report not having been involved in a relationship (10%) and the majority of respondents report only one partnership. 28% of women and 43% of men nevertheless report more than one partnership (p <0.01) during the year prior to the survey.
Figure 5: (Continued)
5.3.2 Characteristics of sexual relations reported during the network survey
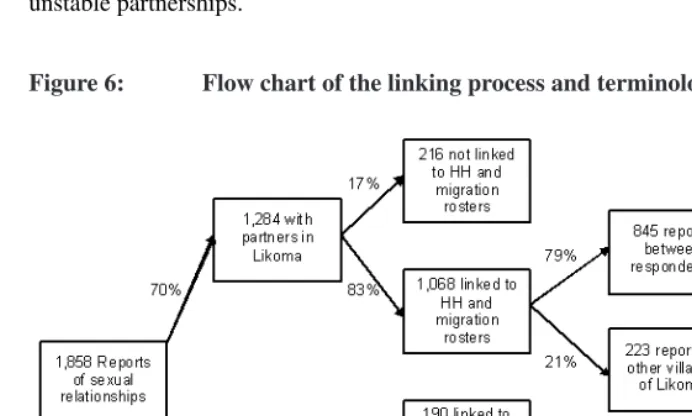
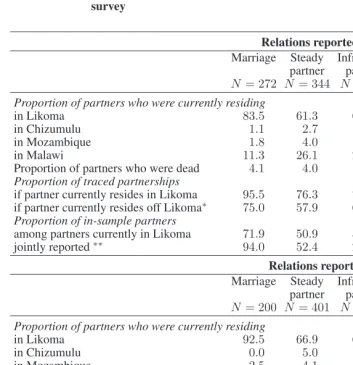
Following from the distribution of outdegrees, a total of 2,040 reports of relationships were collected from the 923 respondents during ACASI interviews. Among those, 1,858 were said to have involved sexual intercourse (or 91%). Table 1 describes characteris-tics of the reports of sexual partnerships made during the network survey, and Figure 6 summarizes the steps involved in the linking process and the terminology we use in our analyzes.
mix-ing: most nonmarital partnerships of women either took place with other inhabitants of Likoma or with partners residing on mainland Malawi. Men, on the other hand, engaged in nonmarital partnerships with partners from more diverse contexts, for example with residents of a neighboring island (Chizumulu) or with residents of Mozambique. This pattern of sexual mixing seems to reflect daily patterns of mobility (see Section 5.1). In addition, 11.3% of women, but only 3.5% of men reported a marital partner outside of Likoma. Spousal separation was often due to divorce (the relations in Table 1 include some relationships that were over at the time of the survey), but may also have occurred because of migration of one of the spouses (generally the man). Finally, women were more likely to report having been involved in a sexual relation with someone who had since died. The proportion of deceased partners was significantly higher in short and unstable partnerships.
Table 1: Characteristics of relationships reported during the sexual network survey
Relations reported by women
Marriage Steady Infrequent One-night
partner partner stand
N= 272 N= 344 N= 200 N = 51
Proportion of partners who were currently residing
in Likoma 83.5 61.3 64.6 52.1
in Chizumulu 1.1 2.7 6.2 4.2
in Mozambique 1.8 4.0 2.1 2.1
in Malawi 11.3 26.1 21.4 22.9
Proportion of partners who were dead 4.1 4.0 5.2 14.6
Proportion of traced partnerships
if partner currently resides in Likoma 95.5 76.3 79.0 68.0
if partner currently resides off Likoma∗ 75.0 57.9 60.0 51.4
Proportion of in-sample partners
among partners currently in Likoma 71.9 50.9 52.4 52.0
jointly reported∗∗ 94.0 52.4 27.5 31.2
Relations reported by men
Marriage Steady Infrequent One-night
partner partner stand
N= 200 N= 401 N= 247 N = 88
Proportion of partners who were currently residing
in Likoma 92.5 66.9 64.2 50.6
in Chizumulu 0.0 5.0 8.2 6.0
in Mozambique 2.5 4.1 4.7 9.6
in Malawi 3.5 19.4 15.9 19.3
Proportion of partners who were dead 1.5 1.5 3.0 13.2
Proportion of traced partnerships
if partner currently resides in Likoma 95.1 81.1 71.8 78.6
if partner currently resides off Likoma∗ 60.0 62.0 45.4 45.0
Proportion of in-sample partners
among partners currently in Likoma 85.9 58.0 50.3 52.4
jointly reported∗∗ 96.9 35.0 20.0 10.4
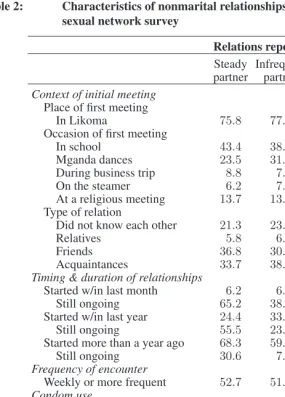
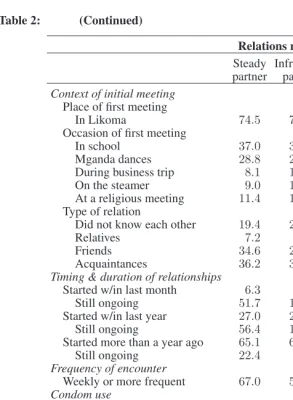
Table 2 provides further descriptions of the context and characteristics of nonmarital relationships reported during the sexual network survey. Several characteristics of rela-tionships differed significantly between gender and across relation type. Whereas most relationships (almost 70%) were initiated on the island, men were much more likely to engage in one-off encounters outside of Likoma. Almost half of the one-night stands reported by men took place either in Mozambique, Chizumulu, mainland Malawi or pos-sibly elsewhere (e.g., Tanzania, South Africa). The large majority of partnerships are with someone the respondent was acquainted with prior to starting the relationship. The occa-sions and specific contexts during which men and women meet different types of partners also varied quite widely. Men were more likely to meet their short-term partners dur-ing business trips or while traveldur-ing to the mainland on a steamer. Religious gatherdur-ings contributed to the formation of more than 10% of partnerships, but women in particular report that very few unstable partnerships were formed during such events. School and traditional events (Mganda) represented the two settings during which most partnerships were initiated. Further differences were found with respect to the type of relationship that existed between partners prior to the initiation of the sexual partnership. 25% of nonmar-ital sexual partnerships were initiated between partners who did not know each other or had just met. Men were slightly more likely to engage in partnerships with women they did not know, and these partnerships often led to “one-night stands” or unstable relation-ships. Less than 10% of extramarital relationships took place with a relative, but close to 23% of the one-night stands reported by women were with someone they were related to (either by blood or by marriage, i.e., in-laws).
Table 2: Characteristics of nonmarital relationships reported during the sexual network survey
Relations reported by women
Steady Infrequent One-night
partner partner stand
Context of initial meeting
Place of first meeting
In Likoma 75.8 77.0 62.5
Occasion of first meeting
In school 43.4 38.1 42.2
Mganda dances 23.5 31.2 22.2
During business trip 8.8 7.7 15.6
On the steamer 6.2 7.7 8.9
At a religious meeting 13.7 13.8 5.1
Type of relation
Did not know each other 21.3 23.4 14.6
Relatives 5.8 6.2 23.2
Friends 36.8 30.7 31.2
Acquaintances 33.7 38.5 29.1
Timing & duration of relationships
Started w/in last month 6.2 6.7 20.8
Still ongoing 65.2 38.4 40.0
Started w/in last year 24.4 33.9 14.6
Still ongoing 55.5 23.1 0.0
Started more than a year ago 68.3 59.4 64.6
Still ongoing 30.6 7.9 3.1
Frequency of encounter
Weekly or more frequent 52.7 51.9 50.0
Condom use
Never 34.4 36.2 45.8
Sometimes 41.2 38.8 37.5
Always 24.3 25.0 16.7
HIV risk perception
Worried a lot 12.8 23.3 22.9
Worried a little 30.1 22.7 20.8
Not worried at all 54.1 52.9 54.1
Table 2: (Continued)
Relations reported by men
Steady Infrequent One-night
partner partner stand
Context of initial meeting
Place of first meeting
In Likoma 74.5 74.0 51.8
Occasion of first meeting
In school 37.0 31.4 32.9
Mganda dances 28.8 29.5 20.2
During business trip 8.1 10.0 20.2
On the steamer 9.0 15.4 13.9
At a religious meeting 11.4 10.9 12.6
Type of relation
Did not know each other 19.4 25.9 37.8
Relatives 7.2 9.5 12.2
Friends 34.6 26.7 14.6
Acquaintances 36.2 36.6 32.9
Timing & duration of relationships
Started w/in last month 6.3 5.6 10.8
Still ongoing 51.7 15.4 22.2
Started w/in last year 27.0 29.3 37.4
Still ongoing 56.4 19.1 6.1
Started more than a year ago 65.1 65.1 51.8
Still ongoing 22.4 7.9 4.6
Frequency of encounter
Weekly or more frequent 67.0 57.5 55.4
Condom use
Never 32.8 33.2 33.7
Sometimes 36.0 41.0 37.3
Always 31.2 25.7 28.9
HIV risk perception
Worried a lot 13.7 14.4 22.9
Worried a little 23.4 28.4 31.3
Not worried at all 60.5 55.9 42.2
N 401 247 88
Notes:Reported numbers in the table are percentages.
women. This pattern was especially apparent in steady relationships. Consistent con-dom use was reported in 25–30% of all extramarital relationships, in general to prevent infection with STDs. Finally, levels of worry about HIV were lower in more stable rela-tionships.
5.3.3 Patterns of partner tracing
Of the sexual relationships involving two partners currently residing on Likoma (N = 1,284), we were able to trace both partners within our lists in 84.9% of the cases (80.5% of extramarital relationships and 94% of marriages). Tracing rates of partners residing within the island did not differ systematically by gender, but less stable relationships were notably less likely to be linked to a record in the village rosters. This differential success in tracing partners potentially introduces a bias of our network data towards more stable/legitimate relationships, but we are unable to measure the extent of this bias at this point.
When the nominated partner is not currently residing on the island or has died (but was residing on the island at the time of the relationship,N = 303), on the other hand, we are able to trace him/her within our rosters of migrants from the island in 62.5% of the cases. This lower tracing rate may suggest that(i)migrations or deaths were under-reported during the migration/mortality module,(ii)the timing of migration and/or death may have been misreported during the migration/mortality module.
Table 3: Characteristics of nonmarital relationships between two residents of Likoma Island reported during the sexual network survey
Relations reported Relations reported
by women by men
Traced in Not traced in Traced in Not traced in HH rosters HH rosters HH rosters HH rosters
Context of initial meeting
Place of first meeting
In Likoma 87.0 80.2 76.6 79.3
Occasion of first meeting
In school 40.8 40.7 33.1 32.4
Mganda dances 31.8 23.5 32.5 32.4
During business trip 5.9 16.0 7.5 3.8
On the steamer 6.9 6.2 11.1 16.2
At a religious meeting 11.8 11.1 10.8 13.3
Type of relation
Did not know each other 20.0 29.1 21.2 26.6
Relatives 7.54 2.3 10.5 1.9
Friends 31.5 41.9 32.5 26.6
Acquaintances 39.0 23.3 34.0 34.9
Timing & duration of relationships
Started w/in last month 5.9 7.1 4.9 6.3
Still ongoing 53.3 57.1 50.0 50.0
Started w/in last year 20.2 33.7 24.7 32.3
Still ongoing 52.5 39.4 53.9 39.0
Started more than a year ago 73.5 58.2 70.0 59.8
Still ongoing 64.2 28.1 49.4 34.2
Frequency of encounter
Weekly or more frequent 56.5 56.5 62.8 62.9
Condom use
Never 32.0 30.1 32.4 22.4
Sometimes 42.6 50.7 35.8 43.0
Always 24.4 18.1 29.7 30.8
HIV risk perception
Worried a lot 12.7 19.0 14.6 12.1
Worried a little 26.5 32.1 24.1 32.7
Not worried at all 58.8 45.2 59.9 52.3
N 344 51 401 88
5.3.4 Indegree distributions
While we have focused so far on reports made by respondents during the sexual network survey, the inclusion of individuals within the sexual networks is further defined by the distribution of indegrees (= the number of times a respondent is nominated by someone else during the survey). The distributions of indegrees over three years and over one year prior to the survey are depicted in Figure 7. These distributions differ significantly from the outdegree distributions described in Section 5.3.1: over the full reporting period, the mode of the indegree distribution is one, and a large number of respondents have an indegree of zero. Only slightly less than 20% of all respondents were nominated by more than two other respondents during the survey. Among respondents who themselves nominated more than two partners, this proportion is only raised to 24%. There were no significant differences in indegrees between men and women. Outdegree and indegree distributions differ because(i)some network members have had only partners who lived outside of the sample (and thus are not interviewed), (ii)women reported many fewer partnerships than men (see Section 5.3.1) and(iii)the limit of at most five partnerships to be reported may have resulted in some respondents not being nominated by their partners during the survey.
Figure 8 displays the indegrees of contacts (= the number of times each network mem-berwho was not a survey respondentwas nominated during the survey). The mode of this distribution is one, and only a handful of network members who were not interviewed were reported more than once. In this distribution, nobody has a degree of zero because being nominated by at least one respondent is the criteria for inclusion in the network.
5.3.5 Total degree distributions
of women and 12.6% of men had five or more partnerships. Only very few respondents (N= 27) were not sexually active over the entire recall period.
Figure 8: Indegree distribution among nonsurveyed network members, by gender
Figure 9: (Continued)
5.3.6 Comparison of total degree distributions and outdegree distributions:
In this section we compare systematically what respondents report from their own sexual networking, to measures of sexual risk-taking that also include reports made by partners (Tables 4 and 5). Graphically, it appears that the gender differences in total degree largely parallel differences in outdegree described above (Section 5.3.1). The correlation between total degree and outdegree is high as it reaches 0.85 among all respondents. There are significant differences between male and female respondents; however, the correlation coefficient for males is 0.92, whereas it is only 0.76 for females. This indicates that for this study, as has been noted elsewhere (Nnko et al. 2004), women tend to report fewer relationships than men do. And as a result, the total degree of women is often higher than their outdegree. This is the case for 30.3% of female respondents vs. only 20% of male respondents.
Table 4: Average total degree and outdegree by gender and age among never-married respondents
Female respondents Male respondents
Total degree Outdegree n Total degree Outdegree n
Age groups
Less than 20 2.59(1.61) 1.62(1.08) 93 2.21(1.44) 1.92(1.32) 75
20–24 2.38(1.53) 1.89(1.16) 66 2.69(1.49) 2.35(1.41) 109
25–29 2.44(1.20) 2.27(1.22) 18 3.91(1.93) 3.29(1.62) 24
30–34 1.80 (1.30) 1.40 (1.67) 5 1.12 (0.99) 1.00(1.06) 8
35 and older 1.50 (0.57) 1.25 (0.50) 4 3.25 (1.70)a 3.00(1.63)a 4
Notes:A test of a linear trend in degree across age groups was significant at the .1 level. Standard deviations are in parentheses.
There are several trends in the reporting of sexual partnerships by age that emerge within this study. On the one hand, we were not able to detect any significant differences in the reporting of partnerships among never-married women over age 30. This might be due to the fact that there are few women in their 30’s who have never married, and the statistical test of trends might lack power. Among never-married males, on the other hand, both outdegree and total degree appear to increase significantly with age. Among ever-married women, total degree and outdegree appear to decline with age, and this pattern occurs across all types of relationships identified in the LNS. For men, only the total number of nonmarital relationships (total degree) appears to decline with age. In contrast, this is not the case for nonmarital relationships reported by men (outdegree). This finding possibly indicates that women are reluctant to report partnerships with older men, or alternatively, that older men may be more likely to exaggerate the extent of their sexual networking, especially with younger women.
5.4 Analysis of network data quality
Table 5: Average total degree and outdegree by gender and age among ever-married respondents
Female respondents Male respondents
Total degree Outdegree n Total degree Outdegree n
All relations
Less than 20 2.20(1.05) 2.05(0.94) 20 – – 0
20–24 2.57(1.35) 2.00(0.95) 93 2.58(1.43) 2.25(1.26) 31
25–29 1.96(1.08) 1.64(0.81) 109 2.86(1.46) 2.57(1.38) 65
30–34 1.53 (0.81) 1.48(0.72) 60 2.55(1.31) 2.28(1.27) 49
35 and older 1.62 (0.79)a 1.50(0.75)a 32 2.34(1.25) 2.12(1.22) 56
Nonmarital relations
Less than 20 1.65(1.22) 1.35(0.98) 20 – – 0
20–24 1.79(1.47) 1.19(1.06) 93 2.00(1.63) 1.42(1.26) 31
25–29 1.12(1.13) 0.78(0.84) 109 2.00(1.57) 1.61(1.38) 65
30–34 0.66(0.81) 0.56(0.72) 60 1.51(1.17) 1.26(0.99) 49
35 and older 0.87(0.94)a 0.78(0.83)a 32 1.37(1.28)a 1.19(1.28) 56
Notes:aA test of a linear trend in degree across age groups was significant at the .01 level.
Standard deviations are in parentheses.
5.4.1 Selectivity of the tracing process
Our previous analyses have documented that the sexual relationships captured in the LNS sexual network survey neither represent the complete set of the sexual relationships in which respondents were engaged in, nor a random sample of this set. The relationships that are captured in the LNS –as in any other survey of sexual behaviors– are a selected subset of respondents’ sexual relations (see also Section 3). For example, as shown above, marriages and more stable sexual relationships were systematically more likely to connect two partners residing on Likoma, and they were also more likely to be traced during the sexual network survey.
As a result, roughly 40% of the relationships between two LNS survey respondents were marriages, and due to the selectivity of the data collection and linkage process, the LNS potentially overestimates the role of relatively stable sexual relationships in the sexual networks of young adults on Likoma Island.
Figure 10: Characteristics of relationships reported during the sexual network survey at consecutive stages of the tracing and linking processes
5.4.2 Jointly reported relationships
that each relationship is reported by both partners in the relationship. In reality, however, reports of sexual relationships are often discordant: they are reported by one, but not the other partner. In our study, the 845 “in-sample” relationships (Figure 6) are potentially reported by both partners. This was the case for 57.7% of all partnership reports (Table 1). That is, close to 95% of marriages were jointly reported by both spouses, and 36% of reports of extramarital relations were concordantly reported by both partners. Table 1 shows that the proportion of reciprocated reports generally increases with the strength of a relationship: reports of stable nonmarital partnerships are generally more reliable than reports of one-night stands. The concordance of reporting also increases for ongoing re-lationships. For example, 54.2% of ongoing nonmarital relationships are jointly reported by both partners, as compared to only 25% of nonmarital partnerships that have ended more than a year prior to the survey.
The proportion of concordantly reported nonmarital relationships appears lower than proportions of concordant reports observed in other studies of sexual networks (Bell, Montoya, and Atkinson 2000). However, this lower concordance rate is likely to be due to(a)the longer recall period for sexual relationships in the LNS (up to three years prior to the survey as compared to 30 days in Bell, Montoya, and Atkinson 2000),(b)the limit of at most five network partners may have resulted in truncation of some reports. In ad-dition, virtually all studies of inter-partner agreement in reporting of sexual relationships have been conducted among members of high-risk groups (Bell, Montoya, and Atkinson 2000; Adams and Moody 2007). It is possible that the social desirability biases generat-ing lower inter-partner agreement in sexual network surveys may be stronger among the general population investigated here than they are among high-risk groups. Indeed among high-risk groups, stigmatized behaviors such as nonmarital or casual sexual relations are the norm rather than exception, whereas this is not the case among the general population.
5.5 HIV prevalence
6. Conclusion
TheLikoma Network Study(LNS) constitutes—to our best knowledge—the first socio-centric study of sexual networks among a general population of SSA. Using these data, Helleringer and Kohler (2007) for instance, document the existence of a large and robust sexual network connecting young adults residing on the island. Similar sexual networks have been associated with epidemic spread of STIs in high-risk groups in developed coun-tries (Moody et al. 2003; Newman 2002; Rothenberg et al. 1998; Potterat et al. 2002), but prior to this study it has never been documented among the general population of a sub-Saharan setting where an HIV epidemic had become generalized (see also Helleringer and Kohler 2007, 2008; Helleringer et al. 2007, 2009a, 2009b).
In the present paper, we describe and evaluate the data collection procedures imple-mented during the LNS. We provide initial results relating to the socioeconomic context of the island, the prevalence of HIV in the study population, the quality of the sexual net-work data and the size, and composition of the observed sexual netnet-works. Our analyses indicate that the LNS was able to trace the large majority of sexual relationships reported by survey respondents: for example, when a survey respondent reported that his/her part-ner resided on the island at the time of the survey, we were able to identify the nominated partner in preestablished rosters of potential network members more than 8 times out of 10.
sub-Saharan populations (Morris and Kretzschmar 1997))—may be misrepresented. The networks represented in the LNS data therefore potentially overestimate the contribution of relatively stable sexual relationships to the diffusion of HIV through sexual contacts.
Fourth, we showed that, due to recall/reporting problems, the reliability of the network data is potentially limited in the case of relationships that were not ongoing at the time of the survey.
Some of these limitations (e.g., selectivity of the tracing process) are inherent to socio-centric studies, but others are due to limited resources available during the LNS and were remedied during a follow-up study conducted between October 2007 and April 2008. During this later study, we interviewed close to 2,200 respondents aged 18-50 residing in all villages of the island. The coverage of the study described here has thus become more complete and the biases just enumerated may have been substantially reduced dur-ing the follow-up. Despite the limitations described above, therefore, the LNS is likely to substantially improve in several important dimensions the available data on sexual net-works in sub-Saharan Africa as compared to other data sources that are primarily based on ego-centric surveys of sexual networks. In particular, egocentric surveys such as the DHS have no choice but to take self-reports made by respondents at face value, and such self-reports great underestimate the extent of sexual relationships—and specifically, of nonmarital relationships—in sub-Saharan populations. In contrast to egocentric data, the sociocentric design of the LNS provides possibilities to evaluate the data quality by deter-mining rates of inter-partner agreement about sexual relationships (see Section 5.4.2). In addition, due to its sociocentric design, the LNS provides more detailed data on the extent and structure of sexual networks than is available from egocentric surveys. Such detailed information about sexual network patterns are likely to improve our ability to accurately model and analyze how HIV and other sexually transmitted infections are spread through sexual contacts.
7. Acknowledgements
References
Adams, J. and Moody, J. (2007). To tell the truth: Measuring concordance in multiply re-ported network data.Social Networks29(1): 44–58.doi:10.1016/j.socnet.2005.11.009. Anderson, R.M. and May, R.M. (1991). Infectious diseases of humans: Dynamics and
control. Oxford: Oxford University Press.
Bailey, N.T.J. (1975).The mathematical theory of infectious disease and its applications. New York: Hafner Press.
Bearman, P.S., Moody, J., and Stovel, K. (2004). Chains of affection: The structure of adolescent romantic and sexual networks. American Journal of Sociology110(1): 44–91.doi:10.1086/386272.
Bell, D., Montoya, I., and Atkinson, J. (2000). Partner concordance in reports of joint risk behaviors.Journal of the Acquired Immune Deficiency Syndromes25(2): 173–181. Blasnick, M. (2001). Gsoundex: Stata module to implement soundex
algo-rithm. [unpublished manuscript]. Boston College Department of Economics. http://ideas.repec.org/c/boc/bocode/s420901.html.
Brewer, D.D. and Webster, C.M. (1999). Forgetting of friends and its effects on mea-suring friendship networks. Social Networks 21(4): 361–373. doi:10.1016/S0378-8733(99)00018-0.
Burt, R.S. (1987). Social contagion and innovation: Cohesion versus structural equiva-lence. American Journal of Sociology92(6): 1287–1335. doi:10.1086/228667. Caldwell, J.C., Caldwell, P., and Quiggin, P. (1989). The social context of AIDS
in sub-Saharan Africa. Population and Development Review 15(2): 185–234.
doi:10.2307/1973703.
Cleland, J., Boerma, J., Carael, M., and Weir, S. (2004). Monitoring sexual behaviour in general populations: A synthesis of lessons of the past decade. Sexually Transmitted Infections80(Supplement 2): 1–7. doi:10.1136/sti.2004.013151.
Cliff, A., Haggett, P., and Smallman-Raynor, M. (2000). Island Epidemics. Oxford: Oxford University Press.
Coffee, M., Lurie, M.N., and Garnett, G.P. (2007). Modelling the impact of migration on the HIV epidemic in South Africa. AIDS 21(3): 343–350.
doi:10.1097/QAD.0b013e328011dac9.
Infec-tious Diseases191(Supplement 1): 159–167.doi:10.1086/425270.
Coleman, J.D., Katz, E., and Menzel, H. (1966). Medical Innovation: A Diffusion Story. New York: Bobbs-Merrill.
Costenbader, E. and Valente, T.W. (2003). The stability of centrality measures when networks are sampled. Social Networks 25(4): 283–307. doi:10.1016/S0378-8733(03)00012-1.
Doherty, I.A., Padian, N.S., Marlow, C., and Aral, S.O. (2005). Determinants and conse-quences of sexual networks as they affect the spread of sexually transmitted infections.
Journal of Infectious Diseases191(S1): 42–54. doi:10.1086/425277.
Ghani, A.C. and Garnett, G.P. (2000). Risks of acquiring and transmitting sexually trans-mitted diseases in sexual partner networks.Sexually Transmitted Diseases27(10): 579– 587.doi:10.1097/00007435-200011000-00006.
Ghani, A., Ison, C., Ward, H., Garnett, G., Bell, G., Kinghorn, G., Weber, J., and Day, S. (1996). Sexual partner networks in the transmission of sexually transmitted diseases. An analysis of gonorrhea cases in Sheffield, UK. Sexually Transmitted Disease23(6): 498–503.
Glynn, J.R., Caraël, M., Auvert, B., Kahindo, M., Chege, J., Musonda, R., Kaona, F., Buvé, A., and the Study Group on the Heterogeneity of HIV Epidemics in African Cities (2001a). Why do young women have a much higher prevalence of HIV than young men? A study in Kisumu, Kenya and Ndola, Zambia. AIDS15(Supplement 4): 51–60.
Glynn, J.R., Pönnighaus, J., Crampin, A.C., Sibande, F., Sichali, L., Nkhosa, P., Broad-bent, P., and Fine, P.E.M. (2001b). The development of the HIV epidemic in Karonga District, Malawi.AIDS15(15): 2025–2029.doi:10.1097/00002030-200110190-00016. Handcock, M.S. and Jones, J.H. (2004). Likelihood-based inference for stochastic mod-els of sexual network formation. Theoretical Population Biology 65(4): 413–422.
doi:10.1016/j.tpb.2003.09.006.
Heesterbeek, J.A.P. (2002). A brief history ofR0and a recipe for its calculation. Acta
Biotheoretica50(3): 189–204. doi:10.1023/A:1016599411804.
Helleringer, S. and Kohler, H.P. (2007). Sexual network structure and the spread of HIV in Africa: Evidence from Likoma Island, Malawi. AIDS 21(17): 2323–2332.
doi:10.1097/QAD.0b013e328285df98.
HIV cases within the sexual networks observed on Likoma. AIDS22(11): 1378–1379.
doi:10.1097/QAD.0b013e3282fc733b.
Helleringer, S., Kohler, H.P., and Chimbiri, A. (2007). Characteristics of external/bridge relationships by partner type and location where sexual relationship took place. AIDS
21(18): 2560–2561.doi:10.1097/QAD.0b013e3282f112bd.
Helleringer, S., Kohler, H.P., and Kalilani-Phiri, L. (2009a). The association of HIV serodiscordance and partnership concurrency in Likoma Island (Malawi).AIDS22(11): 1378–1379.doi:10.1097/QAD.0b013e3282fc733b.
Helleringer, S., Kohler, H.P., and Mkandawire, J. (2009b). Increasing uptake of HIV test-ing and counseltest-ing among the poorest in Sub-Saharan countries through home-based service provision.Journal of Acquired Immune Deficiency Syndromes51(2): 185–193.
doi:10.1097/QAI.0b013e31819c1726.
Heuveline, P. (2003). HIV and population dynamics: A general model and maximum-likelihood standards for East Africa. Demography 40(2): 217–245.
doi:10.1353/dem.2003.0013.
Hudson, C.P. (1996). AIDS in rural Africa: A paradigm for HIV-1 prevention. Interna-tional Journal of STD & AIDS7(4): 236–243.doi:10.1258/0956462961917906. Jones, J.H. and Handcock, M.S. (2003a). An assessment of preferential
attach-ment as a mechanism for human sexual network formation. Proceedings of the Royal Society of London, Series B: Biological Sciences 270(1520): 1123–1128.
doi:10.1098/rspb.2003.2369.
Jones, J.H. and Handcock, M.S. (2003b). Sexual contacts and epidemic thresholds. Na-ture423(6940): 605–606. doi:10.1038/423605a.
Jones, J.H., Helleringer, S., and Kohler, H.P. (2007). Statistical Models for Sexual Net-works on Likoma Island, Malawi: Implications for Sexual Behavior and HIV Control. Paper presented at the annual meeting of the Population Association of America, New York, NY, March 29–31, 2007. http://paa2007.princeton.edu.
Klovdahl, A.S. (1989). Urban social network: Some methodological problems and possi-bilities. In: M. Kochen (ed.)The small world. Norwood: Ablex Publishing: 176–210. Klovdahl, A., Potterat, J., Woodhouse, D., Muth, J., Muth, S., and Darrow, W. (1994).
Social networks and infectious disease: The Colorado Springs Study. Social Science and Medicine38(1): 79–88.doi:10.1016/0277-9536(94)90302-6.
doi:10.1111/j.0081-1750.2004.00153.x.
Kossinets, G. (2006). Effects of missing data in social networks. Social Networks28(3): 247–268.doi:10.1016/j.socnet.2005.07.002.
Koumans, E., Farley, T., Gibson, J., Langley, C., Ross, M., McFarlane, M., Braxton, J., and St Louis, M. (2001). Characteristics of persons with syphilis in areas of persist-ing syphilis in the United States: Sustained transmission associated with concurrent partnerships. Sexually Transmitted Diseases28(9): 497–503. doi:10.1097/00007435-200109000-00004.
Krackhardt, D. (1987). Cognitive social structures. Social Networks9(2): 109–134.
doi:10.1016/0378-8733(87)90009-8.
Kretzschmar, M. and Morris, M. (1996). Measures of concurrency in networks and the spread of infectious disease. Mathematical Biosciences 133(2): 165–195.
doi:10.1016/0025-5564(95)00093-3.
Lagarde, E., Schim van der Loeff, M., Enel, C., Holmgren, B., Dray-Spira, R., Pison, G., Piau, J., Delaunay, V., M’Boup, S., Ndoye, I., Coeuret-Pellicer, M., Whittle, H., and Aaby, P. (2003). Mobility and the spread of human immunodeficiency virus into rural areas of West Africa. International Journal of Epidemiology32(5): 744–752.
doi:10.1093/ije/dyg111.
Laumann, E., Marsden, P., and Prensky, D. (1983). The boundary specification problem in network analysis. In: R.S. Burt and M.J. Minor (eds.)Applied Network Analysis: A Methodological Introduction. London: Sage Publications: 18–34.
Liljeros, F., Edling, C.R., Amaral, L.A.N., Stanley, H.E., and Aberg, Y. (2001). The web of human sexual contacts.Nature411(6840): 907–908.doi:10.1038/35082140. Lurie, M., Williams, B., Zuma, K., Mkaya-Mwamburi, D., Garnett, G., Sweat, M.,
Git-telsohn, J., and Karim, S. (2003). Who infects whom? HIV-1 concordance and discor-dance among migrant and non-migrant couples in South Africa. AIDS17(15): 2245– 2252.doi:10.1097/00002030-200310170-00013.
Magruder, J. (2008). Marital shopping and epidemic AIDS. [unpublished manuscript]. Department of Agricultural and Resource Economics, University of California at Berkeley. http://are.berkeley.edu/%7Ejmagruder/research.html.
Moody, J., Morris, M., Adams, J., and Handcock, M. (2003). Epidemic potential in human sexual networks: Connectivity and the development of std cores. [unpublished working paper]. Department of Sociology, Duke University.
Morris, M. (2004). Overview of network survey designs. In: M. Morris (ed.)Network Epidemiology. Oxford: Oxford University Press.doi:10.1093/0199269017.003.0002. Morris, M. and Kretzschmar, M. (1997). Concurrent partnerships and the spread of HIV.
AIDS11(5): 641–648. doi:10.1097/00002030-199705000-00012.
Newman, M.E.J. (2002). Spread of epidemic disease on networks. Physical Review E
66(1): 016128–016139.doi:10.1103/PhysRevE.66.016128.
Nnko, S., Boerma, J.T., Urassa, M., Mwaluko, G., and Zaba, B. (2004). Secre-tive females or swaggering males? An assessment of the quality of sexual part-nership reporting in rural Tanzania. Social Science and Medicine 59(2): 299–310.
doi:10.1016/j.socscimed.2003.10.031.
Padgett, J.F. and Ansell, C.K. (1993). Robust action and the rise of the Medici, 1400– 1434.American Journal of Sociology98(6): 1259–1319.doi:10.1086/230190. Potterat, J.J., Phillips-Plummer, L., Muth, S.Q., Rothenberg, R.B., Woodhouse, D.E.,
Maldonado-Long, T.S., Zimmerman, H.P., and Muth, J.B. (2002). Risk network struc-ture in the early epidemic phase of HIV transmission in Colorado Springs. Sexually Transmitted Infections78(Supplement 1): 159–163.doi:10.1136/sti.78.suppl_1.i159. Potterat, J.J., Zimmerman-Rogers, H., Muth, S.Q., Rothenberg, R.B., Green, D.L., Taylor,
J.E., Bonney, M.S., and White, H.A. (1999). Chlamydia transmission: Concurrency, reproduction number, and the epidemic trajectory. American Journal of Epidemiology
150(12): 1331–1339.
Potterat, J.J., Woodhouse, D.E., Muth, S.Q., Rothenberg, R., Darrow, W.W., Klovdahl, A.S., and Muth, J.B. (2004). Network dynamism: History and lessons of the Colorado Springs study. In: M. Morris (ed.)Network Epidemiology. Oxford: Oxford University Press.
Rothenberg, R.B., Sterk, C., Toomey, K.E., Potterat, J.J., Johnson, D., Schrader, M., and Hatch, S. (1998). Using social network and ethnographic tools to evaluate syphilis transmission. Sexually Transmitted Diseases25(3): 154–160. doi:10.1097/00007435-199803000-00009.
Salganik, M. and Heckathorn, D. (2004). Sampling and estimation in hidden popula-tions using respondent-driven sampling. Sociological Methodology 34(1): 193–240.
doi:10.1111/j.0081-1750.2004.00152.x.
Sampson, S.F. (1969). A novitiate during a period of change: An experimental and case study of relationships. [Unpublished Ph.D. dissertation]. Cornell University.
con-tagion versus marketing effort. American Journal of Sociology106(5): 1409–1435. doi:10.1086/320819.
Wasserman, S. and Faust, K. (1994).Social Network Analysis: Methods and Applications. Cambridge: Cambridge University Press.
Watkins, S.C. (2004). Navigating the AIDS epidemic in rural Malawi. Population and Development Review30(4): 673–705. doi:10.1111/j.1728-4457.2004.00037.x. Watts, D. and Strogatz, S. (1998). Collective dynamics of ‘small-world’ networks.Nature
393: 440–443.doi:10.1038/30918.
Watts, D.J. (1999). Small Worlds: The Dynamics of Networks Between Order and Ran-domness. Princeton Studies in Complexity.
Wawer, M., Gray, R., Sewankambo, N., Serwadda, D., Li, X., Laeyendecker, O., Ki-wanuka, N., Kigozi, G., Kiddugavu, M., Lutalo, T., Nalugoda, F., Wabwire-Mangen, F., Meehan, M., and Quinn, T. (2005). Rates of HIV-1 transmission per coital act, by stage of HIV-1 infection, in Rakai, Uganda. Journal of Infectious Diseases191(9): 1403–1409.doi:10.1086/429411.
White, K. and Watkins, S.C. (2000). Accuracy, stability and reciprocity in infor-mal conversational networks in rural Kenya. Social Networks 22(4): 337–355. doi:10.1016/S0378-8733(00)00030-7.
Whittaker, R. (1999).Island Biogeography. Oxford: Oxford University Press.
World Health Organization (2002). HIV Assays: Operational Characteristics. Report 12: Simple/Rapid Tests, Whole Blood Specimens. Geneva, Switzerland: World Health Organization. Http://www.who.int/diagnostics_laboratory/publications/
hiv_assays_rep_12.pdf.