in the population sciences published by the Max Planck Institute for Demographic Research Konrad-Zuse Str. 1, D-18057 Rostock · GERMANY www.demographic-research.org
DEMOGRAPHIC RESEARCH
VOLUME 21, ARTICLE 2 PAGES 23-64
PUBLISHED 07 JULY 2009
http://www.demographic-research.org/Volumes/Vol21/2/ DOI: 10.4054/DemRes.2009.21.2
Research Article
An application of the variable-r method to
subpopulation growth rates in a 19
thcentury
agricultural population
Corey S. Sparks
© 2009 Corey S. Sparks.
This open-access work is published under the terms of the Creative Commons Attribution NonCommercial License 2.0 Germany, which permits use, reproduction & distribution in any medium for non-commercial purposes, provided the original author(s) and source are given credit.
1 Introduction 24
2 Geographic and cultural background 25
3 Data and methods 32
4 Results 37
5 Conclusions 53
6 Acknowledgments 56
An application of the variable-r method to subpopulation growth
rates in a 19
thcentury agricultural population
Corey S. Sparks1
Abstract
This paper presents an analysis of the differential growth rates of the farming and non-farming segments of a rural Scottish community during the 19th and early 20th centuries using the variable-r method allowing for net migration. Using this method, I find that the farming population of Orkney, Scotland, showed less variability in their reproduction and growth rates than the non-farming population during a period of net population decline. I conclude by suggesting that the variable-r method can be used in general cases where the relative growth of subpopulations or subpopulation reproduction is of interest.
1
1. Introduction
In many areas of the world, the population involved in agriculture is in decline, mainly due to the movement of people to cities and the reorganization of national economies away from agricultural production (Firebaugh 1984; Rhoda 1983; Stambuk 1991; Wenxian and Xiaorong 1989; White 2008). While these changes document macro-level population trends, the micro-level implications of these shifts are that, especially in areas with high concentrations of the population in agricultural production, many farms face failure due to the out-migration of family members to urban areas, financial constraints, or inadequate labor resources (Goldschmidt 1978; Harris and Gilbert 1982; Lobao and Meyer 1995; Meert 2000; Meert et al. 2005; Meyer and Lobao 1997). For farming households to remain sustainable, they must walk a tight demographic line between persistence and failure. This suggests, at least for smallholder agriculture (Netting 1993), that individual families must balance their current and future economic interests by managing fertility and the household consumer/worker ratio, while ensuring an adequate labor supply (Chayanov 1966; Durrenberger 1984; Durrenberger and Tannenbaum 2002; Hammel 2005a, 2005b, 2005c; Van Bavel 2004). This assumes that the family provides much of the household's agricultural labor, an assumption which generally holds for smallholder agriculture, and is especially true in the current setting of the northern islands of Scotland. This pressure is coupled with the need to maintain a household size that is small enough to avoid the negative effects that come with having a high density of persons in the household (Curtis et al. 1993; Desai 1992; Gupta 1997; Hagen et al. 2006; Hagen et al. 2001). For larger commercial farms, this balance is less important because of the reliance on hired labor, and because bigger farms often have a larger capital base that provides a buffer against seasonal hardship. Meanwhile, the non-farming segment of most national populations has tended to grow, especially in urban areas (Bradshaw and Schafer 2000; Firebaugh 1984; Kasarda and Crenshaw 1991), because of the movement of the locus of production away from agriculture to manufacturing and service industries.
population under consideration, and follow with the application of the variable-r method.
2. Geographic and cultural background
This paper deals with the population decline and the shift away from the agricultural sector of the economy that took place on the Orkney archipelago in northeast Scotland during the mid- to late-19th century. These changes may be attributed in large part to the geographic, temporal, and cultural setting of the islands. Figure 1 shows the geographic position of the archipelago. Located at roughly 59˚N 3˚W (the meeting ground of the North Sea and the North Atlantic), the Orkney island group is composed of 20 inhabited islands, as well as many other uninhabited small islands referred to as holms or calves. These 20 islands correspond to a land area of approximately 1,000 square kilometers. The current study focuses on the northern Orkney islands. The total surface area of the northern islands is 177.92 square kilometers, with the six islands of the study area representing less than 20% of the total land area of Orkney proper. The six islands included in the study area are Eday, North Ronaldsay, Papa Westray, Pharay, Sanday, and Westray. These islands were selected from the Orkney archipelago as part of a large multi-year interdisciplinary study of demographic and family history, archaeological settlement patterns, and environmental variation (Jennings et al. 2008; Johnson et al. 2005; Murtha et al. 2008; Sparks 2006; Sparks et al. 2005).
Figure 1: Map showing the location and names of the northern Orkney Islands, Scotland
Scotland displayed similar settlement patterns as Orkney (Dodgshon 1993; Gunnlaugsson 1988).
Beginning in the late 18th century, several major economic changes occurred to the traditional agrarian system that are known to have had dramatic effects on Orkney, even though the demographic details are not yet clear. The first of these periods of change was the 50-year kelp boom, which began around 1780. During this period, several species of seaweed were collected and burned on a commercial scale to make kelp, which provided alkali to the British glass-, soap-, and dye-making industries (Thomson 2001).2 In response to the increased demand for labor in kelp harvesting and processing, the Northern Isles and Orkney as a whole appear to have experienced a near doubling of population within a few decades—a remarkable expansion for what had been up to that time a near-subsistence-level agrarian system with low population levels (Barclay 1965; Thomson 1983). Although part of this population increase was attributable to net immigration, there is evidence that increases in the population may also have involved changes in fertility and mortality patterns for local residents (Anderson and Morse 1993a, 1993b; Bowers 1983; Brennan 1979; Brennan 1983; Brennan et al. 1982; Brennan and Relethford 1983; Thomson 2001). Regrettably, standardized demographic data for this period are rare for the Northern Isles, and for Orkney in general. Thus many of the “facts” of the demography of this period are derived from conjectural accounts, such as the Old Statistical Accounts of Scotland (Barclay 1965; Sinclair 1796).
The kelp boom persisted until 1830, when the British government repealed restrictive tariffs on the importation of high quality alkali from other countries (Thomson 1983). As a result, the price of Orkney kelp collapsed, and the islands entered a period of agricultural stagnation largely reflecting the disincentives to agricultural innovation that had been associated with the kelp boom itself. Little is known about the effects of this sudden economic downturn on the population of Orkney; it is clear, however, that the collapse of the kelp market was followed by some 20 to 30 years of low returns on labor caused primarily by poor land management and a dearth of marketable exports. The modern agricultural improvement movement finally reached the Northern Isles in the mid-19th century, ushering in a period of farm reorganization, enclosure of common pasture, construction of new field drainage systems, and general intensification of agricultural production (Schrank 1995; Thomson 2001). This period was again accompanied by population increases, although growth was nowhere near as rapid as during the early stages of the kelp boom. The period of agricultural expansion continued until about 1880, when the prices of Orkney cattle and grain exports experienced another sudden downturn owing to competition from overseas, mainly North America and Australia (Thomson 2001). Because of the ensuing
agricultural depression, Orkney entered a prolonged period of population decline caused by increased out-migration to mainland Scotland, Canada, the United States, Australia, and New Zealand. The increase in migration associated with this same agricultural depression in other parts of the British Isles has been the subject of some research (Pooley and Turnbull 1998), but detailed information on the north of Scotland in general (Anderson and Morse 1993a, 1993b; Flinn 1977; Lumb 1980; Stockdale et al. 2000), and Orkney in particular (Barclay 1965; Forsythe 1980; Lee 2007), is often sparse. We know that migration in Orkney was both a demographic fact and a life course decision faced by many young men and women. Owing to early steam liner access to the Northern Isles and the fishing and sailing traditions of the Orcadians, many unmarried men (and women) sought paid work away from the farms on which they had been born and raised (Lumb 1980; Miller 1999; Thomson 2001). Migration was seasonal, temporary, or permanent; and while the net effects of migration show up as additions or subtractions of people between censuses, the intricacies of the migration experience often cannot be estimated. Seasonal migration would have been a way of life for the Orcadians, as they have often been described as “farmers with boats” who would have been prepared to travel long distances to participate in whaling and herring fishing (Miller 1999).
Temporary migration was regularly practiced in the Orkney archipelago, as census records for the various islands of Orkney indicate relatively high fractions of residents that were born on other islands in Orkney, but were living away from home for work reasons. For example, between 1851 and 1901 an average of 9% of residents of the Northern Isles of Orkney were from another one of the Northern Isles, and another 8% were from somewhere outside of Orkney. Permanent migration out of Orkney was common, but just how common is unknown.
Figure 2a-b: Population size of the northern Orkney islands, Scotland, 1851 to 1901, and proportionate distribution of population size for each island in the area
The population as a whole has declined substantially since the 19th century, though Westray and Sanday were and continue to be the largest communities within the Northern Isles. The questions asked in the current analysis are as follows: First, did the farming segment of the population manage to sustain itself demographically during the period of population growth and initial decline? Second, is the decline primarily attributable to the loss of landless households that were never able to secure their livelihoods as farmers?
production, or as a partial means of covering rent to a larger land owner. In contrast, I assume the “non-farming” segment of the population is employed by and large in activities not related to household agricultural production. This includes more professional occupations, such as teachers, merchants, smiths, and clergy; but also general and agricultural laborers. The latter occupation is assumed not to be working toward the household’s account, but instead toward the account of another household or large landowner. This distinction between the farming and non-farming segments of the population is made for two reasons. First, the farming population is assumed to be more “native,” or to have deeper ties to the area, and to have a stronger need to retain the sustainability of their families so that land (or access to land) may be passed down from generation to generation. This, I argue, is key to the need to maintain a balanced pace of reproduction and child survival for this segment of the population (see below). Second, the non-farming segment of the population is composed of households whose members are less likely to share the deep community connections that the farming population does. Given this detachment from the community, they are more likely to be influenced in their behaviors by swings in the labor market, less likely to be interested in maintaining a favorable ratio of household producers to consumers, and more likely to emigrate when market conditions are unfavorable.
an effort to ensure their survival to adulthood. In turn, by increasing the likelihood that each child would live to adulthood, they improved the odds of keeping the land they had, and increased the chances that they would be able to acquire more. On the reproductive side of the equation, it appears that the families chose not to have a large number of children, as they were aware that having too many offspring would consume resources that could decrease the potential income they could use to rent and eventually purchase more land. At this point, direct evidence of intentional spacing of births is lacking—a general lament of scientists studying historical populations. However, recent work has shown theoretically how and why such spacing could occur in such populations (Van Bavel 2004, 2007; Van Bavel and Kok 2004).
A preliminary analysis based on record linkage procedures using vital registration information on marriages, births, and deaths has suggested there were some problems in the data. One apparent problem of concern is the reliability of the vital registration data, especially concerning infant deaths and incomplete linkage due to out-migration prior to death or marriage. Specifically under-enumeration of infant deaths was suspected, as mortality rates under age one were very low, and estimates of life expectancy at birth were in the mid-sixties in the mid-19th century. The fact remains that, as is the case with any study using historical vital registration data, one has to cope with the possibility that both birth and death registration may be flawed, especially in remote areas such as Orkney. In hopes of avoiding some of these data problems, I employ the variable-r method. This method is selected because it was originally derived for use in estimating demographic parameters in situations where the ideal data do not exist (Cai 2008; Preston and Coale 1982; Preston and Wang 2007) from “more reliable” sources, such as census enumerations and fertility surveys. Still, some doubt must exist when historical data are used, as many factors may combine to introduce discrepancies in the data. However, based on facts I have stated above, I believe that the census enumerations in this case provide good “snap shots” of the population of the Northern Isles. As for the reliability of the birth registration, there is some doubt that there was 100% registration of births. But because the communities in this analysis are rather small in area, and because each community in the study area had its own local registrar of vital events, I suspect that the birth records may be representative of the actual number of births. I have constructed a database of census enumerations, marriage records, and birth registrations for Orkney with the goal of providing the necessary data to use the variable-r method, while avoiding the problematic data (notably, enumerations of infant deaths).
segments of the population: the population in farming households and those involved in other forms of work. I hypothesize that, because of the previously observed advantage in terms of child survival and birth spacing in farm families, the farm population should display a more stable pattern of reproduction and survivorship (as measured in a net fashion by the NRR) than the non-farm segment of the population. I also hypothesize that the non-farm segment of the population will display a higher degree of variability in its reproductive pattern because of that population's tendency to follow cycles in the local labor market. At the same time, however, I also have to account for the possibility that not everyone within a farm household would have been directly involved in agricultural labor, and that those in non-farm households would not have participated in agriculture. Based upon my fieldwork in this area, I can confirm that it is very much the case that members of families who are actively farming tend to be devoted to agricultural production, while younger members of non-farm families are much more flexible in their activities, and generally only participate in agriculture directly if a close relative is in need of temporary labor. Moreover, it has been the rule rather than the exception that farming families also extensively engage in non-farm work in order to maximize potential income: one of the primary sources of income in the early 20th century for farm families and non-farm families alike was the production of eggs, which often brought in enough cash income to allow families to purchase more farm land (Thomson 2001). Additionally, as in many areas where smallholder agriculture dominates small farms, family members in Orkney often participate in off-farm labor to earn cash income. Indeed, it is difficult to find a smallholder economy in which farmers are agricultural purists (Netting 1993). But, as is also the case in other societies in which smallholding dominates agricultural production, those families who are able to gain access to agricultural land tend to pass it down through inheritance, rather than sell the land to non-family members or outsiders. It is the latter situation that I believe is operating in Orkney. In the analysis that follows, I attempt to determine if the farming population showed signs of demographic sustainability during a dynamic portion of the area’s history.
3. Data and methods
1986; Preston and Wang 2007), and for estimation of more informative quantities from less-than-ideal data sources. The variable-r method allows for the estimation of the NRR, typically given as
( ) ( )amada p = NRR
∫
β
α (1)
with p(a) being the probability that a woman survives to age a, m(a) being the rate at which women age a have daughters, and the integral being over all ages of childbearing, typically 15 to 45. Preston and Coale (1982) show how to estimate the NRR from two successive age distributions and the distribution of mother's ages at childbirth, referred to as v(a). They proceed to show the NRR can be calculated as:
∫
∫ =β α da e a v NRR a dx x r 0 ) ( ) ( (2)where r(x) is the age-specific growth rate at each age x. The age-specific growth rates act effectively to capture all the effects of mortality and fertility over the time interval (Horiuchi and Preston 1988).
In the present analysis, I apply the modified procedure outlined in Preston and Wang (2007) to estimate the NRR in the presence of migration. This quantity, referred to as NRR*, is the NRR in the presence of migration. As Preston and Wang (2007) show, migration can substantially increase or decrease the NRR, depending on whether the area is a migrant receiving or sending area. They go on to show that NRR* is calculated as
∫
=β α da a m a p ap( ) *( ) ( ) *
NRR (3)
where p*(a) is the proportionate increase or decrease in a cohort as the result of age-specific migration. The net effect of migration is then represented in the same way as the effects of fertility and mortality. Using their methodology, my equation (2), is then modified to be:
∫
∫ =β α da e a v NRR a dx x r 0 ) ( ) (because, as Preston and Wang show, the term inside the integral in (3) represents the terms inside the integral in (4):
∫ = a dx x r e a v a m a p a p 0 ) ( ) ( ) ( ) ( ) (
* (5)
which can be interpreted as the proportion of births to women age a, times the relative size of the population at age a (Preston and Wang 2007).
In practice, I approximate equation (4) by discrete summations over five-year age categories, centered on the midpoint of the interval (Coale 1984; Preston 1983; Preston and Coale 1982; Preston and Wang 2007). As the variable-r method has been shown to be sensitive to errors in age misreporting, I use five-year intervals in hopes of avoiding some of these prospective errors. In this analysis I am primarily concerned with the relative values of the NRR* for the two subpopulations in the analysis. Additional errors from under-reporting are known to cause problems for the variable-r method. Given the small scale of the populations under consideration in this analysis, variation in geographic coverage is less of a concern than seasonal migration away from the islands in the study. Emigration from Orkney is known to have been relatively steady beginning in the mid-19th century, but we do not know the exact volume of the out-migration over this period. However, previous work suggests that the Northern Isles, and other similar areas of rural Scotland, lost a large proportion of their populations between 1851 and 2001 (Lumb, 1980; Thomson 2001). I use the modification in (4) primarily because I expect age-specific migration to affect the NRR*, but also in order to vary between the farming and non-farming segments of the population.
present the distribution of the IPUMS codes for household head occupations in Table 1 to show the variety of occupations present in the non-farm segment of the population. While in general the farm/non-farm occupation classification seems restrictive, especially for Orkney, this classification is necessary to estimate the age-specific growth rates and the NRR* for the two segments of the population described above.
Table 1: Distribution of household head occupations by farming and non-farming household definitions
Occupation Class Year
1851 1861 1871 1881 1891 1901
Farming Households
Farmers/Crofters/Farm Managers 581 627 649 643 589 634
Total % of Households 51.3 53.6 57.1 58.0 57.9 63.8
Non-farming Households
Laborers 150 110 114 101 114 75
Agricultural Laborers 182 168 153 146 105 89
Service Workers (non-household) 5 8 2 6 4 11
Service Workers (household) 7 9 3 8 12 9
Operatives 74 72 68 54 34 29
Craftsmen 89 128 102 91 97 93
Sales Workers 15 14 19 21 26 17
Clerical and Kindred Workers 1 4 1 4
Managers, Officials, Proprietors 3 4 2 4 8 6
Professional/ Technical 27 28 25 30 27 26
Total % of Households 48.7 46.4 42.9 42.0 42.1 36.2
of households were listed as having married female household heads, suggesting seasonal migration will not be a major factor in the analysis.
To estimate the v(a) quantity in (2), I use vital registration data collected from the General Registrar's Office of Scotland on births that were subsequently linked to the marriages that produced them using standard record linkage criteria (Fure 2000; Hautaniemi et al. 2000; Wrigley 1973). This linkage procedure produced a linkage rate of 76%; i.e., 76% of births between 1855 and 1901 could be linked to the correct marriage. The primary reason why births could not in some cases be linked to a marriage was that the marriage took place outside of Orkney, and the record could not be located. This of course produces an interesting situation in which there could be missing births to non-farm or farming migrants, and the linkage process would miss these. For each birth, the age of the mother was calculated as the year of the child’s birth minus the year of the mother’s birth, which was obtained from her marriage registration. Mother’s ages were then lumped into five-year intervals to match the same ages as the census data. Finally, since the vital registration of births did not begin until 1855, the period 1851 to 1854 has no data for this analysis; instead, I use the distribution of births between 1855 and 1861 to calculate the v(a) function for this time period. This produced fewer births to use in the calculation of v(a) for the 1851 to 1861 period, and the ages of the mothers were found to be lower on average than the ages of mothers in the other decades. While this may be a data bias problem, it may also be a representation of younger mean ages at childbearing at this time.
The farm/non-farm classifications for each birth (and subsequently for each mother at the time of the birth) were generated in the same way as the census classifications. If the child's father's occupation on the birth record was listed as farmer or crofter, the birth was classified as belonging to the farm segment of the population; otherwise, the birth was classified as a non-farm birth. While most families maintained the same occupational classification throughout their childbearing history, it was possible for a family to change classifications; thus a family could contribute births to both the farm and non-farm segments. Based on the subdivision of the population into two categories, the resulting age and subpopulation specific growth rates are calculated as:
( )
(
( )
)
h t a, N h + t a, N = a r i i i 1ln ⎟⎟∗
⎠ ⎞ ⎜⎜ ⎝ ⎛ (6)
which is essentially the same as the methodology in Preston and Wang (2007), with the only difference being that I use five-year age intervals and 10-year census intervals, while those authors used five-year intervals for both age and time.
4. Results
Figure 3 provides the population sizes over the period 1851 to 1901 for the northern Orkney isles. In terms of total size, both segments of the population declined over the period 1851 to 1901, with the non-farm population first increasing then decreasing, and the farm population showing a bit more of a cyclical fluctuation. Based on estimates of the crude birth and death rates for this period, the population of the archipelago would have grown on average by 1.23% if we were to consider the population closed. However, as seen in Figure 2a, it is obvious that emigration led to general decline in both segments of the population.
Farm and non-farm age-specific growth rates and total annual growth rates are presented in Figures 4a-f. These figures provide the estimated age-specific growth rates for the farm and non-farm segments of the total population, as estimated via equation (6). To aid in the interpretation of the figures, I include a baseline for 0% annual growth and vertical lines showing the childbearing segments of the population.
Figure 4a-f: Age-specific growth rates, ri(x), and total annual growth rates, r, for
population shows significantly less variability (F ratio = 0.558, p=.006) than the non-farm population.
The age-specific growth rates for the female segment of the population are shown in Figures 5a-f.
Figure 5a-f: Age-specific growth rates, ri(x), and total annual growth rates, r, for
Generally, the patterns of age-specific growth for the female population mirror those of the total population, with an overall trend of slightly more variable patterns of growth as seen in Figure 5f. If the variance in the female age-specific growth patterns of the farm and non-farm populations are compared using a standard F ratio, the farm population shows significantly less variability in the patterns of growth (F ratio = 0.498, p=.001).
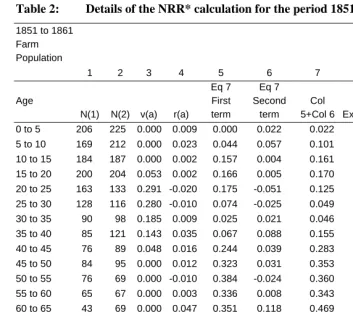
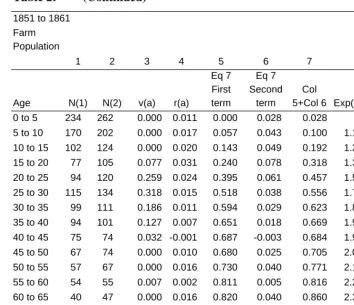
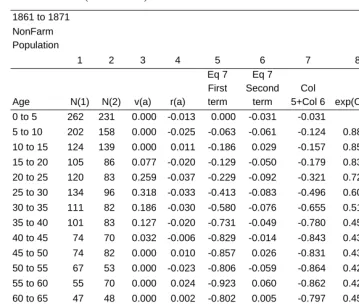
Details of the NRR* calculations are provided in Tables 2 through 6, with the first table providing calculations for the period 1851 to 1861, and each subsequent table offering the calculations for the next decade, ending with the calculations for 1891-1901 in Table 5. The columns in these tables correspond to the steps taken in the calculation. Column 1 is the observed female age distribution of each segment of the population at the beginning of the interval (in Table 1, N(1) is the population in 1851). Column 2 is the observed female age distribution at the end of the interval (in Table 1, N(2) is the observed age distribution in 1861). Column 3 is the distribution of births by age of mother, v(a), and is calculated from the observed distribution of births by age of mother between the periods given in the first line of the table (e.g., 1851 to 1861). Column 4 is the age-specific growth rate for age a calculated using equation (6). To approximate the integral in equation (4), I employ the same approximation as others (Cai 2008; Preston and Wang 2007), using discrete intervals and “locating” the observation of the current interval at the midpoint of the interval. This is done using the equation
a a
= a
a + r
r 5
5
0
5 ⋅5 2.5⋅
∑
− (7)Table 2: Details of the NRR* calculation for the period 1851 to 1861.†
1851 to 1861 Farm
Population
1 2 3 4 5 6 7 8 9
Age
N(1) N(2) v(a) r(a) Eq 7 First term
Eq 7 Second
term
Col
5+Col 6 Exp(Col 7)
Contribution to NRR*
0 to 5 206 225 0.000 0.009 0.000 0.022 0.022 1.022 0.000
5 to 10 169 212 0.000 0.023 0.044 0.057 0.101 1.106 0.000
10 to 15 184 187 0.000 0.002 0.157 0.004 0.161 1.175 0.000
15 to 20 200 204 0.053 0.002 0.166 0.005 0.170 1.186 0.063
20 to 25 163 133 0.291 -0.020 0.175 -0.051 0.125 1.133 0.330
25 to 30 128 116 0.280 -0.010 0.074 -0.025 0.049 1.050 0.295
30 to 35 90 98 0.185 0.009 0.025 0.021 0.046 1.047 0.194
35 to 40 85 121 0.143 0.035 0.067 0.088 0.155 1.168 0.167
40 to 45 76 89 0.048 0.016 0.244 0.039 0.283 1.327 0.063
45 to 50 84 95 0.000 0.012 0.323 0.031 0.353 1.424 0.000
50 to 55 76 69 0.000 -0.010 0.384 -0.024 0.360 1.433 0.000
55 to 60 65 67 0.000 0.003 0.336 0.008 0.343 1.410 0.000
60 to 65 43 69 0.000 0.047 0.351 0.118 0.469 1.599 0.000
65 to 70 43 48 0.000 0.011 0.587 0.028 0.615 1.850 0.000
70 to 75 45 32 0.000 -0.034 0.642 -0.085 0.557 1.746 0.000
75 to 80 16 27 0.000 0.052 0.472 0.131 0.603 1.827 0.000
80+ 27 18 0.000 -0.041 0.734 -0.101 0.632 1.882 0.000
#Births
Table 2: (Continued)
1851 to 1861 Farm Population
1 2 3 4 5 6 7 8 9
Age N(1) N(2) v(a) r(a)
Eq 7 First term
Eq 7 Second
term Col
5+Col 6 Exp(Col 7)
Contribution to NRR*
0 to 5 234 262 0.000 0.011 0.000 0.028 0.028 0.000
5 to 10 170 202 0.000 0.017 0.057 0.043 0.100 1.105 0.000
10 to 15 102 124 0.000 0.020 0.143 0.049 0.192 1.211 0.000
15 to 20 77 105 0.077 0.031 0.240 0.078 0.318 1.374 0.106
20 to 25 94 120 0.259 0.024 0.395 0.061 0.457 1.579 0.409
25 to 30 115 134 0.318 0.015 0.518 0.038 0.556 1.743 0.555
30 to 35 99 111 0.186 0.011 0.594 0.029 0.623 1.864 0.347
35 to 40 94 101 0.127 0.007 0.651 0.018 0.669 1.953 0.249
40 to 45 75 74 0.032 -0.001 0.687 -0.003 0.684 1.981 0.063
45 to 50 67 74 0.000 0.010 0.680 0.025 0.705 2.024 0.000
50 to 55 57 67 0.000 0.016 0.730 0.040 0.771 2.161 0.000
55 to 60 54 55 0.007 0.002 0.811 0.005 0.816 2.260 0.015
60 to 65 40 47 0.000 0.016 0.820 0.040 0.860 2.364 0.000
65 to 70 39 36 0.000 -0.008 0.901 -0.020 0.881 2.413 0.000
70 to 75 30 24 0.000 -0.022 0.861 -0.056 0.805 2.237 0.000
75 to 80 25 32 0.000 0.025 0.749 0.062 0.811 2.250 0.000
80+ 16 13 0.000 -0.021 0.873 -0.052 0.821 2.272 0.000
#Births
150 NRR 1.744
†
The births for the v(a) calculations in this table were from 1855 to 1861, not 1851 to 1861, since vital registration did not begin until 1855.
Table 3: Details of the NRR* calculation for the period 1861 to 1871
1861 to 1871 Farm Population
1 2 3 4 5 6 7 8 9
Age
N(1) N(2) v(a) r(a) Eq 7 First term
Eq 7 Second
term
Col
5+Col 6 exp(Col 7)
Contribution to NRR*
0 to 5 225 216 0.000 -0.004 0.000 -0.010 -0.010 0.000
5 to 10 212 222 0.000 0.005 -0.020 0.012 -0.009 0.991 0.000
10 to 15 187 218 0.000 0.015 0.003 0.038 0.041 1.042 0.000
15 to 20 204 200 0.053 -0.002 0.079 -0.005 0.074 1.077 0.057
20 to 25 133 126 0.291 -0.005 0.069 -0.014 0.056 1.058 0.308
25 to 30 116 108 0.280 -0.007 0.042 -0.018 0.025 1.025 0.287
30 to 35 98 85 0.185 -0.014 0.007 -0.036 -0.029 0.971 0.180
35 to 40 121 111 0.143 -0.009 -0.064 -0.022 -0.086 0.918 0.131
40 to 45 89 100 0.048 0.012 -0.108 0.029 -0.078 0.925 0.044
45 to 50 95 114 0.000 0.018 -0.049 0.046 -0.004 0.996 0.000
50 to 55 69 83 0.000 0.018 0.042 0.046 0.088 1.092 0.000
55 to 60 67 84 0.000 0.023 0.134 0.057 0.191 1.210 0.000
60 to 65 69 60 0.000 -0.014 0.247 -0.035 0.212 1.237 0.000
65 to 70 48 56 0.000 0.015 0.177 0.039 0.216 1.241 0.000
70 to 75 32 57 0.000 0.058 0.254 0.144 0.399 1.490 0.000
75 to 80 27 27 0.000 0.000 0.543 0.000 0.543 1.721 0.000
80+ 18 19 0.000 0.005 0.543 0.014 0.557 1.745 0.000
#Births
Table 3: (Continued)
1861 to 1871 NonFarm Population
1 2 3 4 5 6 7 8 9
Age N(1) N(2) v(a) r(a)
Eq 7 First term
Eq 7 Second
term
Col
5+Col 6 exp(Col 7)
Contribution to NRR*
0 to 5 262 231 0.000 -0.013 0.000 -0.031 -0.031 0.000
5 to 10 202 158 0.000 -0.025 -0.063 -0.061 -0.124 0.883 0.000
10 to 15 124 139 0.000 0.011 -0.186 0.029 -0.157 0.854 0.000
15 to 20 105 86 0.077 -0.020 -0.129 -0.050 -0.179 0.836 0.065
20 to 25 120 83 0.259 -0.037 -0.229 -0.092 -0.321 0.726 0.188
25 to 30 134 96 0.318 -0.033 -0.413 -0.083 -0.496 0.609 0.194
30 to 35 111 82 0.186 -0.030 -0.580 -0.076 -0.655 0.519 0.097
35 to 40 101 83 0.127 -0.020 -0.731 -0.049 -0.780 0.458 0.058
40 to 45 74 70 0.032 -0.006 -0.829 -0.014 -0.843 0.430 0.014
45 to 50 74 82 0.000 0.010 -0.857 0.026 -0.831 0.436 0.000
50 to 55 67 53 0.000 -0.023 -0.806 -0.059 -0.864 0.421 0.000
55 to 60 55 70 0.000 0.024 -0.923 0.060 -0.862 0.422 0.000
60 to 65 47 48 0.000 0.002 -0.802 0.005 -0.797 0.451 0.000
65 to 70 36 42 0.000 0.015 -0.792 0.039 -0.753 0.471 0.000
70 to 75 24 31 0.000 0.026 -0.715 0.064 -0.651 0.522 0.000
75 to 80 32 25 0.000 -0.025 -0.587 -0.062 -0.648 0.523 0.000
80+ 18 27 0.000 0.041 -0.710 0.101 -0.609 0.544 0.000
#Births
220 NRR 0.615
Table 4: Details of the NRR* calculation for the period 1871 to 1881
1871 to 1881 Farm Population
1 2 3 4 5 6 7 8 9
Age
N(1) N(2) v(a) r(a)
Eq 7 First term
Eq 7 Second
term Col
5+Col 6 exp(Col 7)
Contribution to NRR*
0 to 5 216 192 0.000 -0.012 0.000 -0.029 -0.029 0.000
5 to 10 222 212 0.000 -0.005 -0.059 -0.012 -0.070 0.932 0.000
10 to 15 218 177 0.000 -0.021 -0.082 -0.052 -0.134 0.875 0.000
15 to 20 200 199 0.022 -0.001 -0.186 -0.001 -0.187 0.829 0.018
20 to 25 126 125 0.172 -0.001 -0.189 -0.002 -0.191 0.826 0.142
25 to 30 108 110 0.216 0.002 -0.193 0.005 -0.188 0.829 0.179
30 to 35 85 87 0.269 0.002 -0.183 0.006 -0.178 0.837 0.225
35 to 40 111 100 0.251 -0.010 -0.172 -0.026 -0.198 0.820 0.206
40 to 45 100 89 0.057 -0.012 -0.224 -0.029 -0.253 0.776 0.044
45 to 50 114 100 0.013 -0.013 -0.282 -0.033 -0.315 0.730 0.010
50 to 55 83 78 0.000 -0.006 -0.348 -0.016 -0.363 0.695 0.000
55 to 60 84 97 0.000 0.014 -0.379 0.036 -0.343 0.710 0.000
60 to 65 60 62 0.000 0.003 -0.307 0.008 -0.299 0.742 0.000
65 to 70 56 59 0.000 0.005 -0.290 0.013 -0.277 0.758 0.000
70 to 75 57 37 0.000 -0.043 -0.264 -0.108 -0.372 0.689 0.000
75 to 80 27 30 0.000 0.011 -0.480 0.026 -0.454 0.635 0.000
80+ 19 18 0.000 -0.005 -0.428 -0.014 -0.441 0.643 0.000
#Births
Table 4: (Continued)
1871 to 1881 NonFarm Population
1 2 3 4 5 6 7 8 9
Age
N(1) N(2) v(a) r(a)
Eq 7 First term
Eq 7 Second
term Col
5+Col 6 exp(Col 7)
Contribution to NRR*
0 to 5 231 199 0.000 -0.015 0.000 -0.037 -0.037 0.000
5 to 10 158 160 0.000 0.001 -0.075 0.003 -0.071 0.931 0.000
10 to 15 139 118 0.000 -0.016 -0.068 -0.041 -0.109 0.897 0.000
15 to 20 86 85 0.080 -0.001 -0.150 -0.003 -0.153 0.858 0.068
20 to 25 83 85 0.229 0.002 -0.156 0.006 -0.150 0.861 0.197
25 to 30 96 88 0.276 -0.009 -0.144 -0.022 -0.166 0.847 0.234
30 to 35 82 79 0.236 -0.004 -0.188 -0.009 -0.197 0.821 0.194
35 to 40 83 77 0.120 -0.008 -0.206 -0.019 -0.225 0.799 0.096
40 to 45 70 57 0.056 -0.021 -0.244 -0.051 -0.295 0.744 0.042
45 to 50 82 57 0.003 -0.036 -0.346 -0.091 -0.437 0.646 0.002
50 to 55 53 57 0.000 0.007 -0.528 0.018 -0.510 0.600 0.000
55 to 60 70 44 0.000 -0.046 -0.492 -0.116 -0.608 0.544 0.000
60 to 65 48 53 0.000 0.010 -0.724 0.025 -0.699 0.497 0.000
65 to 70 42 38 0.000 -0.010 -0.675 -0.025 -0.700 0.497 0.000
70 to 75 31 39 0.000 0.023 -0.725 0.057 -0.667 0.513 0.000
75 to 80 25 21 0.000 -0.017 -0.610 -0.044 -0.653 0.520 0.000
80+ 27 7 0.000 -0.135 -0.697 -0.337 -1.034 0.355 0.000
#Births
301 NRR 0.833
Table 5: Details of the NRR* calculation for the period 1881 to 1891.
1881 to 1891 Farm Population
1 2 3 4 5 6 7 8 9
Age N(1) N(2) v(a) r(a)
Eq 7 First term
Eq 7 Second
term
Col
5+Col 6 exp(Col 7)
Contribution to NRR*
0 to 5 192 157 0.000 -0.020 0.000 -0.050 -0.050 0.000
5 to 10 212 167 0.000 -0.024 -0.101 -0.060 -0.160 0.852 0.000
10 to 15 177 190 0.000 0.007 -0.220 0.018 -0.202 0.817 0.000
15 to 20 199 190 0.031 -0.005 -0.184 -0.012 -0.196 0.822 0.026
20 to 25 125 116 0.145 -0.007 -0.208 -0.019 -0.226 0.797 0.115
25 to 30 110 107 0.245 -0.003 -0.245 -0.007 -0.252 0.777 0.191
30 to 35 87 100 0.226 0.014 -0.259 0.035 -0.224 0.799 0.181
35 to 40 100 90 0.176 -0.011 -0.189 -0.026 -0.216 0.806 0.142
40 to 45 89 94 0.151 0.005 -0.242 0.014 -0.228 0.796 0.120
45 to 50 100 94 0.025 -0.006 -0.215 -0.015 -0.230 0.795 0.020
50 to 55 78 74 0.000 -0.005 -0.245 -0.013 -0.259 0.772 0.000
55 to 60 97 83 0.000 -0.016 -0.272 -0.039 -0.311 0.733 0.000
60 to 65 62 63 0.000 0.002 -0.350 0.004 -0.346 0.708 0.000
65 to 70 59 64 0.000 0.008 -0.342 0.020 -0.321 0.725 0.000
70 to 75 37 45 0.000 0.020 -0.301 0.049 -0.252 0.777 0.000
75 to 80 30 32 0.000 0.006 -0.203 0.016 -0.187 0.829 0.000
80+ 18 26 0.000 0.037 -0.171 0.092 -0.079 0.924 0.000
#Births
Table 5: (Continued)
1881 to 1891 NonFarm Population
1 2 3 4 5 6 7 8 9
Age
N(1) N(2) v(a) r(a) Eq 7 First term
Eq 7 Second
term Col 5+Col 6 exp(Col 7)
Contribution to NRR*
0 to 5 199 181 0.000 -0.009 0.000 -0.024 -0.024 0.000
5 to 10 160 102 0.000 -0.045 -0.047 -0.113 -0.160 0.852 0.000
10 to 15 118 112 0.000 -0.005 -0.273 -0.013 -0.286 0.752 0.000
15 to 20 85 88 0.070 0.003 -0.299 0.009 -0.290 0.748 0.053
20 to 25 85 62 0.238 -0.032 -0.281 -0.079 -0.360 0.698 0.166
25 to 30 88 77 0.256 -0.013 -0.439 -0.033 -0.472 0.624 0.159
30 to 35 79 76 0.225 -0.004 -0.506 -0.010 -0.515 0.597 0.134
35 to 40 77 70 0.154 -0.010 -0.525 -0.024 -0.549 0.578 0.089
40 to 45 57 56 0.057 -0.002 -0.573 -0.004 -0.577 0.561 0.032
45 to 50 57 48 0.000 -0.017 -0.582 -0.043 -0.625 0.535 0.000
50 to 55 57 47 0.000 -0.019 -0.668 -0.048 -0.716 0.489 0.000
55 to 60 44 53 0.000 0.019 -0.764 0.047 -0.717 0.488 0.000
60 to 65 53 38 0.000 -0.033 -0.671 -0.083 -0.754 0.470 0.000
65 to 70 38 32 0.000 -0.017 -0.837 -0.043 -0.880 0.415 0.000
70 to 75 39 22 0.000 -0.057 -0.923 -0.143 -1.066 0.344 0.000
75 to 80 21 23 0.000 0.009 -1.210 0.023 -1.187 0.305 0.000
80+ 7 10 0.000 0.036 -1.164 0.089 -1.075 0.341 0.000
#Births
227 NRR 0.633
Table 6: Details of the NRR* calculation for the period 1891 to 1901
1891 to 1901 Farm Population
1 2 3 4 5 6 7 8 9
Age
N(1) N(2) v(a) r(a) Eq 7 First term
Eq 7 Second
term
Col
5+Col 6 exp(Col 7)
Contribution to NRR*
0 to 5 157 142 0.000 -0.010 0.000 -0.025 -0.025 0.000
5 to 10 167 126 0.000 -0.028 -0.050 -0.070 -0.121 0.886 0.000
10 to 15 190 155 0.000 -0.020 -0.191 -0.051 -0.242 0.785 0.000
15 to 20 190 137 0.048 -0.033 -0.293 -0.082 -0.375 0.688 0.033
20 to 25 116 123 0.134 0.006 -0.456 0.015 -0.442 0.643 0.086
25 to 30 107 115 0.230 0.007 -0.427 0.018 -0.409 0.664 0.153
30 to 35 100 78 0.246 -0.025 -0.391 -0.062 -0.453 0.636 0.156
35 to 40 90 90 0.251 0.000 -0.515 0.000 -0.515 0.597 0.150
40 to 45 94 100 0.080 0.006 -0.515 0.015 -0.500 0.607 0.049
45 to 50 94 103 0.011 0.009 -0.484 0.023 -0.461 0.630 0.007
50 to 55 74 85 0.000 0.014 -0.439 0.035 -0.404 0.668 0.000
55 to 60 83 84 0.000 0.001 -0.369 0.003 -0.366 0.693 0.000
60 to 65 63 64 0.000 0.002 -0.363 0.004 -0.359 0.698 0.000
65 to 70 64 69 0.000 0.008 -0.355 0.019 -0.337 0.714 0.000
70 to 75 45 51 0.000 0.013 -0.318 0.031 -0.287 0.751 0.000
75 to 80 32 40 0.000 0.022 -0.255 0.056 -0.199 0.819 0.000
80+ 26 35 0.000 0.030 -0.144 0.074 -0.069 0.933 0.000
#Births
Table 6: (Continued)
1891 to 1901 NonFarm Population
1 2 3 4 5 6 7 8 9
Age
N(1) N(2) v(a) r(a) Eq 7 First term
Eq 7 Second
term
Col
5+Col 6 exp(Col 7)
Contribution to NRR*
0 to 5 181 111 0.000 -0.049 0.000 -0.122 -0.122 0.000
5 to 10 102 95 0.000 -0.007 -0.244 -0.018 -0.262 0.769 0.000
10 to 15 112 78 0.000 -0.036 -0.280 -0.090 -0.370 0.690 0.000
15 to 20 88 59 0.082 -0.040 -0.461 -0.100 -0.561 0.571 0.047
20 to 25 62 70 0.203 0.012 -0.661 0.030 -0.630 0.532 0.108
25 to 30 77 64 0.258 -0.018 -0.600 -0.046 -0.646 0.524 0.135
30 to 35 76 60 0.264 -0.024 -0.693 -0.059 -0.752 0.472 0.124
35 to 40 70 49 0.137 -0.036 -0.811 -0.089 -0.900 0.407 0.056
40 to 45 56 38 0.055 -0.039 -0.989 -0.097 -1.086 0.338 0.019
45 to 50 48 53 0.000 0.010 -1.183 0.025 -1.158 0.314 0.000
50 to 55 47 40 0.000 -0.016 -1.133 -0.040 -1.174 0.309 0.000
55 to 60 53 31 0.000 -0.054 -1.214 -0.134 -1.348 0.260 0.000
60 to 65 38 39 0.000 0.003 -1.482 0.006 -1.476 0.229 0.000
65 to 70 32 32 0.000 0.000 -1.469 0.000 -1.469 0.230 0.000
70 to 75 22 22 0.000 0.000 -1.469 0.000 -1.469 0.230 0.000
75 to 80 23 22 0.000 -0.004 -1.469 -0.011 -1.480 0.228 0.000
80+ 10 9 0.000 -0.011 -1.492 -0.026 -1.518 0.219 0.000
#Births
182 NRR 0.489
B=# of births.
Figure 6: Estimates of the net reproduction rate accounting for migration (NRR*) for the farm and non-farm segments of the population of the northern Orkney islands, 1851 to 1901
v(a) for the period 1891 to 1901 into the calculations for the period 1851 to 1861. The use of this v(a) distribution changes the NRR* of the 1851 to 1861 period slightly, with the non-farm NRR* increasing to 1.768 (an increase of 1.3% ) and the farm NRR* increasing to 1.123 (a change of just over 1%). This suggests that the general pattern of the NRR* for this period is relatively stable with respect to the value of v(a) calculated from these marriages, despite the younger average age at marriage for these mothers.
5. Conclusions
The goal of this paper was to examine the relative growth rates for the farming and non-farming segments of the population of the northern Orkney islands, Scotland, over the period 1851 to 1901 using age-specific growth rates and the variable-r method for estimating the NRR*. At the end of the 19th century, the entire population of the islands was in sustained decline, mostly due to emigration to foreign labor markets. However, the intention of this paper was to assess whether the farming population was reproducing itself at a more stable rate compared to the non-farm population over this period of population change. The “conserved” nature of the growth was thought to be indicative of a higher degree of population sustainability for the farming population of the Northern Isles. When I suggest that the farming population exhibited a “conserved” growth pattern, I am referring to the relative stability of the farming population. In particular, the farming population exhibited a marginally positive growth rate relative to the non-farming segment of the population over the mid- to late-19th century. I argue that this stability is the result of a complex interaction between birth spacing and lower infant and childhood mortality. My findings also appear to indicate that, while completed family sizes may have been larger in farming families, the effects of birth spacing and reduced infant and childhood mortality could have led to a better demographic balance for these households. In addition, I would argue that these demographic and household dynamics combined with the tradition of keeping land within families and purchasing land when it became available with resources gained from non-farm labor.
population displayed less variability in age-specific growth rates and the NRR* compared to the non-farm population.
I do find some support for the initial hypothesis stated in the introduction: namely, that the farming segment of the population exhibited a more stable growth pattern during the late 19th century. Further inspection of the data is necessary to provide more substantive results, and to carry these analyses into the 20th century. The results make sense when we consider what the age-specific growth rate and the NRR* are measuring: i.e., relative growth of population age groups and population net reproductive success with allowances for migration. If the patterns visible in the current analysis hold up to further examination, the assumption that the farming segment of the population maintained a certain level of demographic sustainability over this period would appear to be confirmed. I argue that this phenomenon is attributable to the nature of the Orkney farming population, which mainly consists of families who have inhabited the islands (and in many cases the same houses) since the 15th century (Marwick 1952; Scott et al. 2003).
v(a) =0.85, using farm v(a) = 0.857), thus indicating that it is the underlying difference in age structure of the populations that contribute most to the observed differences. To visualize this, I present the age distributions of the farm and non-farm populations for each census year in Figure 7.
Figure 7: Age distributions for the farm and non-farm segments of the population of the northern Orkney islands, 1851 to 1901
With respect to the performance of the variable-r method in this particular setting, I suggest that the method can prove useful, especially in studies of historical populations (Cachinero-Sanchez 1985; Gage 1985; Gage et al. 1986). Additionally, studies focusing on evolutionary hypotheses should find great value in the variable-r method and the NRR and NRR* as measures of population growth, sustainability, and overall reproductive success (Kaplan and Gurven 2008; Metcalf and Pavard 2006). One limitation of the method, as evidenced in this analysis, is that, while the method was designed to work with less than ideal data, there may be some numerical instabilities that result when it is used in very small anthropological populations. Given this limitation, users should be aware that results might be inherently biased because of very small population sizes, especially when the population is categorized by age and other characteristics. Finally, I hope that the utility of the approach taken in this analysis can be used in other circumstances in which relative reproduction and growth of subpopulations is of interest. It is not difficult to imagine applying such procedures to problems of differential growth of racial/ethnic groups or growth of sub-regions of a particular country.
6. Acknowledgments
References
Anderson, M. and Morse, D.J. (1993a). High fertility, high emigration, low nuptiality: adjustment processes in Scotland's demographic experience, 1861-1914, Part I.
Population Studies 47(1): 5-25. doi:10.1080/0032472031000146706.
Anderson, M. and Morse, D.J. (1993b). High fertility, high emigration, low nuptiality: adjustment processes in Scotland's demographic experience, 1861-1914, Part II.
Population Studies 47(2): 319-343. doi:10.1080/0032472031000147046.
Barclay, R.S. (1965). The population of Orkney 1755-1961. Kirkwall: Mackintosh. Bennett, N.G. and Horiuchi, S. (1981). Estimating the completeness of death
registration in a closed population. Population Index 47: 207-221.
doi:10.2307/2736447.
Bowers, E.J. (1983). Patterns of adult mortality in the Orkney Islands [PhD thesis]. University of Pennsylvania Department of Anthropology.
Bradshaw, Y.W. and Schafer, M.J. (2000). Urbanization and development: The emergence of international nongovernmental organizations amid declining states. Sociological Perspectives 43(1): 97-116.
Brennan, E. (1979). Kinship, demographic, social, and geographic characteristics of mate choice in a small human population [PhD thesis]. Pennsylvania State University Department of Anthropology.
Brennan, E.R. (1983). Pre-reproductive mortality and family structure: Sanday, Orkney Islands 1855-1974. Human Biology 55(1): 19-33.
Brennan, E.R., Leslie, P.W., and Dyke, B. (1982). Mate choice and genetic structure Sanday, Orkney Islands, Scotland. Human Biology 54(3): 477-489.
Brennan, E.R. and Relethford, J.H. (1983). Temporal variation in the mating structure of Sanday, Orkney Islands. Annals of Human Biology 10(3): 265-280.
doi:10.1080/03014468300006431.
Cachinero-Sanchez, B. (1985). Estimating Levels of Adult Mortality in 18th Century Spain. Historical Methods 18(2): 63-70.
Cai, Y. (2008). An assessment of China's fertility level using the variable-r method.
Demography 45(2): 271-281. doi:10.1353/dem.0.0003.
Coale, A.J. (1984). Life Table Construction on the Basis of 2 Enumerations of a Closed Population. Population Index 50(2): 193-213. doi:10.2307/2736754.
Curtis, S.L., Diamond, I., and McDonald, J.W. (1993). Birth interval and family effects on postneonatal mortality in Brazil. Demography 30(1): 33-43.
doi:10.2307/2061861.
Desai, S. (1992). Children at risk: the role of family structure in Latin America and West Africa. Population and Development Review 18(4): 689-717.
doi:10.2307/1973760.
Dodgshon, R.A. (1993). Strategies of Farming in the Western Highlands and Islands of Scotland Prior to Crofting and the Clearances. The Economic History Review 46(4): 679-701. doi:10.1111/j.1468-0289.1993.tb01357.x.
Dodgshon, R.A. (1994). Budgeting for survival: Nutrient flow and traditional highland farming. In: Foster, S. and Smout, T.C. (eds.). The history of soils and field systems. Aberdeen: Scottish Cultural Press: 83-93
Durrenberger, E.P. (1984). Operationalizing Chayanov. In: Durrenberger, E.P. (ed.).
Chayanov, peasants, and economic anthropology. Orlando: Academic Press:
39-50
Durrenberger, E.P. and Tannenbaum, N. (2002). Chayanov and theory in economic anthropology. In: Ensminger, J. (ed.). Theory in economic anthropology. Walnut Creek, CA: Altamira Press: 137-154
Fenton, A. (1978). The Northern Isles: Orkney and Shetland. Edinburgh: John Donald. Firebaugh, G. (1984). Urbanization of the nonfarm population: A research note on the
convergence of rich and poor nations. Social Forces 62(3): 775-783.
doi:10.2307/2578711.
Firth, J. (1974). Reminiscences of an Orkney parish. Stromness: Orkney Natural History Society.
Flinn, M. (1977). Scottish population history from the 17th century to the 1930s. Cambridge: Cambridge University Press.
Forsythe, D.E. (1980). Urban incomers and rural change: The impact of migrants from the city on life in an Orkney community. Sociolgia Ruralis 20(4): 287-307.
doi:10.1111/j.1467-9523.1980.tb00716.x.
Fure, E. (2000). Interactive record linkage: The cumulative construction of life courses.
Gage, T.B. (1985). Demographic estimation from anthropological data: New methods.
Current Anthropology 26(5): 644-647. doi:10.1086/203353.
Gage, T.B., Dyke, B., and MacCluer, J. (1986). Estimating mortality level for small populations: An evaluation of a pair of two-census methods. Population Studies 40(2): 263-273. doi:10.1080/0032472031000142066.
Goldschmidt, W. (1978). Large-scale farming and the rural social structure. Rural Sociology 43(3): 362-366.
GROS (2001). Detailed annual report of the Registrar-General of Scotland. Edinburgh and London: HMSO.
Gunnlaugsson, G.A. (1988). Family and household in Iceland 1801-1930. Stockholm: Almqvist and Wiksell International.
Gupta, M.D. (1997). Socio-Economic Status and Clustering of Child Deaths in Rural Punjab. Population Studies 51(2): 191-202. doi:10.1080/0032472031000149906. Hagen, E.H., Barrett, H.C., and Price, M.E. (2006). Do human parents face a
quantity-quality tradeoff? Evidence form a Shuar community. American Journal of
Physical Anthopology 130: 405-418. doi:10.1002/ajpa.20272.
Hagen, E.H., Hames, R.B., Craig, N.M., Lauer, M.T., and Price, M.E. (2001). Parental investment and child health in a Yanomamo village suffering short-term food stress. Journal of Biosocial Science 33(4): 503-528.
doi:10.1017/S002193200100503X.
Hammel, E.A. (2005a). Chayanov revisited: A model for the economics of complex kin units. Proceedings of The National Academy of Sciences, USA 102(19): 7043-7046. doi:10.1073/pnas.0501987102.
Hammel, E.A. (2005b). Demographic dynamics and kinship in anthropological populations. Proceedings of The National Academy of Sciences, USA 102(6): 2248-2253. doi:10.1073/pnas.0409762102.
Hammel, E.A. (2005c). Kinship-based politics and the optimal size of kin groups.
Proceedings of The National Academy of Sciences, USA 102(3): 11951-11956.
doi:10.1073/pnas.0504647102.
Harris, C.K. and Gilbert, J. (1982). Large-scale farming, rural income, and Goldschmidt's Agrarian Thesis. Rural Sociology 47(3): 449-458.
census sample in two Massachusetts Towns, 1850-1912. Historical Methods 33(1): 16-29.
Horiuchi, S. and Preston, S.H. (1988). Age-specific growth rates: The legacy of past population dynamics. Demography 25(3): 429-441. doi:10.2307/2061542. Jennings, J.A., Sparks, C.S., Wood, J.W., Johnson, P.L., and Murtha, T.M. (2008).
Extended Households and Economic Dynamics in Orkney, Scotland, 1851-1901. Paper presented at Population Association of America, New Orleans, LA. Johnson, P.L., Wood, J.W., Sparks, C.S., and Murtha, T.M. (2005). From sustainable to
unsustainable: Three centuries of population history in North Orkney, Scotland. Paper presented at Annual Meeting of the Society for Economic Anthropology, Hanover, NH, USA.
Kaplan, H. and Gurven, M. (2008). Top-down and bottom-up research in biodemography. Demographic Research 19(44): 1587-1602.
doi:10.4054/DemRes.2008.19.44.
Kasarda, J.D. and Crenshaw, E.M. (1991). Third-world urbanization - Dimensions, Theories and Determinants. Annual Review of Sociology 17: 467-501.
doi:10.1146/annurev.so.17.080191.002343.
Lee, J. (2007). Experiencing landscape: Orkney hill land and farming. Journal of Rural Studies 23: 88-100. doi:10.1016/j.jrurstud.2006.05.002.
LeGrand, T., Koppenhaver, T., Mondain, N., and Randall, S. (2003). Reassessing the insurance effect: A qualitative analysis of fertility behavior in Senegal and Zimbabwe. Population and Development Review 29(3): 375-403.
doi:10.1111/j.1728-4457.2003.00375.x.
Lobao, L.M. and Meyer, K. (1995). Economic decline, gender, and labor flexibility in family-based enterprises: Midwestern farming in the 1980's. Social Forces 74(2): 575-608. doi:10.2307/2580493.
Lumb, R. (1980). Migration in the Highlands and Islands of Scotland. Aberdeen: University of Aberdeen.
Marwick, H. (1952). Orkney Farm Names. Kirkwall: W. R. Mackintosh.
Meert, H., Van Huylenbroeck, G., Bernimmen, T., Bourgeois, M., and van Hecke, E. (2005). Farm household survival strategies and diversification on marginal farms. Journal of Rural Studies 21: 81-97. doi:10.1016/j.jrurstud.2004.08.007. Metcalf, C.J.E. and Pavard, S. (2006). Why evolutionary biologists should be
demographers. Trends in Ecology and Evolution 22(4): 205-212.
doi:10.1016/j.tree.2006.12.001.
Meyer, K. and Lobao, L.M. (1997). Farm couples and crisis politics: The importance of household, spouse, and gender in responding to economic decline. Journal of
Marriage and the Family 59(1): 204-218. doi:10.2307/353673.
Miller, J. (1999). Salt in the Blood: Scotland's Fishing Communities Past and Present. Edinburgh: Canongate Books.
Murtha, T.M., Johnson, P.L., Wood, J.W., Matthews, S., Sparks, C.S., and Jennings, J. (2008). Historical demography, oral history, settlement archaeology, and
landscape ecology: The North Orkney Population History Project. Paper
presented at European Population Conference, Barcelona, Spain.
Netting, R.M. (1993). Smallholders, Householders: Farm Families and the Ecology of Intensive, Sustainable Agriculture. Stanford: Stanford University Press.
Pooley, C. and Turnbull, J. (1998). Migration and mobility in Britain since the
eighteenth century. London: University College of London Press.
Preston, S.H. (1983). An integrated system for demographic estimation from two age distributions. Demography 20(2): 213-226. doi:10.2307/2061236.
Preston, S.H. and Coale, A. (1982). Age structure, growth, attrition, and accession: A new synthesis. Population Index 48: 217-259. doi:10.2307/2735961.
Preston, S.H., Heuveline, P., and Guillot, M. (2000). Demography: Measuring and
modeling population processes. London: Basil Blackwell.
Preston, S.H. and Wang, H.D. (2007). Intrinsic growth rates and net reproduction rates in the presence of migration. Population and Development Review 33(4): 657-666.
Rhoda, R. (1983). Rural Development and Urban Migration: Can We Keep Them down on the Farm? International Migration Review 17(1): 34-64.
Ruggles, S., Sobek, M., Alexander, T., Fitch, C.A., Goeken, R., Hall, P.K., King, M., and Ronnander, C. 2008. Integrated Public Use Microdata Series: Version 4.0 [Machine-readable database]: Minnesota Population Center.
Schrank, G. (1995). An Orkney estate: Improvements at Graemeshall 1827-1888. East Linton: Tuckwell Press.
Scott, N., Stevenson, C., and Stout, A. (2003). Fae Quoy tae Castle: The Buildings of
Westray. Westray Building Preservation Trust.
Sinclair, J.E. (1796). The old statistical account of Scotland. Edinburgh: University of Edinburgh.
Sparks, C.S. (2006). A spatial and temporal analysis of immigrant behavior in Northern
Orkney 1851-1901. Poster presented at Population Association of America, Los
Angeles, CA.
Sparks, C.S., Goodwine, N.M., Bharti, N., and Wood, J.W. (2005). Spatial and temporal dynamics of respiratory disease in Orkney, Scotland, 1855-1940. (Abstract). American Journal of Physical Anthopology Supplement 40:195. Stambuk, M. (1991). Agricultural depopulation in Croatia. Sociologia Ruralis 31(4):
281-289. doi:10.1111/j.1467-9523.1991.tb00908.x.
Stockdale, A., Findlay, A., and Short, D. (2000). The repopulation of rural Scotland: opportunity and threat. Journal of Rural Studies 16: 243-257.
doi:10.1016/S0743-0167(99)00045-5.
Strulik, H. (2004). Economic growth and stagnation with endogenous health and fertility. Journal of Population Economics 17(3): 433-453.
doi:10.1007/s00148-004-0188-z.
Thomson, W.P.L. (1983). Kelp making in Orkney. Kirkwall: The Orkney Press. Thomson, W.P.L. (2001). The new history of Orkney. Edinburgh: Mercat Press.
Van Bavel, J. (2004). Deliberate birth spacing before the fertility transition in Europe: Evidence from nineteenth-century Belgium. Population Studies (Cambridge) 58(1): 95-107. doi:10.1080/0032472032000167706.
Van Bavel, J. (2007). The decline of illegitimacy and the control of marital fertility during the demographic transition. Testing the innovation-diffusion hypothesis using cohort fertility data from a Belgian town, 1850-1910. Historical Social
Van Bavel, J. and Kok, J. (2004). Birth spacing in the Netherlands. The effects of family composition, occupation and religion on birth intervals, 1820-1885.
European Journal of Population 20(2): 119-140.
doi:10.1023/B:EUJP.0000033860.39537.e2.
Wenham, S. (2001). A More Enterprising Spirit: The Parish and people of Holm in the 18th century Orkney. Kirkwall: Bellavista Publications.
Wenxian, Z. and Xiaorong, J. (1989). The Transformation of the Agricultural Population and the Urbanisation Process in China. International Journal of
Social Economics 16(1): 40-51. doi:10.1108/EUM0000000000437.
White, K.J.C. (2008). Population change and farm dependence: Temporal and spatial variation in the U. S. Great Plains, 1900-2000. Demography 45(2): 363-386.
doi:10.1353/dem.0.0010.