Open Access
R E S E A R C H
BioMed
Central
© 2010 Cinnamon and Schuurman; licensee BioMed Central Ltd. This is an Open Access article distributed under the terms of the Cre-ative Commons Attribution License (http://creativecommons.org/licenses/by/2.0), which permits unrestricted use, distribution, and re-production in any medium, provided the original work is properly cited.Research
Injury surveillance in low-resource settings using
Geospatial and Social Web technologies
Jonathan Cinnamon* and Nadine Schuurman
Abstract
Background: Extensive public health gains have benefited high-income countries in recent decades, however, citizens of low and middle-income countries (LMIC) have largely not enjoyed the same advancements. This is in part due to the fact that public health data - the foundation for public health advances - are rarely collected in many LMIC. Injury data are particularly scarce in many low-resource settings, despite the huge associated burden of morbidity and mortality. Advances in freely-accessible and easy-to-use information and communication (ICT) technology may provide the impetus for increased public health data collection in settings with limited financial and personnel resources. Methods and Results: A pilot study was conducted at a hospital in Cape Town, South Africa to assess the utility and feasibility of using free (non-licensed), and easy-to-use Social Web and GeoWeb tools for injury surveillance in low-resource settings. Data entry, geocoding, data exploration, and data visualization were successfully conducted using these technologies, including Google Spreadsheet, Mapalist, BatchGeocode, and Google Earth.
Conclusion: This study examined the potential for Social Web and GeoWeb technologies to contribute to public health data collection and analysis in low-resource settings through an injury surveillance pilot study conducted in Cape Town, South Africa. The success of this study illustrates the great potential for these technologies to be leveraged for public health surveillance in resource-constrained environments, given their ease-of-use and low-cost, and the sharing and collaboration capabilities they afford. The possibilities and potential limitations of these technologies are discussed in relation to the study, and to the field of public health in general.
Introduction
Technology and Global Health
Massive gains in health and medicine over the past decades have brought great improvements to quality of life. This is most notable by soaring life expectancy rates and plummeting infant mortality rates; however, these gains have largely been confined to high-income coun-tries [1]. As such, new strategies are required to support health innovation to benefit the low and middle-income countries (LMIC) of the world [2]. One of the current pri-orities for global health research is information and com-munication technologies (ICT) [3]. In fact it is argued that advances in ICT will likely have the greatest impact on reaching the Millennium Development Goals [4]. In LMIC where resources for health are severely limited, policy-makers "often have to make difficult decisions that
pit investment in new technologies and capacity-building in science and technology against basic population-wide services such as healthcare and water supply and sanita-tion" [5]. What is required then, are longer-term public health solutions which can be implemented without affecting more immediate necessities. The present study addresses this issue by assessing the possibility for Social Web technologies to support the development of public health surveillance systems for low-resource environ-ments. Social Web technologies may be valuable tools for LMIC because they are designed to be easy to use, and many have no licensing fees. The promise of these tech-nologies was demonstrated through an injury data collec-tion and analysis pilot study conducted in Cape Town, South Africa.
The Burden of Injury in Low and Middle-Income Countries
The 'invisible epidemic' of injury is one of the leading causes of death in working-aged adults and children in almost every country in the world [6]. Injury is a serious
* Correspondence: [email protected]
1 Department of Geography, Simon Fraser University, 8888 University Drive, Burnaby, British Columbia, V5A 1S6 Canada
threat to public health and to future generations in all countries around the globe, whether high, middle or low-income [7]. In LMIC however, the problem is particularly acute because of a disproportionately high incidence of injury, a scarcity of resources and prevention efforts, and an extremely low level of funding devoted to this problem in comparison with the high-profile communicable dis-eases such as HIV/AIDS, tuberculosis, and malaria [8,9]. Of the approximately 5 million deaths annually attributed to injury, 90% occur in LMIC [10,11]. In South Africa, the burden of injury is massive; this huge contribution to overall mortality and morbidity is largely attributed to road-traffic crashes and interpersonal violence [12].
Injury Surveillance in Low and Middle-Income Countries
In LMIC, high rates of injury are coupled with poor injury surveillance. Public health surveillance involves "ongoing systematic collection, collation, analysis and interpretation of data and the dissemination of informa-tion to those who need to know in order that acinforma-tion may be taken" [13]. Injury surveillance systems are relatively well-developed in resource-rich settings; however, they are frequently non-existent in LMIC. This lack of injury data has been highlighted as a major barrier to injury pre-vention in LMIC [10,14]. It is imperative that data on injury is collected and analyzed so that public health offi-cials can gain a better understanding of the magnitude and characteristics of the problem [9].
Geographic Information Systems
Geographic Information Systems (GIS) and spatial analy-sis can play a crucial role in understanding the burden of injury [15,16]. GIS has been used increasingly to help uncover the determinants of injury through analysis of its social and environmental correlates [e.g. [17-20]]. For example, In Kenya, a recent study combined GIS with patient medical records to create an electronic injury sur-veillance system [14]. This spatially-equipped system was used to ascertain the environmental attributes at the location of injury. GIS technologies range from sophisti-cated licensed desktop software to free, lightweight, Web-based applications.
The Social Web and the Geospatial Web
The Social Web (alternatively known as Web 2.0, the read-write Web, etc.) refers to what has been described as the 'second wave' [21] of the World Wide Web. The Social Web represents a paradigm shift from the capabilities of the first incarnation of the Web, despite the original intentions for the Web by its inventor [22]. This shift is identified by a fundamental change in how the Web is used, and by advances in its technological capabilities [23,24]. 'The participatory Web' as opposed to 'Web as information source' is a distinguishing theme of the Social Web, of which user-created content,
information-sharing, and collaboration are the hallmarks. User contri-bution and collaboration aspects of the Social Web have the potential to provide an open platform for political and societal debates, and could increase diversity of opinion, the free flow of information and freedom of expression [25]. The second major theme of the Social Web - a shift in technology usage and capabilities - is characterized by the use of the Internet as a technology platform. Improvements in technology and changing patterns of technology consumption have contributed to the increas-ing use of no-cost Web-based applications in place of licensed proprietary software. Cheung et al. [26] outline the technological innovations that define the Social Web; rich Internet applications, collaboration tools, user con-tributed content databases, and integrative technologies.
The uptake of rich Internet applications is beginning to take hold as the products offered become more robust. The 'Web office', or Office 2.0 [27] is revolutionizing pro-ductivity software availability, with word processing, spreadsheet, and presentation software now available free and accessible anywhere through a Web browser. Collab-oration amongst colleagues will become easier, as docu-ments can be stored, edited, and shared online. For example, revisions of a common Web-based document can be undertaken by various authors, while avoiding the problem of having several versions of the document [27]. Google Docs [28] and ThinkFree Office [29] each offer a suite of office productivity tools including word proces-sors, presentation designers, and spreadsheet editors designed to compete with traditional software such as Microsoft Office.
The geospatial Web (or GeoWeb) refers to the "global collection of general services and data that support the use of geographic data in a range of domain applications" [30]. These new technologies, described as "not quite-GIS" by Elwood [31] are bringing Social Web approaches to GIS, thereby democratizing this once exclusive domain [32-35]. Virtual globes such as Google Earth [36], NASA World Wind [37], and ArcGIS Explorer [38] have fast become ubiquitous; much of the success of Google Earth and the other virtual globes stem from their simplicity. This is accomplished by "avoiding reference to the techni-cal details of georeferencing, projections, and figures of the Earth, and presenting the planet as it would appear from a user-controlled viewpoint" [32]. Since GeoWeb platforms are free and easy to navigate, it is expected that the traditional barriers of domain training and financial resources will be reduced, thereby allowing many more people and organizations to leverage geospatial technol-ogy for their own purposes.
Social Web Technology for Health
more complete experience promised to the average Web user extends to researchers, patients, and practitioners in the health and science fields. Despite lagging behind in technology uptake and the use of Social Web applications and services [39-41], health and science stakeholders could gain from this revolution in technology, communi-cation, and interaction. The fact that virtual globes are quick, popular and ubiquitous, render these tools partic-ularly appropriate to use for data visualization [42]. For example, an early demonstration of Google Earth for data visualization in the health domain was a simple interac-tive application highlighting the Health Authorities in England [43]. A Web site that hosted a Google Earth file was created, which users could download and open on their local machine. Clicking on the geocoded point opened a Web page from the National Health Service within the Google Earth interface with information on that specific health authority. The unique characteristics of the Social Web may be particularly well-suited to LMIC, where lack of finances and trained personnel have traditionally acted as barriers to information and technol-ogy uptake [44].
These benefits are already coming to fruition, as Social Web technologies are beginning to appear in support of public health projects in LMIC. Lozano-Fuentes et al.
[45] describe the use of Google Earth to support the map-ping of dengue disease data for visualization and analysis. A dengue decision support system was developed using Google Earth in conjunction with traditional GIS soft-ware. Spatial data files for two cities in Mexico were cre-ated by tracing satellite imagery using the drawing tools available within the Google Earth software. These tools allowed for the creation of block-level city maps showing the distribution of city blocks with dengue cases. These data layers could then be exported into GIS software for use in a dengue information system. No previous experi-ence with Google Earth was needed to create the spatial data files. Kamadjeu [46] used Google Earth to monitor polio in the vicinity of the Congo River. Google Earth was used to create maps of areas of the river that were unavailable elsewhere. These maps improved public health planning and resource allocation in a region where the topography was previously not fully understood. These recent examples of Social Web software use for public health endeavours represent a major step towards increasing access to technology for LMIC. However, what remains is a true adaptation to the new paradigms of the Social Web, as computer programming and traditional GIS data are still employed in these and most recent examples.
The purpose of this study was to demonstrate the capa-bility of Social Web technologies to be used for public health projects in low-resource settings. As a test case for these technologies, an injury surveillance pilot project
was undertaken in Cape Town, South Africa. All aspects of data input, analysis, and visualization were undertaken using Social Web and GeoWeb technologies. An advance-ment in this study over recent demonstrations was the use of tools that did not require programming or advanced computer skills, GIS data, or licensed proprie-tary software. This pilot study points to the potential for these technologies to contribute to public health surveil-lance in low and middle-income countries. The protocols described herein could likely be transferred to other set-tings and adapted to local capabilities for organizations that wish to engage in public health surveillance.
Methods Needs assessment
streamlined as possible for the busy clinical staff who would be charged with its completion.
The current data management system in place at the hospital was under-used as it was deemed to be too time-consuming and difficult to operate. In this pilot study, we developed and tested a streamlined and readily modifi-able trauma data entry and management system using Google Docs [28]. Using the Forms utility within Google Docs, it was possible to create an online data entry form to mimic the paper hardcopy form without the need for programming or advanced computer skills. This online form could be filled out by copying the data from the paper form into the online form. Submitting the form would then populate the spreadsheet with the data with-out the need to interact with the spreadsheet cells during the data entry phase.
The importance of user-friendly data analysis tools for in-house data exploration and visualization was high-lighted during the needs assessment phase. An aspect of the pilot study was to demonstrate the feasibility of free and easy-to-use GeoWeb applications for these purposes in place of complex and costly desktop GIS. Several GeoWeb applications were explored to test their suitabil-ity for this purpose, including BatchGeocode, Mapalist, and Google Earth. Ethics approval for this study was granted by Simon Fraser University and the University of Cape Town.
Results
Data Collection and Management
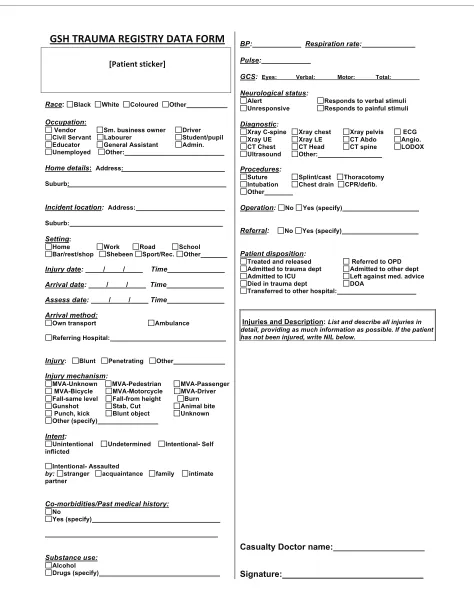
785 patients were recorded in the 30 day data capture fea-sibility study. Two researchers conducted the data cap-ture; this required assembling the data from various sources and recording it on a one-page paper form, one for each patient. Halfway through the study, doctors and the clinical staff who would eventually be charged with form completion began to assist with completion of the forms as part of their routine patient documentation. These staff were provided training and assistance in order for them to become familiar with the data, where it could be abstracted from, and the purposes of its completion. The form underwent several revisions as the study pro-gressed; the final version of the paper form is shown in Figure 1.
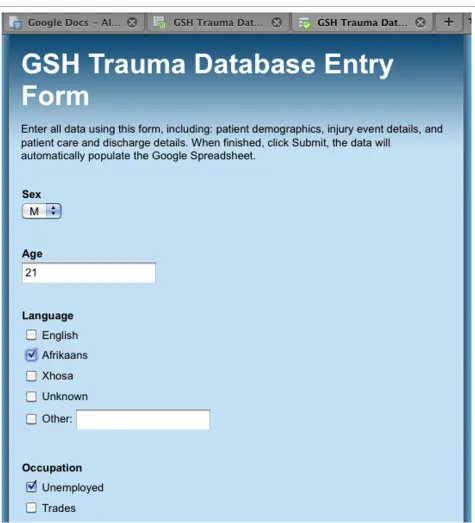
Between 20 and 50 patients were recorded daily during the data capture study. Each day, one researcher spent between one and three hours entering the data into the trauma database, depending on the number of patients recorded that day. Figure 2 shows the Google Docs Form that was created to allow for easy population of the data-base, housed online in a security-protected Google Spreadsheet. The online form was designed to allow for a sequential input of data in the same order as on the paper form, i.e. demographic information first, injury event
details second, clinical procedures third, and injury details last. As the paper form went through several itera-tions during the period, the online Google Docs Form had to be redesigned as some fields were removed or had changed position on the paper form. Redesign of the online form was very simple; fields could be removed through a simple deletion, or their sequential position could be changed by dragging the field to its new position and dropping it in its new place.
Data Exploration and Visualization
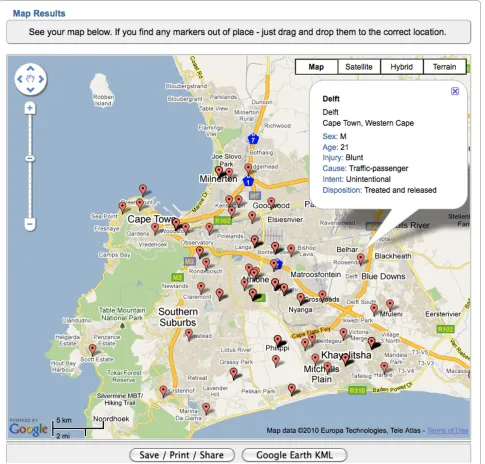
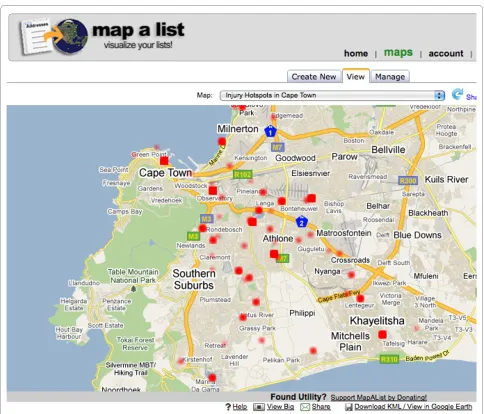
A data processing, exploration, and visualization system was developed as a demonstration of the potential for free and simple Social Web and GeoWeb technology to be used for injury control in low-resource settings. Two free Web-based geocoding tools were tested, BatchGeocode http://www.batchgeocode.com, and Mapalist http:// www.mapalist.com, both of which operate on the Google Maps platform. BatchGeocode proved to be an easy to use data georeferencing system, with high accuracy at the neighbourhood level in Cape Town. The interface of this Web site allows users to paste a table of data into a form, which is then geocoded (see Figure 3). The updated table complete with geographic coordinates can then be down-loaded, or exported in Keyhole Markup Language (KML) format, the file type native to Google Earth. In addition, the results can be saved to a Web page within the site which can be open to public viewing, or restricted. The data can be mapped individually, or it can be grouped into categories by any of the fields in the data table.
map-Figure 1 Paper data collection form. A one-page paper form was created in order to assemble the data to populate the trauma registry. The form went through several iterations over the course of the pilot study based on the feasibility of collecting the fields. The fields on this final iteration of the form were collectible as part of the regular documentation duties of the trauma unit's clinical staff.
Race: Black White Coloured Other
Occupation:
Vendor Sm. business owner Driver Civil Servant Labourer Student/pupil Educator General Assistant Admin. Unemployed Other:
Home details: Address:
Suburb:
Incident location: Address: Suburb: Setting:
Home Work Road School Bar/rest/shop Shebeen Sport/Rec. Other Injury date: / / Time Arrival date: / / Time Assess date: / / Time Arrival method:
Own transport Ambulance
Referring Hospital:
Injury: Blunt Penetrating Other
Injury mechanism:
MVA-Unknown MVA-Pedestrian MVA-Passenger MVA-Bicycle MVA-Motorcycle MVA-Driver Fall-same level Fall-from height Burn Gunshot Stab, Cut Animal bite Punch, kick Blunt object Unknown Other (specify)
Intent:
Unintentional Undetermined Intentional- Self inflicted
Intentional- Assaulted
by: stranger acquaintance family intimate partner
Co-morbidities/Past medical history:
No Yes (specify) Substance use: Alcohol Drugs (specify) BP: Respiration rate: Pulse:
GCS: Eyes: Verbal: Motor: Total:
Neurological status:
Alert Responds to verbal stimuli Unresponsive Responds to painful stimuli
Diagnostic:
Xray C-spine Xray chest Xray pelvis ECG Xray UE Xray LE CT Abdo Angio. CT Chest CT Head CT spine LODOX Ultrasound Other:
Procedures:
Suture Splint/cast Thoracotomy Intubation Chest drain CPR/defib. Other
Operation: No Yes (specify)
Referral: No Yes (specify)
Patient disposition:
Treated and released Referred to OPD Admitted to trauma dept Admitted to other dept Admitted to ICU Left against med. advice Died in trauma dept DOA
Transferred to other hospital:
Injuries and Description: List and describe all injuries in detail, providing as much information as possible. If the patient has not been injured, write NIL below.
Casualty Doctor name:
maker to set the map to automatically update if the Google Spreadsheet undergoes a modification, such as the addition of new data.
In addition to the visualization options available within the geocoding Web sites, the free version of Google Earth was used to develop a injury data spatial visualization
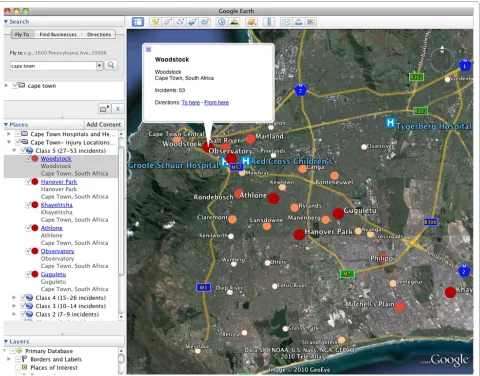
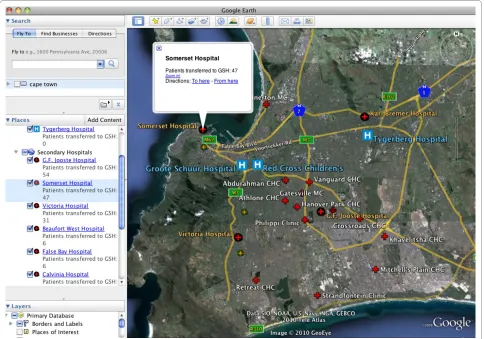
tool. This GeoWeb application was chosen because of its ubiquity as the most popular version of the virtual earth platforms. Two interactive visualizations were created; a map of injury incidents by suburb (Figure 5), and a map of the location of facilities that transferred patients to GSH (Figure 6). In order to create these visualizations, data
were aggregated in two new Google Spreadsheets; one for the number of incidents occurring in each suburb, and one for the number of patients transferred to GSH by health care facility. This was a simple process of sorting the data in the appropriate column in the original spread-sheet, summing the number of incidents by suburb and the number of patients transferred by facility, and copy-ing this into the new spreadsheet. KML files for the two visualizations were then created using the online geocod-ing tools described above. These files could then be opened in Google Earth to allow for exploration and
visu-alization of the spatial data at multiple scales. With these interactive visualizations, the user can easily explore the spatial distribution of injury in Cape Town, and the net-work of hospitals and health centres in which transferred patients originated from, prior to their arrival at GSH.
User Evaluations
Informal user-evaluations were conducted throughout the study with hospital staff as a preliminary assessment of the usability and utility of its various components. The participating staff members had no specific background
or training in the use of information technologies. The purpose of these evaluations was to assess whether the data collection and analysis system would be useful for the trauma unit, and if the system could be operated and utilized without the need for outside expertise. User-eval-uations of the paper form were positive, with clinical staff suggesting that they were easy to complete and were less time-consuming than the current system's two-page form. An informal user-test of the Google Docs Form and Spreadsheets with a non-clinical member of staff who held data entry duties was positive. In comparison with the previous database system, the data entry and manage-ment system developed in this study was deemed to be much simpler to use and the records could be entered into the database more rapidly. Once the data had been
georeferenced and visualized, members of staff engaged in data exploration within Google Earth. Persons with experience using the platform were easily able to explore the data, and were able to recognize spatial patterns of injury in Cape Town. The users were particularly excited about the potential for the patient transfer facility net-work visualization to inform future trauma system plan-ning for GSH and the city of Cape Town in general.
Discussion
In this paper, an injury surveillance pilot study was con-ducted at a low-resource hospital in Cape Town using Social Web technologies. This pilot study represents the first stage in the development of a sustainable trauma reg-istry that could be used for epidemiological analyses and
administrative purposes. Free and easy-to-use data man-agement and analysis tools available on the Web were demonstrated in order to highlight a simple and afford-able alternative to traditional software that is expensive and requires comprehensive training. As a result of these benefits, there is great potential for organizations with limited resources to leverage Social Web and GeoWeb technologies for organizing and operationalizing public health surveillance, including for the increasingly recog-nized problem of injury.
Social Web Technologies
Technology may hold the key to improved public health in LMIC [47], however, technology advocates must fully understand the barriers to technology uptake faced in these countries. In the case of injury surveillance in LMIC, the two chronic roadblocks to the implementation of sustainable data registries are a lack of finances and trained personnel [48]. This study focused on addressing
this problem by designing simple, easy-to-use protocols for collecting, managing, and analyzing injury data.
Social Web technologies may be very attractive options for public health surveillance in settings where resources are limited, most notably as a result of their simplicity and affordability. The technologies demonstrated in this study exemplify simple and affordable data management and visualization solutions. The database that was devel-oped using Google Spreadsheet was simple to set up and operate, including the data entry form and the spread-sheet. In addition, the Forms data entry system was designed to use dropdown menus and tick-boxes and did not require spreadsheet interaction; it is likely that this would result in few data entry errors as opposed to data entry through direct spreadsheet input. With regards to the GeoWeb tools, Mapalist proved to be a better system for the purposes of this study, as it is designed to work specifically with Google Spreadsheets which made the
process more streamlined. Additionally, in comparison with the BatchGeocode tools, more visualization options and data query functionality were available.
Virtual globes are largely responsible for introducing geospatial technologies to the masses [49]. Google Earth, the most well-known of the virtual globes is widely used for educational and entertainment purposes, however, its use as a tool for endeavours in science and health is grow-ing [50]. Recent studies have used Google Earth for scien-tific activities in low-resource settings [e.g. [45,46,50-52]], however in most cases licensed proprietary software was also relied upon in addition to Google Earth, or computer programming was required. In this study, other applica-tions were used to complement Google Earth as described above, however all tools were chosen explicitly because they had no licensing fees, were simple to use, and required no programming or sophisticated computer skills. This is a notable contribution as most organiza-tions in LMIC are unlikely to have access to traditional licensed geospatial software, nor the expertise to operate it. In addition to the abovementioned benefits, there are
other reasons that may lead organizations to choose Google Earth. For the average user, Google Earth may be more user-friendly and flexible than traditional GIS, given its more intuitive user-interface that allows the user to readily pan and zoom in for greater detail [33], thereby allowing for exploration of spatial data at multiple scales. Furthermore, organizations may be attracted to Google products since it is developing initiatives to address humanitarian and global health issues through the use of its products, by way of Google Earth Outreach [53] and Google.org [54]. Above all, the ubiquity and simplicity of the Google Earth system make it an ideal platform for data visualization for organizations with financial con-straints or no expertise in traditional GIS platforms.
Information Sharing and User Collaboration
Although this paper is chiefly focused on the technologi-cal aspects of the Social Web, another strongly heralded characteristic of the new Web - which is also important to this study - is its enormous potential for sharing and col-laboration [55,56]. Through the Social Web's superior sharing and collaboration abilities, and the potential it
holds for increased engagement, these visualization and analysis tools could help to bridge the gap between researcher and stakeholder, including policy-makers and citizens [57]. The Google Spreadsheet powered database was accessible and editable anytime, at any Web-enabled computer, providing the user was provided access. For example, as the database was populated by the data entry person, the trauma unit manager could access the most recent records of patients from another computer in real time for administrative purposes, or another data entry person could collaborate on editing the database. The georeferencing Web sites possessed similar sharing and collaboration characteristics. BatchGeocode allowed the user to store their newly created maps on their Web site. These can then be viewed by collaborators on their own computer by providing them with the unique URL that the map is stored on. Mapalist has a more advanced user-account system where users can view, edit, and update all of their maps in an easy-to-use interface. Maps can be privately or publicly viewable; if maps are restricted from public viewing, an email link can be sent to collaborators for viewing on a different computer. The Google Earth platform also sponsors user collaboration and data shar-ing as KML files of data in Google Earth can be shared instantly via email; this may be one of the most appealing aspects of the system [50]. In fact, the potential for these systems to allow for swift collaboration and sharing may be one of the most promising aspects of the Social Web for use in public health surveillance in any setting, irre-spective of the level of resources at hand.
Future Work
A suitable next step in this study could be to conduct a more thorough user-test of the tools and protocols devel-oped for this study, in order to assess the suitability of the system for local capabilities and to ensure the end result is sustainable. In subsequent phases of this project, atten-tion will be focused on ensuring that the system can be expanded to include other hospitals and jurisdictions. This will require - along with other considerations - the use of international injury coding and database stan-dards. A major direction for future work on this project involves an assessment of the utility of geospatial analysis for injury prevention in the local setting. As GeoWeb tools are not particularly suited to high-level geospatial analysis, it will be necessary to assess the utility of the technology's analysis, visualization, and data exploration capabilities. Although the focus of the present study was on the potential applicability of Social Web tools in this setting, the ultimate goal is to identify environmental and social correlates of injury in Cape Town using the spatial data collected and the visualization tools. Once a sustain-able data registry is functioning, a future study will iden-tify high-incident injury locations, and will examine the
social and environmental characteristics in order to iden-tify injury risk factors at these locations. This will require obtaining higher-resolution spatial data, which could possibly be obtained by querying the patient or ambu-lance driver regarding site of injury, followed by a confir-mation of the geographic coordinates using global positioning system (GPS) technology. A similar method has been successfully demonstrated in a study by Dwolatzky et al. [58] regarding location confirmation in informal settlements of Johannesburg. This is also a focus for future work.
Limitations and Possibilities
much work to be done however, to ensure that this recent stage in the technological revolution can contribute to the improvement of public health in these settings.
Limitations not specific to LMIC must also be noted as well, such as the potential tendency to over emphasise what is visualized because of the perceived reality of a vir-tual globe [33]. Proponents of these technologies must be cognisant of the 'wow' factor that these visualization tools can elicit in the viewer. A major issue with the GeoWeb's so-called 'democratization' of GIS is the potential for erroneous mapping and visualization by users unfamiliar with geospatial or epidemiological concepts [63], which could lead to inappropriate decision making. It must also be noted that restrictions may be placed on the use of these Web-based technologies. For example, Google has strict use criteria that determines how its maps and imag-ery can be used; however, the content can be used for academic purposes such as this study through the 'fair use' guidelines, on condition that attribution is given to Google and its suppliers, and content is identifiable as a Google product [64]. When using Google products or other Web technologies, the user must ensure they are complying with legal terms and conditions. Lastly, relying on these Web-based services for data manipulation and storage may be a point of concern, as potentially sensitive or valuable data could be subject to system instabilities or security breaches. As was done in this study, it is recom-mended that sensitive health data stored on the Web are anonymized and stored privately.
Conclusion
Despite considerable advancement in health and medi-cine in recent decades, the overall health and life-expec-tancy of citizens in low and middle-income countries remain poor. Public health data are fundamental to public health advances, however current and comprehensive public health data are rare in most LMIC. This is particu-larly true for the huge problem of injury, given the fact that it is largely overlooked as an immediate health prob-lem, despite its huge toll of morbidity and mortality. As a result, little is known about the magnitude of the problem in many locations, nor its correlates or implications. As health resources are insufficient in LMIC, what is needed are novel solutions for data collection and analysis that will not impinge on already depleted financial and per-sonnel resources. The enormous potential for simple and cost-effective Social Web technologies to be used for injury surveillance in low-resource settings was demon-strated in this study.
Findings of this demonstrative study strongly suggest that the ease-of-use, information sharing, and collabora-tion aspects of the Social Web may be particularly suited to public health surveillance in low-resource settings such as South Africa, and likely other low and
middle-income countries. Although this study was successful in illustrating the potential for new Web technologies, fur-ther assessments of the hospital's needs and capabilities will be needed to ensure the system is useful, effective, and sustainable. The results of this study will be useful for organizations that wish to commence public health data collection and analysis in a resource-constrained environ-ment. We encourage researchers and practitioners to continue to examine methods of engaging in data collec-tion and analysis through the use of Social Web, GeoWeb, and related information and communication technolo-gies.
Competing interests
The authors declare that they have no competing interests.
Authors' contributions
JC conducted the research and wrote the manuscript. NS conceptualized the paper and edited the manuscript.
Acknowledgements
This research was funded by a Social Sciences and Humanities Research Coun-cil (SSHRC) Standard Research Grant. Additional research support for Cinna-mon was provided by a SSHRC doctoral scholarship. Schuurman is also supported by career awards from the Canadian Institutes of Health Research (CIHR) and Michael Smith Foundation for Health Research (MSFHR). We are grateful to Groote Schuur Hospital in Cape Town.
Author Details
Department of Geography, Simon Fraser University, 8888 University Drive, Burnaby, British Columbia, V5A 1S6 Canada
References
1. Laxminarayan R, Mills AJ, Breman JG, Measham AR, Alleyne G, Claeson M, Jha P, Musgrove P, Chow J, Shahid-Salles S, Jamison DT: Advancement of global health: key messages from the Disease Control Priorities Project.
Lancet 2006, 367:1193-1208.
2. Gardner CA, Acharya T, Yach D: Technological and social innovation A unifying new paradigm for global health. Health Affairs 2007,
26:1052-1061.
3. Ijsselmuiden C, Matlin SA, Maïga AH, Hasler J, Pannenborg O, Evans T, Pang T, Gardner CA: From Mexico to Mali: a new course for global health. Lancet 2008, 371:91-93.
4. Juma C, Yee-Cheong L: Innovation: Applying Knowledge in Development. UN Millennium Project, Task Force on Science, Technology, and Innovation; 2005.
5. Acharya T: Science and technology for wealth and health in developing countries. Global Public Health 2007, 2:53-63.
6. Mock CN, Quansah RE, Krishnan R, Arreola-Risa C, Rivara FP:
Strengthening the prevention and care of injuries worldwide. Lancet
2004, 363:2172-2179.
7. Sommers MS: Injury as a global phenomenon of concern in nursing science. J Nurs Scholarship 2006, 38:314-320.
8. Lett RR, Kobusingye OC, Injury Prevention Initiative for Africa: Injury Prevention Initiative for Africa: achievements and challenges. Afr Health Sci 2002, 2:41-42.
9. Krug EG, Sharma GK, Lozano R: The global burden of injuries. Am J Public Health 2000, 90:523-526.
10. Hofman K, Primack A, Keusch G, Hrynkow S: Addressing the growing burden of trauma and injury in low- and middle-income countries. Am J Public Health 2005, 95:13-17.
11. Peden M, McGee K, Sharma G: The Injury Chart Book: A Graphical Overview of the Global Burden of Injuries. Geneva: World Health Organization; 2002.
Received: 25 March 2010 Accepted: 24 May 2010 Published: 24 May 2010
This article is available from: http://www.ij-healthgeographics.com/content/9/1/25 © 2010 Cinnamon and Schuurman; licensee BioMed Central Ltd.
This is an Open Access article distributed under the terms of the Creative Commons Attribution License (http://creativecommons.org/licenses/by/2.0), which permits unrestricted use, distribution, and reproduction in any medium, provided the original work is properly cited.
12. Norman R, Matzopoulos R, Groenewald P, Bradshaw D: The high burden of injuries in South Africa. Bull World Health Organ 2007, 85:695-702. 13. Integrated disease surveillance and response World Health Organization
[http://www.who.int/countries/eth/areas/surveillance/en/index.html]. 14. Odero W, Rotich J, Yiannoutsos CT, Ouna T, Tierney WM: Innovative
approaches to application of information technology in disease surveillance and prevention in Western Kenya. J Biomed Inform 2007,
40:390-397.
15. Cusimano MD, Chipman M, Glazier RH, Rinner C, Marshall SP: Geomatics in injury prevention: the science, the potential and the limitations. Inj Prev 2007, 13:51-56.
16. Schuurman N, Hameed SM, Fiedler R, Bell N, Simons RK: The spatial epidemiology of trauma: the potential of geographic information science to organize data and reveal patterns of injury and services.
Can J Surg 2008, 51:389-395.
17. Lightstone AS, Dhillon PK, Peek-Asa C, Kraus JF: A geographic analysis of motor vehicle collisions with child pedestrians in Long Beach, California: comparing intersection and midblock incident locations. Inj Prev 2001, 7:155-160.
18. Schuurman N, Cinnamon J, Crooks VA, Hameed SM: Pedestrian injury and the built environment: an environmental scan of hotspots. BMC Public Health 2009, 9:233.
19. Yiannakoulias N, Rowe BH, Svenson LW, Schopflocher DP, Kelly K, Voaklander DC: Zones of prevention: the geography of fall injuries in the elderly. Soc Sci Med 2003, 57:2065-2073.
20. Lai P, Low C, Wong M, Wong W, Chan M: Spatial analysis of falls in an urban community of Hong Kong. Int J Health Geogr 2009, 8:14. 21. Deshpande A, Jadad AR: Web 2.0: Could it help move the health system
into the 21st century? J Men Health Gender 2006, 3:332-336. 22. developerWorks Interviews: Tim Berners-Lee [http://www.ibm.com/
developerworks/podcast/dwi/cm-int082206txt.html]
23. Rinner C, Kessler C, Andrulis S: The use of Web 2.0 concepts to support deliberation in spatial decision-making. Comput Environ Urban 2008,
32:386-395.
24. Murugesan S: Understanding Web 2.0. IT Professional 2007, 9:34-41. 25. Organization for Economic Co-operation and Development: Participative
Web and User-Created Content: Web 2.0, Wikis and Social Networking.
Science and Information Technology. Paris 2007.
26. Cheung KH, Yip KY, Townsend JP, Scotch M: HCLS 2.0/3.0: Health care and life sciences data mashup using Web 2.0/3.0. J Biomed Inform 2008,
41:694-705.
27. Gambadauro P, Magos A: Office 2.0: a web 2.0 tool for international collaborative research. Lancet 2008, 371:1837-1838.
28. Google: Google Docs. Mountain View, CA 2008.
29. ThinkFree Corporation: ThinkFree Office. Seoul, South Korea 2008. 30. Lake R, Farley J: Infrastructure for the Geospatial Web. In The Geospatial
Web: How Geobrowsers, Social Software, and the Web 20 are Shaping the Network Society Edited by: Scharl A, Tochtermann K. London: Springer; 2007.
31. Elwood S: Geographic Information Science: new geovisualization technologies - emerging questions and linkages with GIScience research. Prog Human Geog 2009, 33:256-263.
32. Goodchild MF: The use cases of digital earth. Int J Digital Earth 2008,
1:31-42.
33. Sheppard SRJ, Cizek P: The ethics of Google Earth: Crossing thresholds from spatial data to landscape visualisation. J Environ Manage 2009,
90:2102-2117.
34. Boulos MNK, Burden D: Web GIS in practice V: 3-D interactive and real-time mapping in Second Life. Int J Health Geogr 2007, 6:51.
35. Butler D: Virtual globes: The web-wide world. Nature 2006, 439:776-778. 36. Google: Google Earth. Mountain View, CA 2008.
37. NASA: World Wind. Moffett Field, CA 2008. 38. ESRI: ArcGIS Explorer. Redlands, CA 2008.
39. Boulos MNK, Wheeler S: The emerging Web 2.0 social software: An enabling suite of sociable technologies in health and health care education. Health Info Libr J 2007, 24:2-23.
40. Johnson DP: Public Participation Geographic Information Systems as Surveillance Tools in Urban Health. In Geo-Spatial Technologies in Urban Environments, 2nd ed Policy, Practice, and Pixels Edited by: Jensen RR, Gatrell JD, McLean D. Heidelberg: Springer; 2007:109-120.
41. Butler D: Data sharing: the next generation. Nature 2007, 446:10-11.
42. Wood J, Dykes J, Slingsby A, Clarke K: Interactive visual exploration of a large spatio-temporal dataset: Reflections on a geovisualization mashup. IEEE T Vis Comput Gr 2007, 13:1176-1183.
43. Boulos MNK: Web GIS in practice III: creating a simple interactive map of England's Strategic Health Authorities using Google Maps API, Google Earth KML, and MSN Virtual Earth Map Control. Int J Health Geogr 2005,
4:22.
44. Web 2.0 can benefit the world's poor [http://www.scidev.net/en/ opinions/web-20-can-benefit-the-worlds-poor.html]
45. Lozano-Fuentes S, Elizondo-Quiroga D, Farfan-Ale JA, Lorono-Pino MA, Garcia-Rejon J, Gomez-Carro S, Lira-Zumbardo V, Najera-Vazquez R, Fernandez-Salas I, Calderon-Martinez J, Dominguez-Galera M, Mis-Avila P, Morris N, Coleman M, Moore CG, Beaty BJ, Eisen L: Use of Google Earth to strengthen public health capacity and facilitate management of vector-borne diseases in resource-poor environments. Bull World Health Organ 2008, 86:718-725.
46. Kamadjeu R: Tracking the polio virus down the Congo River: a case study on the use of Google Earth (TM) in public health planning and mapping. Int J Health Geogr 2009, 8:4.
47. Chandrasekhar CP, Ghosh J: Information and communication technologies and health in low income countries: the potential and the constraints. Bull World Health Organ 2001, 79:850-855.
48. Nwomeh B, Lowell W, Kable R, Haley K, Ameh E: History and development of trauma registry: lessons from developed to developing countries. World J Emerg Surg 2006, 1:32.
49. Miller CC: A beast in the field: The Google Maps mashup as GIS/2.
Cartographica 2006, 41:187-199.
50. Stensgaard AS, Saarnak CFL, Utzinger J, Vounatsou P, Simoonga C, Mushinge G, Rahbek C, Mohlenberg F, Kristensen TK: Virtual globes and geospatial health: the potential of new tools in the management and control of vector-borne diseases. Geospat Health 2009, 3:127-141. 51. Chang A, Parrales M, Jimenez J, Sobieszczyk M, Hammer S, Copenhaver D,
Kulkarni R: Combining Google Earth and GIS mapping technologies in a dengue surveillance system for developing countries. Int J Health Geogr
2009, 8:49.
52. Conroy GC, Anemone RL, Van Regenmorter J, Addison A: Google Earth, GIS, and the Great Divide: A new and simple method for sharing paleontological data. J Hum Evol 2008, 55:751-755.
53. Google Earth Outreach [http://earth.google.com/outreach/index.html] 54. What is Google.org? [http://www.google.org/about.html]
55. Scotch M, Yip KY, Cheung KH: Development of grid-like applications for public health using Web 2.0 mashup techniques. J Am Med Inform Assn
2008, 15:783-786.
56. Boulos MNK, Maramba I, Wheeler S: Wikis, blogs and podcasts: a new generation of Web-based tools for virtual collaborative clinical practice and education. Int J Health Geogr 2006, 6:41.
57. Guralnick RP, Hill AW, Lane M: Towards a collaborative, global infrastructure for biodiversity assessment. Ecol Lett 2007, 10:663-672. 58. Dwolatzky B, Trengove E, Struthers H, McIntyre J, Martinson N: Linking the
global positioning system (GPS) to a personal digital assistant (PDA) to support tuberculosis control in South Africa: a pilot study. 2006, 5:34. 59. ICT Statistics [http://www.itu.int/ITU-D/ict/statistics/ict/index.html] 60. Cohen E, Masum H, Berndtson K, Saunders V, Hadfield T, Panjwani D, Persad D, Minhas G, Daar A, Singh J, Singer P: Public engagement on global health challenges. BMC Public Health 2008, 8:168.
61. Missen CC, Cook TM: Appropriate information-communications technologies for developing countries. Bull World Health Organ 2007,
85:245-324.
62. Brooks S, Donovan P, Rumble C: Developing nations, the digital divide and research databases. Serials Review 2005, 31:270-278.
63. Boulos M, Scotch M, Cheung KH, Burden D: Web GIS in practice VI: a demo playlist of geo-mashups for public health neogeographers. Int J Health Geogr 2008, 7:38.
64. Permission Guidelines for Google Maps and Google Earth [http:// www.google.com/permissions/geoguidelines.html]
doi: 10.1186/1476-072X-9-25