https://doi.org/10.5194/gmd-11-1115-2018 © Author(s) 2018. This work is distributed under the Creative Commons Attribution 3.0 License.
Polar boundary layer bromine explosion and ozone depletion events
in the chemistry–climate model EMAC v2.52: implementation and
evaluation of AirSnow algorithm
Stefanie Falk1,aand Björn-Martin Sinnhuber1
1Institute of Meteorology and Climate Research, Karlsruhe Institute of Technology, Karlsruhe, Germany anow at: Department of Geosciences, University of Oslo, Oslo, Norway
Correspondence:Stefanie Falk ([email protected]) Received: 23 May 2017 – Discussion started: 6 July 2017
Revised: 23 February 2018 – Accepted: 6 March 2018 – Published: 28 March 2018
Abstract. Ozone depletion events (ODEs) in the polar boundary layer have been observed frequently during spring-time. They are related to events of boundary layer en-hancement of bromine. Consequently, increased amounts of boundary layer volume mixing ratio (VMR) and vertical col-umn densities (VCDs) of BrO have been observed by in situ observation, ground-based as well as airborne remote sensing, and from satellites. These so-called bromine explo-sion (BE) events have been discussed serving as a source of tropospheric BrO at high latitudes, which has been un-derestimated in global models so far. We have implemented a treatment of bromine release and recycling on sea-ice-and snow-covered surfaces in the global chemistry–climate model EMAC (ECHAM/MESSy Atmospheric Chemistry) based on the scheme of Toyota et al. (2011). In this scheme, dry deposition fluxes of HBr, HOBr, and BrNO3 over
ice-and snow-covered surfaces are recycled into Br2 fluxes. In
addition, dry deposition of O3, dependent on temperature
and sunlight, triggers a Br2release from surfaces associated
with first-year sea ice. Many aspects of observed bromine enhancements and associated episodes of near-complete de-pletion of boundary layer ozone, both in the Arctic and in the Antarctic, are reproduced by this relatively simple approach. We present first results from our global model studies ex-tending over a full annual cycle, including comparisons with Global Ozone Monitoring Experiment (GOME) satellite BrO VCDs and surface ozone observations.
1 Introduction
bromine to the atmosphere (Sander et al., 2006). However, measurements of Br2release in dependence of illumination
and ozone volume mixing ratio (VMR) from various types of snow and ice indicate that neither sea ice itself nor brine ici-cles are a major source for Br2(Pratt et al., 2013). Pratt et al.
(2013) have also found that not only snow on sea ice has to be taken into consideration as source of bromine but also snow on land surfaces may contribute. In addition to these natu-ral sources, anthropogenic NOx emissions enhance reactive bromine species in the polar boundary layer (Custard et al., 2015). Recent reviews on the subject are provided by Simp-son et al. (2007), Saiz-Lopez and von Glasow (2012), and Abbatt et al. (2012). There has been considerable progress in describing the mechanisms involved in bromine release and boundary layer ODEs based on field measurements, lab-oratory experiments, and process modeling (Toyota et al., 2014b). Regarding the underlying heterogeneous chemical reactions, some similarities can be drawn between the very cold polar boundary layer and the polar upper troposphere – lower stratosphere (UTLS), where polar stratospheric clouds (PSCs) play a major role in halogen activation. In these cold regimes, icy surfaces allow or accelerate reactions, which are impossible or rather slow in gas-phase chemistry. For sus-taining catalytic ozone depletion, the activation of halogens through heterogeneous reactions is very important. Accord-ing to Abbatt et al. (2012), the existAccord-ing modelAccord-ing approaches can be grouped into four categories:
– frost flowers (→sea salt aerosol formation), – bulk ice and snow (→Br2release),
– blowing of saline snow (→ uplifting of sea salt and aerosol formation), and
– snowpack (photo)chemistry (→Br2release).
Frost flowers covered in high saline brine are sturdy while fragile in appearance and contribute less to saline aerosol for-mation and BE events than originally anticipated (Domine et al., 2005). Br−enriched brine is formed on sea ice through drainage and precipitation of hydrohalite (NaCl·2H2O) at
temperatures below 251 K (Abbatt et al., 2012, and refer-ences therein). In the course of summer, most salt is washed out from sea ice. Therefore, multi-year sea ice contains much less salt than first-year ice and may be discarded as a ma-jor source of BE events. The importance of acidity for re-action kinetics on icy surfaces strongly depends on the in-volved species. While HOBr uptake on frozen NaBr/NaCl solutions is not dependent on acidity (Adams et al., 2002), uptake reactions of gas-phase O3 are fastest on acidic
me-dia (Oldridge and Abbatt, 2011). Br2as a precursor of BrO
is formed in complex heterogeneous photochemistry, which is taking place in the quasi-liquid layer on ice grains in the snowpack (Thomas et al., 2011; Pratt et al., 2013). The rate at which Br2is released is mainly limited by mass transfer
from the atmosphere to snow or ice due to the rapid reac-tion of HOBr to Br2 (Huff and Abbatt, 2000). Ozone itself
has the capacity of triggering autocatalytic reactions by ox-idizing bromine in snow and ice photochemically as well as non-photochemically. Subsequently, Br2is released.
On the basis of empirical and modeling results, Toyota et al. (2011) presented a parameterization of Br2release from
bulk ice and snow within the Global Environmental Multi-scale model with Air Quality processes (AQ). GEM-AQ is based on Canada’s operational weather prediction model developed by the Meteorological Services of Canada (MSC) for the interaction of atmospheric chemistry with sea ice and snow surfaces. Toyota et al. (2011) have shown that many aspects of observed bromine enhancements and bound-ary layer ODEs in Arctic spring can be reproduced with their simple approach of recycling HOBr, BrNO3, and HBr into
Br2.
Here, we present an implementation of a mechanism based on the work of Toyota et al. (2011) into the ECHAM/MESSy Atmospheric Chemistry (EMAC) model (Jöckel et al., 2010). The mechanism and its integration into the existing sub-model ONEMIS (Kerkweg et al., 2006a) are described in Sect. 2. In Sect. 3, results from several 1-year long integra-tions of the model with and without bromine release are pre-sented and compared to observations of BrO vertical column density (VCD) from the Global Ozone Monitoring Experi-ment (GOME) satellite instruExperi-ment aboard the European Re-mote Sensing (ERS)-2 satellite (Richter et al., 1998, 2002) (Sect. 3.1) as well as surface ozone observations (Sect. 3.2). We show that many aspects of observations regarding BrO enhancements and ODEs are reproduced by this mechanism without any further tuning of parameters. Unlike Toyota et al. (2011), we do not focus on Arctic springtime only but investi-gate the applicability of the mechanism on a full annual cycle and in both hemispheres.
2 Model and experiments
fa-cility functions for flux-to-tracer concentration conversions. According to the MESSy philosophy, ONEMIS is separated into a submodel interface layer (SMIL) for unified data han-dling among different submodels and an implementation layer of the actual emission mechanisms (submodel core layer, SMCL). A recap of the mechanism proposed by Toy-ota et al. (2011) (Sect. 2.1) and details about its integration into the EMAC model (Sect. 2.2) are given in the following. In Sect. 2.3, the scope and setup of a set of test experiments are summarized.
2.1 Description of the mechanism
Toyota et al. (2011) assume that at least part of the observed Br2 flux originates from heterogeneous reactions on snow
grains in the surface layer of a snowpack (Pratt et al., 2013). These snow grains are considered coated by a Br−enriched film of liquid water and show a distinct acidity. In this quasi-liquid phase, heterogeneous reactions of HOBr and BrNO3
with either Br−and Cl−can take place: HOBr+Br− H
+
−→Br2+H2O, (R1)
BrNO3+Br−→Br2+NO−3, (R2)
HOBr+Cl− H +
−→BrCl+H2O, (R3)
BrNO3+Cl−→BrCl+NO−3. (R4)
Interhalogen reactions may convert BrCl into Br2:
BrCl+Br−↔Br2+Cl−. (R5)
BrCl is partly released to the atmosphere before undergo-ing this last reaction. In addition, various photochemical gas-, aqueous-, and heterogeneous-phase reactions are tak-ing place in the top layer of the snowpack (for details, see, e.g., Pratt et al., 2013, Fig. 2). A list of heterogeneous reac-tions involving bromine included in the Module Efficiently Calculating the Chemistry of the Atmosphere (MECCA) is provided in Sect. S1 in the Supplement. Another reaction pathway oxidizing bromine is triggered by ozone dry deposi-tion. Three surface types, first-year sea ice (FY), multi-year sea ice (MY), and snow on land (LS), are differentiated. In any case, the respective surface temperature has to be below a temperature thresholdTcrit. The critical conversion of a dry
deposition flux of ozone (8O3) into an emission flux of Br2 (or BrCl) is moderated by an ad hoc molar yield81,
depen-dent on surface type and illumination. Toyota et al. (2011) have parameterized the above heterogeneous reaction path-ways (Reactions R1–R4), which transform any of the dry de-position fluxes of HOBr, BrNO3, or O3 to Br2in a simple
way, taking state-of-the-art knowledge into account:
81=
0.001 if dark FY, 0.075 if sunlit FY, 0 if MY or LS.
(1)
That is, on FY sea ice, only 0.1 % of the dry deposition of O3will be converted into Br2in the case that the surface
is not sunlit (the Sun’s zenith angle aboveθcrit=85◦);
oth-erwise, 7.5 % is converted. No release of Br2from MY sea
ice or LS is assumed. The specific value of81has been
ob-tained as the best choice by cross-validating modeling results with observed springtime boundary layer ozone data at Alert, Utqia˙gvik (formerly Barrow), and Zeppelin (Toyota et al., 2011, Sect. 3.1).
The conversion of dry deposition fluxes of HOBr (8HOBr),
BrNO3 (8BrNO3), and HBr (8HBr) is considered indepen-dent of illumination. In the case of FY sea ice, the snow-pack on top is regarded as an infinite pool of Br− and Cl−. The sum of HOBr and BrNO3 dry deposition fluxes
(8HOBr+8BrNO3) is fully recycled into Br2. In the case of MY sea ice, only the Cl− pool remains infinite, for Cl− is about 2 to 3 orders of magnitude more abundant in snow than Br− (Toyota et al., 2011). The release of Br
2depends
on8HOBr+8BrNO3in comparison to the dry deposition flux of HBr. If8HOBr+8BrNO3was less than8HBr, a full conver-sion of8HOBr+8BrNO3to Br2is assumed. Otherwise, only half of the difference8HOBr+8BrNO3−8HBris recycled to Br2; the other half is converted to BrCl. For LS, neither Br−
nor Cl− is available unlimited. Hence, only the smaller of 8HOBr+8BrNO3 and8HBris converted to Br2. The resulting “yield” is summarized in82:
82=
1 if FY,
0.5−1 if MY, 0−1 if LS.
(2)
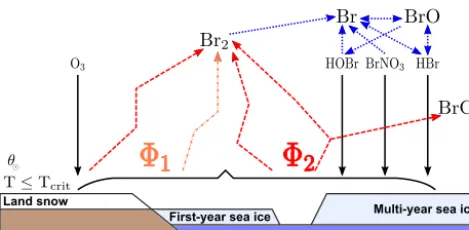
Schematically, all release scenarios are shown in Fig. 1 (adapted from Fig. 1 of Toyota et al., 2011). Herein, black arrows denote dry deposition of HOBr, BrNO3, HBr, and O3.
Blue dotted arrows indicate gas-phase photochemistry. The recycled fluxes are displayed by dashed orange (O3) and red
(HOBr, BrNO3, HBr) arrows.
2.2 Implementation
In accordance with the described scheme, the submodel interface layer (SMIL), submodel core layer (SMCL), and namelist of ONEMIS have been extended based on EMAC version 2.52. Channel objects, used by the sub-routine airsnow_emissions (implemented in SMCL), include surface temperature (tsurf), fraction of snow cover on land (cvs), fraction of ice cover on the ocean (seaice), cosine of the Sun’s zenith angle (cossza), and dry deposition fluxes of HOBr, BrNO3, HBr, and O3
Land snow Multi-year sea ice First-year sea ice
Figure 1.Schematic scenario of bromine release from first-year sea ice, multi-year sea ice, and land snow adapted from Toyota et al.
(2011) for a temperature thresholdTcrit. Black arrows denote dry
deposition of HOBr, BrNO3, HBr, and O3. Blue dotted arrows
in-dicate gas-phase photochemistry. Dry deposition fluxes are recycled
into Br2with respect to a molar yield81in the case of O3(dashed
orange) and82in the case of the brominated species (dashed red).
be provided through data import. Currently, we are using a MYSIC estimate based on mean SIC from ERA-Interim (see Sect. 2.3). Steering parameters,81,Tcrit, andθcrit, can
be changed in the corresponding control sequence within the ONEMIS namelist file. However, the parameter rele-vant to MY sea ice and LS in 81 is currently not used,
since no parameterization has been provided by Toyota et al. (2011). New output channels snow_air_flux_br2and snow_air_flux_brclhave been defined in the SMIL of ONEMIS. More details about the algorithm implemented in the subroutineairsnow_emissionsare provided in the form of a Nassi–Shneiderman diagram in Sect. S2. The new emission mechanism has been named “AirSnow” and can be switched on in the ONEMIS namelist – an example ex-cerpt has been added to the Supplement (Sect. S3). After Br2
has been released, we make use of EMAC’s standard atmo-spheric bromine chemistry (Sect. S1) that has been optimized for stratospheric conditions (e.g., Sinnhuber and Meul, 2015; Falk et al., 2017). This treatment, however, might not be fully sufficient with respect to tropospheric heterogeneous chem-istry on aerosols and should be the subject of future work. 2.3 Validation experiments
Four experiments have been performed using EMAC version 2.52 (see Table 1 for a summary). The basic model setup has been adapted from RC1SD-base-08, which is part of a Chemistry Climate Model Initiative (CCMI) recommended set of simulations by the Earth System Chemistry integrated Modelling (ESCiMo) consortium (Jöckel et al., 2016). The model integrations use specified dynamics nudged to ERA-Interim for the year 2000. Accordingly, ERA-ERA-Interim sea ice cover (SIC) has been used. The chosen spatial resolution is T42L90MA, corresponding to a 2.8◦×2.8◦ grid, with a top level at 0.01 hPa and distributed to 90 levels. Output has been saved with 1-hourly temporal resolution. In contrast to
RC1SD-base-08, fluxes of brominated very short-lived sub-stances (VSLSs), CH2Br2and CHBr3, are computed online
from sea water concentrations (Ziska et al., 2013) using the EMAC submodel AIRSEA (Pozzer et al., 2006) as described by Lennartz et al. (2015). In this scheme, sea ice acts as a lid blocking the emission of VSLSs to the atmosphere. Com-prehensive tropospheric and stratospheric chemistry as well as heterogeneous reactions within MECCA (Sander et al., 2011) have been activated for an aerosol surface area con-centration climatology.
The basic parameter setup has been adopted without changes as proposed by Toyota et al. (2011). The temper-ature threshold for all simulations has beenTcrit= −15◦C,
accordingly.
In EMAC, no discrimination is made between FY sea ice and MY sea ice; therefore, we initially assume all ice to be first year (BrXplo_fysic). A multi-year sea ice cover has been computed from RC1SD-base-08 10-hourly SIC output, which is based on ERA-Interim. We regard ice at a fixed lo-cation that survived one melting season as multi-year. Hence, for simplicity, we assume no drift of ice masses. SIC has been integrated for respective summer months in the Northern Hemisphere (August/September) and Southern Hemisphere (February/March). The SIC at the minimum of the integrated SIC has been chosen as MYSIC for the respective year after. The resulting MYSIC for the year 2000 is shown in Fig. 2 together with monthly mean SIC for April (Northern Hemi-sphere) and September (Southern HemiHemi-sphere). The result is very similar with regard to patterns and extent of MYSIC on maps retrieved from satellite observation (US National Snow & Ice Data Center (NSIDC), 2017). Based on this MYSIC estimate, a second model integration (BrXplo_mysic) has been conducted. For comparison, a reference simulation with the bromine release mechanism switched off has been done (referred to as BrXplo_ref). In a further sensitivity simula-tion, we have decreased the dry deposition of ozone over snow-covered regions as proposed by Helmig et al. (2007) by changing the surface resistance in DDEP for ozone on snow and ice surfaces from the value of rOice−snow
3 =2000 s m −1
(Wesely, 1989) torOice−snow
3 =10 000 s m
−1 (Helmig et al.,
2007).
3 Results
In this section, we compare the results of our model ex-periments with observational data. Br2, which has been
re-leased from ice and snow, is transformed into BrO photolyt-ically. The enhancements of Br2, therefore, lead to an
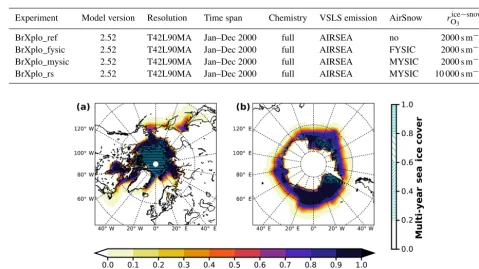
Table 1.EMAC model experiments used in this study. All experiments have been done using specified dynamics nudged to ERA-Interim. Accordingly, ERA-Interim SIC has been used. The setup is based on the consortial ESCiMo simulation RC1SD-base-08. Experiments have been performed for an assumption of first-year sea ice only (FYSIC) and for a multi-year sea ice cover (MYSIC) estimated from SIC. The
temperature threshold for all simulations has beenTcrit= −15◦C, accordingly.
Experiment Model version Resolution Time span Chemistry VSLS emission AirSnow rOice−snow
3
BrXplo_ref 2.52 T42L90MA Jan–Dec 2000 full AIRSEA no 2000 s m−1
BrXplo_fysic 2.52 T42L90MA Jan–Dec 2000 full AIRSEA FYSIC 2000 s m−1
BrXplo_mysic 2.52 T42L90MA Jan–Dec 2000 full AIRSEA MYSIC 2000 s m−1
BrXplo_rs 2.52 T42L90MA Jan–Dec 2000 full AIRSEA MYSIC 10 000 s m−1
Figure 2.Sea ice cover fraction and estimated multi-year sea ice cover fraction for the year 2000. Mean SIC is shown for April in the Northern Hemisphere and September in the Southern Hemisphere. MYSIC has been computed from RC1SD-base-08 10-hourly SIC based
on ERA-Interim. For simplicity, we assume ice that survived one melting season at a fixed location as multi-year.(a)Northern Hemisphere;
(b)Southern Hemisphere.
their temporal occurrence at specific ground-based observa-tion sites in both hemispheres and discuss the limitaobserva-tions of the current bromine release mechanism (Sect. 3.2).
3.1 Total BrO vertical column density
We first qualitatively discuss similarities and differences in spatial patterns between BrO total VCD observation and model. Afterwards, we assess the same patterns in a more quantitative way, comparing VCD anomalies for both obser-vation and model, with respect to monthly zonal averages.
In Fig. 3a, monthly mean BrO VCDs from GOME trievals are shown for both northern and southern polar re-gions in April and September, respectively. In April, GOME data display enhanced BrO VCD across the whole coastal region of the Arctic Ocean down the Hudson Bay. There are signs of slight enhancements in the Antarctic coastal regions, where data are available, but no hot spot can be determined. In September, enhancements above Antarctica are in particu-lar found in the Ross and Weddell sea areas. As expected, no enhancements are found in the Northern Hemisphere.
From 1-hourly BrO profiles of the EMAC model output, a total VCD has been integrated and resampled to 10:00– 11:00 LST, according to the ERS-2 Equator crossing time of 10:30 LT. Strictly speaking, this is not correct, in general, for transition times at high latitudes differ from the Equator crossing time due to the satellite orbit. Differences in local time may account for part of the differences seen in the fol-lowing BrO comparison.
The resampled data have been averaged monthly and are shown in Fig. 3b). Note, as there is an offset be-tween EMAC and GOME BrO VCD (roughly (2−4)×
Figure 3. Monthly mean total VCD of BrO for the Arctic and Antarctic (April and September), respectively. EMAC data have been sampled in accordance at 10:00–11:00 LST. Different color scale ranges have been chosen to illustrate the similarities in the spatial distribution of the data rather than the absolute amount of
BrO VCD.(a)GOME;(b)EMAC (BrXplo_mysic).
main BrO enhancements in the Ross and Weddell sea areas, while in April we identify a hot spot in the Ross Sea area that is not shown by the observations.
To highlight the BE events, we have computed anomalies of monthly mean VCD of BrO for both GOME and EMAC
Figure 4.Anomalies of monthly mean VCD of BrO for the Arctic
and Antarctic (April and September) with respect to monthly aver-aged zonal mean (see Sect. S4), respectively. EMAC data have been
sampled in accordance at 10:00–11:00 LST.(a)GOME;(b)EMAC
(BrXplo_mysic).
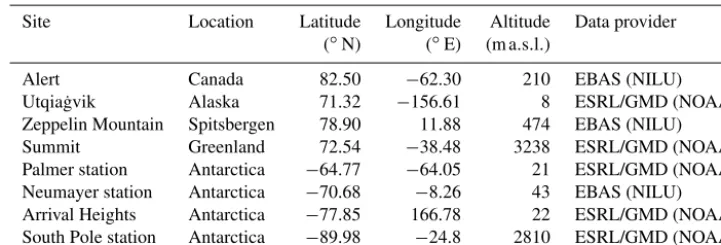
Table 2.Observation sites for surface ozone comparison. However, for Palmer station and Arrival Heights, no observations of surface ozone are available for the year 2000, so we present only model results for these two stations.
Site Location Latitude Longitude Altitude Data provider
(◦N) (◦E) (m a.s.l.)
Alert Canada 82.50 −62.30 210 EBAS (NILU)
Utqia˙gvik Alaska 71.32 −156.61 8 ESRL/GMD (NOAA)
Zeppelin Mountain Spitsbergen 78.90 11.88 474 EBAS (NILU)
Summit Greenland 72.54 −38.48 3238 ESRL/GMD (NOAA)
Palmer station Antarctica −64.77 −64.05 21 ESRL/GMD (NOAA)
Neumayer station Antarctica −70.68 −8.26 43 EBAS (NILU)
Arrival Heights Antarctica −77.85 166.78 22 ESRL/GMD (NOAA)
South Pole station Antarctica −89.98 −24.8 2810 ESRL/GMD (NOAA)
is found down the Hudson Bay, and minor hot spots appear east of Novaya Zemlya in the Sea of Okhotsk, and Hokkaido. A corresponding negative anomaly is located across the Bar-ents, Greenland and Norwegian seas. There are only slight enhancements in the Antarctic coastal regions. In September, hot spots around Antarctica can be in particular observed in the Ross and Weddell sea areas with corresponding negative anomalies located across the Bellingshausen and Amundsen seas.
In comparison to GOME data, spatial patterns of BrO VCD are astonishingly well reproduced by EMAC. Only westward from the Hudson Bay no BrO enhancement is found, and there is no negative anomaly between Greenland and Novaya Zemlya in the model. The Hokkaido hot spot appears slightly shifted northward. In September, both ob-servation and model agree well in both hemispheres. The hot spot in the Ross Sea area that occurs in the simulation cannot be identified from satellite observations, for these are rather sparse in April. One needs to be cautious when drawing con-clusions solely based on these comparisons, for we have used total VCD; the actual BE events might as well be disguised by variations in the stratospheric BrO column.
A full overview of monthly mean total BrO VCD for both observations and model, including all months, has been in-cluded in Appendix A (Figs. A1–A4), respectively. In the Northern Hemisphere, the implemented mechanism is ap-parently prone to BrO VCD enhancements shifted to early winter compared to GOME retrievals. The occurrence of BE events in fall is not supported by any observation. In late spring and early summer, however, too few BrO is formed in the model. This may hint at sources of BrO in the Arc-tic, which are not represented by this mechanism, or an ad-herence to the chosen parameters. Further studies would be needed to resolve the source of this discrepancy. In the South-ern Hemisphere, the modeled BrO enhancements in, e.g., August and September are similar in their occurrence, while the sparseness of GOME data in austral winter does not per-mit further conclusions regarding the quality of the param-eterization in this region. Taking a look at the zonally av-eraged total BrO VCD (Sect. S4), we find that the modeled
BrO VCD is generally too small in polar summer compared to observation by about(1−4)×1013molecules cm−2in both hemispheres, respectively. A better agreement between ob-servation and model is achieved in winter. This is due to the implementation of the bromine release mechanism (dotted lines indicating the reference simulation). Hence, taking the bromine released from ice and snow into account, the over-all model performance is enhanced with respect to polar BrO observation.
3.2 Ozone depletion events
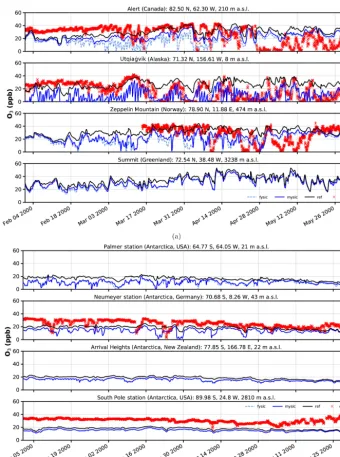
Regarding depletion events of surface ozone, four differ-ent observation sites have been chosen in each hemisphere for comparison (Table 2). No data for Arrival Heights and Palmer station have been available in 2000. For these sta-tions, we show model results only.
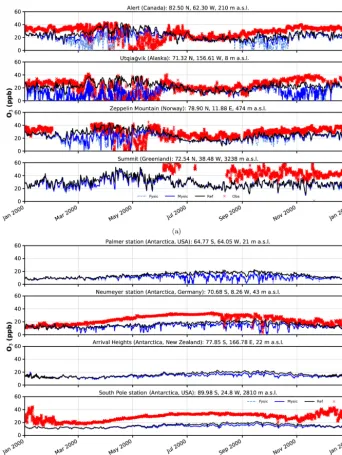
Time series of surface ozone VMR are shown in Figs. 5– 6, including both in situ observations (where available) and model simulations. For each simulation, the nearest grid point has been chosen as representative. In general, we find a good agreement between BrXplo_ref and observations for seasons without bromine release from ice and snow, except for Summit, South Pole station, and Neumayer station in austral winter, where model results are systematically lower compared to observations. In the case of BrXplo_fysic, all northern hemispheric sites display depletion events in spring as well as in fall. While the depletion events are not en-tirely in temporal coincidence with observed events, their frequency is generally well reproduced. However, events of ozone depletion in fall are not present in observation data. For Zeppelin Mountain and Alert, these “fault events” are due to the FYSIC assumption. When a decent multi-year sea ice cover is implemented in BrXplo_mysic, most of them vanish. In the case of Utqia˙gvik, a closer look at spring re-veals an astonishing temporal as well as quantitative coin-cidence of surface ozone VMR especially in April (Fig. 6). The apparent “wiggles” are partly due to hard trigger thresh-oldsTcritandθcrit, but similar structures are in fact apparent
Figure 5.Surface ozone mixing ratios at four different observation sites. Comparison of in situ measurements (red crosses) with results from simulation (solid black – EMAC v2.52 default (no bromine explosions); light blue dashed – FYSIC; solid blue – MYSIC). Representatively,
the nearest grid point has been chosen.(a)Northern Hemisphere;(b)Southern Hemisphere.
diurnal variation of O3. At Alert, our model does not
cap-ture the 2000s ODEs that inflicted continuously low surface ozone levels for several days from late April until early May. As pointed out by Strong et al. (2002), this long-lasting de-pletion event was related to transport of ozone-poor air orig-inating from a region north of Ellesmere Island and the east-ern Arctic Ocean, respectively. It is not clear whether trans-port of ozone-depleted air masses or depletion itself is too weak in our simulation. At about the same time (late April, early May), the observation displays a series of ODEs at Zep-pelin Mountain, which is also only partly reproduced by the
Figure 6.Surface ozone mixing ratios at four different observation sites for spring and austral spring, respectively. Comparison of in situ measurements (red crosses) with results from simulation (solid black – EMAC v2.52 default (no bromine explosions); light blue dashed –
FYSIC; solid blue – MYSIC). Representatively, the nearest grid point has been chosen.(a)Northern Hemisphere;(b)Southern Hemisphere.
ODEs in the Southern Hemisphere is not affected by this. De-spite the original mechanism’s validation for northern hemi-spheric spring (Toyota et al., 2011), comparisons of time se-ries for the Southern Hemisphere do display ozone depletion events in a similar frequency as found in observational data. At Neumayer station, we find some events in late October and early November that might be coincidental, but in most cases simulated ODEs show up later than actually observed ODEs.
In summary, while some aspects of ODEs are reproduced remarkably well by the implemented mechanism, especially
the long-lasting event at Alert is not reproduced at all. This strongly hints at the involvement of further mechanisms, e.g., blowing snow and sea spray or even anthropogenic NOx (Custard et al., 2015), in the depletion of polar surface ozone which have not yet been modeled in EMAC. In BrXplo_rs with reduced dry deposition, ozone depletion events in fall and midwinter are suppressed and the agreement with ob-served ozone is generally improved.
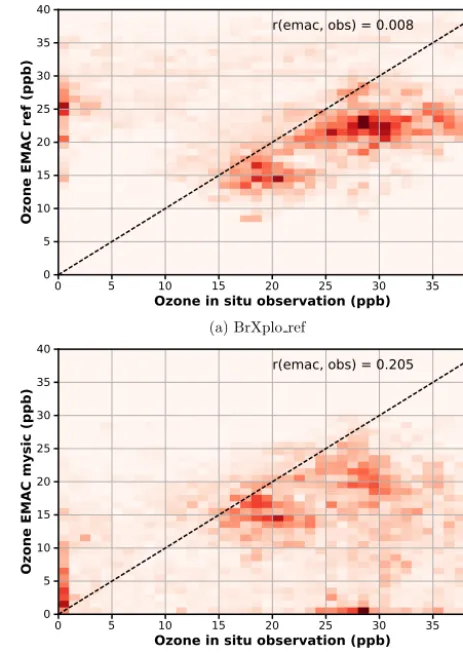
tro-pospheric GOME BrO VCD with modeled BrO, we as-sess the correlation between observed and modeled surface ozone. The correlation between observed and modeled sur-face ozone at Utqia˙gvik is shown in Fig. 7. Additional cor-relation plots for the other stations in the Northern Hemi-sphere, as well as additional plots for the sensitivity simu-lation with reduced ozone dry deposition are provided in the Supplement (Sects. S5–S6). As already evident from the time series in Fig. 6, low surface ozone values largely absent in the reference simulation are reproduced by the EMAC simu-lations with included bromine release mechanism. However, some fault events are also generated, which are not present in observations. Overall, the linear correlation coefficients between modeled and observed ozone are improved by in-clusion of the bromine explosion mechanism (from 0.008 to 0.21 at Utqia˙gvik).
In Fig. 8, the time-lagged correlation coefficients between observed surface ozone and different model experiments (BrXplo_ref, BrXplo_mysic, and BrXplo_rs) are shown ex-emplarily for Alert and Utqia˙gvik, respectively. Model data have been shifted with respect to the observation. There-fore, a positive lag indicates a later occurrence of low surface ozone in the model experiment. In the case of Utqia˙gvik, the previously diagnosed improvement of the correlation is fur-ther stressed. The time-lagged correlation peaks at a lag of about 2 h, with correlations falling to half of the maximum at about ±2 days. Updating the ozone surface resistance over ice (rOice−snow
3 =10 000 s m
−1) further increases the
correla-tion. In the case of Alert, the correlation peaks between−40 and−48 h regardless, which means low ozone values may occur about 2 days ahead of time in all model experiments. There is no improvement by switching on the bromine re-lease mechanism. We conclude that the mechanism transmut-ing HBr, HOBr, and BrNO3to Br2sufficiently parameterizes
the main traits leading to the depletion of surface ozone in the Utqia˙gvik region but does not describe the situation at Alert well.
4 Discussion and conclusions
We have implemented a bromine release mechanism from sea-ice- and snow-covered land surfaces based on the param-eterization suggested by Toyota et al. (2011) in the global chemistry–climate model EMAC. While the original study Toyota et al. (2011) focused on Arctic springtime only, we extend the simulations to both hemispheres and a full annual cycle. Without any further tuning of the parameters (Tcrit, θcrit, and81), our model simulations with this relatively
sim-ple mechanism successfully reproduce many observed fea-tures of bromine enhancement and ODEs (spatially as well as temporally). The overall model performance regarding BrO VCD and surface ozone concentrations at high latitudes is improved.
0 5 10 15 20 25 30 35 40
Ozone in situ observation (ppb)
0 5 10 15 20 25 30 35 40
Ozone EMAC ref (ppb)
r(emac, obs) = 0.008
(a) BrXplo ref
0 5 10 15 20 25 30 35 40
Ozone in situ observation (ppb)
0 5 10 15 20 25 30 35 40
Ozone EMAC mysic (ppb)
r(emac, obs) = 0.205
(b) BrXplo mysic
Figure 7.Temporal correlation of modeled surface O3with
obser-vation at Utqia˙gvik. Data have been binned in bins of 1 ppb width. While observed low ozone events at Utqia˙gvik are absent in the ref-erence simulation, in the BrXplo_mysic simulation there is now a population where both observation and model simultaneously show low ozone values, which is also reflected in the improved linear
correlation coefficient from 0.008 to 0.21.(a)BrXplo_ref;(b)
BrX-plo_mysic.
120 96 72 48 24 0 24 48 72 96 120
Lag (hours)
0.2 0.1 0.0 0.1 0.2
Correlation coefficient
-47 h-40 h -48 h
1 h 2 h 2 h
Alert_ref Alert_mysic Alert_rs
Utqiagvik_ref Utqiagvik_mysic Utqiagvik_rs
. . .
Figure 8. Time-lagged correlation coefficients between observed surface ozone and different model experiments (BrXplo_ref,
BrX-plo_mysic, and BrXplo_rs) for Alert and Utqia˙gvik, respectively. Model data have been shifted with respect to the observation. Therefore, a positive lag indicates a later occurrence of low surface ozone in the model experiment.
and Antarctic, respectively. While ODEs are very well repro-duced in the case of Utqia˙gvik, there are notable discrepan-cies at other observation sites. At Utqia˙gvik, the time-lagged correlation coefficient analysis, which peaks at about zero lag between observation and model data, displays a significant enhancement if bromine explosions are taken into consid-eration. However, the improvement to reproduce individual ODEs is less clear at other places. In particular, at Alert, the model seems to generate ODEs about 2 days ahead of time. The recognized ODE, which had been observed at Alert in late April/early May in 2000, is not at all reproduced by this bulk-snow-based mechanism. In general, there is a tendency to generate too many ODEs in fall and mid-winter, which is reduced by decreasing the ozone dry deposition (rOice−snow
3 ). Using a reasonable multi-year sea ice cover estimate also re-duces the occurrence of fault events in fall.
The implemented bromine release mechanism relies on various assumptions, e.g.,Tcrit,81. Though these have been
cross-validated with observations by Toyota et al. (2011), they are not entirely constrained. The chosen temperature threshold might be too low regarding the actual physical pro-cesses. Dynamical factors such as wind speed increasing Br2
release through pumping or ventilation of the snow are en-tirely neglected in this parameterization. In addition, the dry deposition, which is one of the key factors in this bromine release mechanism, is still highly uncertain and hard to mea-sure explicitly. Since heterogeneous chemistry on aerosols in the polar boundary layer plays an important role, this is a topic which needs to be elaborated on.
It is plausible that in reality different processes, such as bromine activation by blowing snow, sea spray, or even by NOx from unaccounted anthropogenic sources (Custard
et al., 2015), all play a role and contribute to the bromine explosion events at different sites. Assuming blowing snow as source of bromine-enriched sea salt aerosols, Yang et al. (2010) and Theys et al. (2011) have shown that many bromine explosion events are reproduced in duration, lo-cation, and magnitude for Antarctic sites. However, they remain rather vague in their assessment of discrepancies between model and observation. Comparing both schemes within the same model environment could help to gain a better understanding of bromine explosion events and sub-sequent ozone depletion from the modeling perspective. As shown in this work, MESSy provides a framework in which the various bromine explosion schemes can be implemented in relatively straightforward manner.
With the implemented scheme, following Toyota et al. (2011), and the corresponding model experiments, we have now a basis for, e.g., the validation of bromine explosion events at specific sites using in situ and ground-based BrO data, the evaluation of modeled temporal correlation be-tween BE events and ODEs, the validation of usage of on-line aerosol formation in the polar boundary layer, the valida-tion of heterogeneous chemistry in the polar boundary layer, the implementation and validation of a blowing snow scheme with respect to observation, and the comparison of these two mechanisms.
member of the MESSy Consortium by signing the MESSy Mem-orandum of Understanding. More information can be found on the MESSy Consortium website (http://www.messy-interface.org). The modified code of the submodel ONEMIS described here will be made available with the next official release of the MESSy source code distribution.
Appendix A: Total BrO vertical column density
Figure A1.GOME monthly mean total VCD of BrO for the Arctic and Antarctic.
Figure A2.EMAC (BrXplo_mysic) monthly mean total VCD of BrO for the Arctic and Antarctic. EMAC data have been sampled in
Figure A3.Anomalies of GOME monthly mean VCD of BrO for the Arctic and Antarctic with respect to monthly averaged zonal mean (see Sect. S4).
Figure A4.Anomalies of EMAC (BrXplo_mysic) monthly mean VCD of BrO for the Arctic and Antarctic with respect to monthly averaged
Supplement. The supplement related to this article is available online at: https://doi.org/10.5194/gmd-11-1115-2018-supplement.
Author contributions. SF implemented the described mechanism, and ran and validated the simulations with observational data. BMS suggested this study and took part in the analysis. Both authors con-tributed to the writing of the paper.
Competing interests. The authors declare that they have no conflict of interest.
Special issue statement. This article is part of the special issue “The Modular Earth Submodel System (MESSy) (ACP/GMD inter-journal SI)”. It is not associated with a conference.
Acknowledgements. Parts of this work were supported by the Deutsche Forschungsgemeinschaft (DFG) through the research unit “SHARP” (SI1044/1-2), the German Bundesministerium für Bildung und Forschung (BMBF) through the project “ROMIC-THREAT” (01GL1217B), and the Helmholtz Association through its research program “ATMO”.
Ozone in situ data for Alert, Neumayer station, and Zeppelin Mountain have been made available by the Norwegian Institute for Air Research database of observation data of atmospheric chemical composition and physical properties, EBAS (http://ebas.nilu.no). Data for Alert are provided by Environment Canada/Atmospheric Environmental Service (EC/AES), data for Neumayer station by Helmholtz-Zentrum Geestacht (HZG), and data for Zeppelin Moun-tain by Norwegian Institute for Air Research (NILU).
Ozone in situ data for Utqia˙gvik, Summit, and South Pole sta-tion have been provided by US Department of Commerce/Nasta-tional Oceanic & Atmospheric Administration (NOAA) – Earth System Research Laboratory – Global Monitoring Division (https://www. esrl.noaa.gov/gmd/ozwv/surfoz).
Tropospheric BrO column retrievals from the GOME instrument have been provided courtesy of Andreas Richter and John P. Bur-rows (University of Bremen). The data can be obtained from http: //www.iup.uni-bremen.de/doas/gome_bro_data.htm.
We thank Andreas Richter and Astrid Kerkweg for helpful com-ments on an earlier version of the paper.
We thank Stefan Versick (KIT SimLab Climate and Environ-ment) for technical support concerning the implementation into the EMAC model.
The article processing charges for this open-access publication were covered by a Research
Centre of the Helmholtz Association.
Edited by: Slimane Bekki
Reviewed by: two anonymous referees
References
Abbatt, J. P. D., Thomas, J. L., Abrahamsson, K., Boxe, C., Gran-fors, A., Jones, A. E., King, M. D., Saiz-Lopez, A., Shep-son, P. B., Sodeau, J., Toohey, D. W., Toubin, C., von Glasow, R., Wren, S. N., and Yang, X.: Halogen activation via interac-tions with environmental ice and snow in the polar lower tropo-sphere and other regions, Atmos. Chem. Phys., 12, 6237–6271, https://doi.org/10.5194/acp-12-6237-2012, 2012.
Adams, J. W., Holmes, N. S., and Crowley, J. N.: Uptake and reaction of HOBr on frozen and dry NaCl/NaBr surfaces between 253 and 233 K, Atmos. Chem. Phys., 2, 79–91, https://doi.org/10.5194/acp-2-79-2002, 2002.
Barrie, L. A., Bottenheim, J. W., Schnell, R. C., Crutzen, P. J., and Rasmussen, R. A.: Ozone destruction and photochemical reac-tions at polar sunrise in the lower Arctic atmosphere, Nature, 334, 138–141, https://doi.org/10.1038/334138a0, 1988.
Bottenheim, J. W., Gallant, A. G., and Brice, K. A.:
Measutements of NOy Species and O-3 at
82-Degrees-N Latitude, Geophys. Res. Lett., 13, 113–116, https://doi.org/10.1029/GL013i002p00113, 1986.
Bottenheim, J. W., Fuentes, J. D., Tarasick, D. W., and Anlauf, K. G.: Ozone in the Arctic lower troposphere during winter and spring 2000 (ALERT2000), Atmos. Environ., 36, 2535–2544, https://doi.org/10.1016/S1352-2310(02)00121-8, 2002. Bottenheim, J. W., Netcheva, S., Morin, S., and Nghiem, S. V.:
Ozone in the boundary layer air over the Arctic Ocean: mea-surements during the TARA transpolar drift 2006–2008, Atmos. Chem. Phys., 9, 4545–4557, https://doi.org/10.5194/acp-9-4545-2009, 2009.
Choi, S., Wang, Y., Salawitch, R. J., Canty, T., Joiner, J., Zeng, T., Kurosu, T. P., Chance, K., Richter, A., Huey, L. G., Liao, J., Neu-man, J. A., Nowak, J. B., Dibb, J. E., Weinheimer, A. J., Diskin, G., Ryerson, T. B., da Silva, A., Curry, J., Kinnison, D., Tilmes, S., and Levelt, P. F.: Analysis of satellite-derived Arctic tropo-spheric BrO columns in conjunction with aircraft measurements during ARCTAS and ARCPAC, Atmos. Chem. Phys., 12, 1255– 1285, https://doi.org/10.5194/acp-12-1255-2012, 2012. Custard, K. D., Thompson, C. R., Pratt, K. A., Shepson, P. B., Liao,
J., Huey, L. G., Orlando, J. J., Weinheimer, A. J., Apel, E., Hall, S. R., Flocke, F., Mauldin, L., Hornbrook, R. S., Pöhler, D., Gen-eral, S., Zielcke, J., Simpson, W. R., Platt, U., Fried, A., Weib-ring, P., Sive, B. C., Ullmann, K., Cantrell, C., Knapp, D. J.,
and Montzka, D. D.: The NOx dependence of bromine
chem-istry in the Arctic atmospheric boundary layer, Atmos. Chem. Phys., 15, 10799–10809, https://doi.org/10.5194/acp-15-10799-2015, 2015.
Domine, F., Taillandier, A. S., Simpson, W. R., and Sev-erin, K.: Specific surface area, density and microstruc-ture of frost flowers, Geophys. Res. Lett., 32, L13502, https://doi.org/10.1029/2005GL023245, 2005.
Falk, S., Sinnhuber, B.-M., Krysztofiak, G., Jöckel, P., Graf, P., and Lennartz, S. T.: Brominated VSLS and their influence on ozone under a changing climate, Atmos. Chem. Phys., 17, 11313– 11329, https://doi.org/10.5194/acp-17-11313-2017, 2017. Helmig, D., Ganzeveld, L., Butler, T., and Oltmans, S. J.: The role of
Huff, A. K. and Abbatt, J. P. D.: Gas-Phase Br2
Produc-tion in Heterogeneous ReacProduc-tions of Cl2, HOCl, and BrCl
with Halide-Ice Surfaces, J. Phys. Chem. A, 104, 7284–7293, https://doi.org/10.1021/jp001155w, 2000.
Jacob, D. J., Crawford, J. H., Maring, H., Clarke, A. D., Dibb, J. E., Emmons, L. K., Ferrare, R. A., Hostetler, C. A., Russell, P. B., Singh, H. B., Thompson, A. M., Shaw, G. E., McCauley, E., Pederson, J. R., and Fisher, J. A.: The Arctic Research of the Composition of the Troposphere from Aircraft and Satel-lites (ARCTAS) mission: design, execution, and first results, At-mos. Chem. Phys., 10, 5191–5212, https://doi.org/10.5194/acp-10-5191-2010, 2010.
Jöckel, P., Sander, R., Kerkweg, A., Tost, H., and Lelieveld, J.: Technical Note: The Modular Earth Submodel System (MESSy) – a new approach towards Earth System Modeling, Atmos. Chem. Phys., 5, 433–444, https://doi.org/10.5194/acp-5-433-2005, 2005.
Jöckel, P., Kerkweg, A., Pozzer, A., Sander, R., Tost, H., Riede, H., Baumgaertner, A., Gromov, S., and Kern, B.: Development cycle 2 of the Modular Earth Submodel System (MESSy2), Geosci. Model Dev., 3, 717–752, https://doi.org/10.5194/gmd-3-717-2010, 2010.
Jöckel, P., Tost, H., Pozzer, A., Kunze, M., Kirner, O., Brenninkmei-jer, C. A. M., Brinkop, S., Cai, D. S., Dyroff, C., Eckstein, J., Frank, F., Garny, H., Gottschaldt, K.-D., Graf, P., Grewe, V., Kerkweg, A., Kern, B., Matthes, S., Mertens, M., Meul, S., Neu-maier, M., Nützel, M., Oberländer-Hayn, S., Ruhnke, R., Runde, T., Sander, R., Scharffe, D., and Zahn, A.: Earth System Chem-istry integrated Modelling (ESCiMo) with the Modular Earth Submodel System (MESSy) version 2.51, Geosci. Model Dev., 9, 1153–1200, https://doi.org/10.5194/gmd-9-1153-2016, 2016. Jones, A. E., Anderson, P. S., Begoin, M., Brough, N.,
Hut-terli, M. A., Marshall, G. J., Richter, A., Roscoe, H. K., and Wolff, E. W.: BrO, blizzards, and drivers of polar tropospheric ozone depletion events, Atmos. Chem. Phys., 9, 4639–4652, https://doi.org/10.5194/acp-9-4639-2009, 2009.
Jones, A. E., Anderson, P. S., Wolff, E. W., Roscoe, H. K., Marshall, G. J., Richter, A., Brough, N., and Colwell, S. R.: Vertical struc-ture of Antarctic tropospheric ozone depletion events: character-istics and broader implications, Atmos. Chem. Phys., 10, 7775– 7794, https://doi.org/10.5194/acp-10-7775-2010, 2010. Kaleschke, L., Richter, A., Burrows, J., Afe, O., Heygster,
G., Notholt, J., Rankin, A. M., Roscoe, H. K., Hollwedel, J., Wagner, T., and Jacobi, H. W.: Frost flowers on sea ice as a source of sea salt and their influence on tropo-spheric halogen chemistry, Geophys. Res. Lett., 31, L16114, https://doi.org/10.1029/2004GL020655, 2004.
Kerkweg, A., Sander, R., Tost, H., and Jöckel, P.: Technical note: Implementation of prescribed (OFFLEM), calculated (ONLEM), and pseudo-emissions (TNUDGE) of chemical species in the Modular Earth Submodel System (MESSy), Atmos. Chem. Phys., 6, 3603–3609, https://doi.org/10.5194/acp-6-3603-2006, 2006a.
Kerkweg, A., Buchholz, J., Ganzeveld, L., Pozzer, A., Tost, H., and Jöckel, P.: Technical Note: An implementation of the dry removal processes DRY DEPosition and SEDImentation in the Modu-lar Earth Submodel System (MESSy), Atmos. Chem. Phys., 6, 4617–4632, https://doi.org/10.5194/acp-6-4617-2006, 2006b.
Lennartz, S. T., Krysztofiak, G., Marandino, C. A., Sinnhuber, B.-M., Tegtmeier, S., Ziska, F., Hossaini, R., Krüger, K., Montzka, S. A., Atlas, E., Oram, D. E., Keber, T., Bönisch, H., and Quack, B.: Modelling marine emissions and atmospheric distributions of halocarbons and dimethyl sulfide: the influence of prescribed water concentration vs. prescribed emissions, Atmos. Chem. Phys., 15, 11753–11772, https://doi.org/10.5194/acp-15-11753-2015, 2015.
Lindberg, S. E., Brooks, S., Lin, C. J., Scott, K. J., Landis, M. S., Stevens, R. K., Goodsite, M., and Richter, A.: Dy-namic oxidation of gaseous mercury in the Arctic tropo-sphere at polar sunrise, Environ. Sci. Tech., 36, 1245–1256, https://doi.org/10.1021/es0111941, 2002.
Oldridge, N. W. and Abbatt, J. P. D.: Formation of Gas-Phase Bromine from Interaction of Ozone with Frozen and Liq-uid NaCl/NaBr Solutions: Quantitative Separation of Surficial Chemistry from Bulk-Phase Reaction, J. Phys. Chem. A, 115, 2590–2598, https://doi.org/10.1021/jp200074u, 2011.
Oltmans, S. J.: Surface Ozone Measurements In
Clean-Air, J. Geophys. Res.-Oc. Atm., 86, 1174–1180,
https://doi.org/10.1029/JC086iC02p01174, 1981.
Pozzer, A., Jöckel, P., Sander, R., Williams, J., Ganzeveld, L., and Lelieveld, J.: Technical Note: The MESSy-submodel AIRSEA calculating the air-sea exchange of chemical species, Atmos. Chem. Phys., 6, 5435–5444, https://doi.org/10.5194/acp-6-5435-2006, 2006.
Pratt, K. A., Custard, K. D., Shepson, P. B., Douglas, T. A., Pöhler, D., General, S., Zielcke, J., Simpson, W. R., Platt, U., Tanner, D. J., Huey, L. G., Carlsen, M., and Stirm, B. H.: Photochemical production of molecular bromine in Arctic surface snowpacks, Nat. Geosci., 6, 351–356, https://doi.org/10.1038/NGEO1779, 2013.
Richter, A., Wittrock, F., Eisinger, M., and Burrows, J. P.: GOME observations of tropospheric BrO in northern hemi-spheric spring and summer 1997, Geophys. Res. Lett., 25, 2683– 2686, https://doi.org/10.1029/98GL52016, 1998.
Richter, A., Wittrock, F., Ladstatter-Weissenmayer, A., and
Burrows, J. P.: GOME measurements of stratospheric
and tropospheric BrO, Adv. Space. Res., 29, 1667–1672, https://doi.org/10.1016/S0273-1177(02)00123-0, 2002. Roeckner, E., Brokopf, R., Esch, M., Giorgetta, M., Hagemann, S.,
Kornblueh, L., Manzini, E., Schlese, U., and Schulzweida, U.: Sensitivity of simulated climate to horizontal and vertical reso-lution in the ECHAM5 atmosphere model, J. Climate, 19, 3771– 3791, https://doi.org/10.1175/JCLI3824.1, 2006.
Saiz-Lopez, A. and von Glasow, R.: Reactive halogen chem-istry in the troposphere, Chem. Soc. Rev., 41, 6448–6472, https://doi.org/10.1039/c2cs35208g, 2012.
Sander, R., Burrows, J., and Kaleschke, L.: Carbonate pre-cipitation in brine – a potential trigger for tropospheric ozone depletion events, Atmos. Chem. Phys., 6, 4653–4658, https://doi.org/10.5194/acp-6-4653-2006, 2006.
Sander, R., Baumgaertner, A., Gromov, S., Harder, H., Jöckel, P., Kerkweg, A., Kubistin, D., Regelin, E., Riede, H., Sandu, A., Taraborrelli, D., Tost, H., and Xie, Z.-Q.: The atmospheric chem-istry box model CAABA/MECCA-3.0, Geosci. Model Dev., 4, 373–380, https://doi.org/10.5194/gmd-4-373-2011, 2011. Simpson, W. R., von Glasow, R., Riedel, K., Anderson, P., Ariya,
Good-site, M. E., Heard, D., Hutterli, M., Jacobi, H.-W., Kaleschke, L., Neff, B., Plane, J., Platt, U., Richter, A., Roscoe, H., Sander, R., Shepson, P., Sodeau, J., Steffen, A., Wagner, T., and Wolff, E.: Halogens and their role in polar boundary-layer ozone depletion, Atmos. Chem. Phys., 7, 4375–4418, https://doi.org/10.5194/acp-7-4375-2007, 2007.
Sinnhuber, B.-M. and Meul, S.: Simulating the impact of emis-sions of brominated very short lived substances on past strato-spheric ozone trends, Geophys. Res. Lett., 42, 2449–2456, https://doi.org/10.1002/2014GL062975, 2015.
Stephens, C. R., Shepson, P. B., Steffen, A., Bottenheim, J. W., Liao, J., Huey, L. G., Apel, E., Weinheimer, A., Hall, S. R., Cantrell, C., Sive, B. C., Knapp, D. J., Montzka, D. D., and Hornbrook, R. S.: The relative importance of chlorine and bromine radicals in the oxidation of atmospheric mercury at Barrow, Alaska, J. Geophys. Res.-Atmos., 117, D00R11, https://doi.org/10.1029/2011JD016649, 2012.
Strong, C., Fuentes, J. D., Davis, R. E., and Bottenheim, J. W.: Ther-modynamic attributes of Arctic boundary layer ozone depletion, Atmos. Environ., 36, 2641–2652, https://doi.org/10.1016/S1352-2310(02)00114-0, 2002.
Theys, N., Van Roozendael, M., Hendrick, F., Yang, X., De Smedt, I., Richter, A., Begoin, M., Errera, Q., Johnston, P. V., Kreher, K., and De Mazière, M.: Global observations of tropospheric BrO columns using GOME-2 satellite data, Atmos. Chem. Phys., 11, 1791–1811, https://doi.org/10.5194/acp-11-1791-2011, 2011. Thomas, J. L., Stutz, J., Lefer, B., Huey, L. G., Toyota, K., Dibb, J.
E., and von Glasow, R.: Modeling chemistry in and above snow at Summit, Greenland – Part 1: Model description and results, At-mos. Chem. Phys., 11, 4899–4914, https://doi.org/10.5194/acp-11-4899-2011, 2011.
Toyota, K., McConnell, J. C., Lupu, A., Neary, L., McLinden, C. A., Richter, A., Kwok, R., Semeniuk, K., Kaminski, J. W., Gong, S.-L., Jarosz, J., Chipperfield, M. P., and Sioris, C. E.: Analy-sis of reactive bromine production and ozone depletion in the Arctic boundary layer using 3-D simulations with GEM-AQ: in-ference from synoptic-scale patterns, Atmos. Chem. Phys., 11, 3949–3979, https://doi.org/10.5194/acp-11-3949-2011, 2011.
Toyota, K., Dastoor, A. P., and Ryzhkov, A.: Air-snowpack ex-change of bromine, ozone and mercury in the springtime Arc-tic simulated by the 1-D model PHANTAS – Part 2: Mer-cury and its speciation, Atmos. Chem. Phys., 14, 4135–4167, https://doi.org/10.5194/acp-14-4135-2014, 2014a.
Toyota, K., McConnell, J. C., Staebler, R. M., and Dastoor, A. P.: Air-snowpack exchange of bromine, ozone and mercury in the springtime Arctic simulated by the 1-D model PHANTAS – Part 1: In-snow bromine activation and its impact on ozone, At-mos. Chem. Phys., 14, 4101–4133, https://doi.org/10.5194/acp-14-4101-2014, 2014b.
US National Snow & Ice Data Center (NSIDC): EASE-Grid Sea Ice Age, availalbe at: http://nsidc.org/soac/sea-ice-age-year. html\T1\textbackslash#seaiceagesequential, 2017.
Wagner, T. and Platt, U.: Satellite mapping of enhanced BrO concentrations in the troposphere, Nature, 395, 486–490, https://doi.org/10.1038/26723, 1998.
Wesely, M. L.: Parameterization Of Surface Resistances To Gaseous Dry Deposition In Regional-Scale Numerical-Models, Atmos. Environ., 23, 1293–1304, https://doi.org/10.1016/0004-6981(89)90153-4, 1989.
Yang, X., Pyle, J. A., Cox, R. A., Theys, N., and Van Roozen-dael, M.: Snow-sourced bromine and its implications for po-lar tropospheric ozone, Atmos. Chem. Phys., 10, 7763–7773, https://doi.org/10.5194/acp-10-7763-2010, 2010.