R E S E A R C H
Open Access
Smoking induces coordinated DNA
methylation and gene expression changes
in adipose tissue with consequences for
metabolic health
Pei-Chien Tsai
1,2,3*, Craig A. Glastonbury
1,4, Melissa N. Eliot
5, Sailalitha Bollepalli
6, Idil Yet
1,7,
Juan E. Castillo-Fernandez
1, Elena Carnero-Montoro
1,8, Thomas Hardiman
1,9, Tiphaine C. Martin
1,10,11,
Alice Vickers
1,12, Massimo Mangino
1,13, Kirsten Ward
1, Kirsi H. Pietiläinen
14,15, Panos Deloukas
16,17, Tim D. Spector
1,
Ana Viñuela
1,18,19,20, Eric B. Loucks
5, Miina Ollikainen
6, Karl T. Kelsey
5,21, Kerrin S. Small
1and Jordana T. Bell
1*Abstract
Background:Tobacco smoking is a risk factor for multiple diseases, including cardiovascular disease and diabetes. Many smoking-associated signals have been detected in the blood methylome, but the extent to which these changes are widespread to metabolically relevant tissues, and impact gene expression or metabolic health, remains unclear.
Methods: We investigated smoking-associated DNA methylation and gene expression variation in adipose tissue biopsies from 542 healthy female twins. Replication, tissue specificity, and longitudinal stability of the smoking-associated effects were explored in additional adipose, blood, skin, and lung samples. We
characterized the impact of adipose tissue smoking methylation and expression signals on metabolic disease risk phenotypes, including visceral fat.
Results: We identified 42 smoking-methylation and 42 smoking-expression signals, where five genes (AHRR, CYP1A1, CYP1B1, CYTL1, F2RL3) were both hypo-methylated and upregulated in current smokers. CYP1A1gene expression achieved 95% prediction performance of current smoking status. We validated and replicated a proportion of the signals in additional primary tissue samples, identifying tissue-shared effects. Smoking leaves systemic imprints on DNA methylation after smoking cessation, with stronger but shorter-lived effects on gene expression. Metabolic disease risk traits such as visceral fat and android-to-gynoid ratio showed
association with methylation at smoking markers with functional impacts on expression, such as CYP1A1, and at tissue-shared smoking signals, such as NOTCH1. At smoking-signals, BHLHE40 and AHRR DNA methylation and gene expression levels in current smokers were predictive of future gain in visceral fat upon smoking cessation.
Conclusions: Our results provide the first comprehensive characterization of coordinated DNA methylation and gene expression markers of smoking in adipose tissue. The findings relate to human metabolic health and give insights into understanding the widespread health consequence of smoking outside of the lung.
Keywords: Smoking, DNA methylation, Gene expression, RNA-sequencing, Adipose tissue
* Correspondence:[email protected];[email protected] 1Department of Twin Research and Genetic Epidemiology, King’s College
London, London SE1 7EH, UK
Full list of author information is available at the end of the article
Background
Tobacco smoking is a major environmental risk factor that predisposes an individual to chronic disease, cancer, and premature death [1, 2]. Smoking directly affects ex-posed regions of the lung [3], causes damage in organs throughout the body, and results in DNA mutations that have been linked to cancer [4]. The risk effects of smok-ing extend to multiple diseases, includsmok-ing cardiovascular and metabolic disease. Smoking cessation has also been linked to metabolic health complications and is associated with an increase in weight gain and in metabolic disease risk factors such as accumulation of visceral fat [5].
Persistent smoking has lasting effects on DNA methy-lation, and many epigenome-wide association studies (EWAS) have identified and replicated smoking-related differentially methylated signals across populations with the majority found in whole blood samples [6–20], buccal cells [21], and lung tissue [22,23]. Most smoking methyla-tion signals show lower levels of DNA methylamethyla-tion in current smokers compared to non-smokers, and variable dynamics upon cessation. Although some alterations per-sist over decades, smoking cessation can result in methyla-tion levels reverting to those observed in non-smokers [13, 16,18,24]. However, most ex-smokers exhibit inter-mediate methylation levels between non-smokers and current smokers [13,16,18,24]. Methylation levels correl-ate with the cumulative dose of smoking and are associ-ated with time since smoking cessation [13,16,24,25].
Smoking can also affect gene expression, as reported in the human airway epithelium [26,27], lung tissue [28], al-veolar macrophages [29], and lung cancer tissue [30].
However, few studies have examined DNA methylation and gene expression changes concurrently, and these studies were either conducted with low coverage genome assays (such as pyrosequencing [30] and HELP assay [8]) or tar-geted single genes of interest in small sample sizes [8,30].
Here, we performed the first combined genome-wide analysis of smoking-related methylation and gene expres-sion changes across tissues, focusing on adipose tissue. Ex-ploring the molecular changes induced by smoking in a metabolically relevant tissue such as adipose tissue is of value to metabolic health research, because smoking is a risk factor for metabolic complications and smoking cessa-tion has been linked to the accumulacessa-tion of visceral fat. Here, we identify multiple genes that exhibit both methyla-tion and expression changes within adipose tissue and across tissues, showing that smoking leaves a systemic im-print on DNA methylation and expression variation in the human body. Our data suggest that smoking leaves a stron-ger impact on gene expression, while DNA methylation smoking changes are more stable over time. By linking our findings to key human phenotypes related to metabolic health, we identify signals that could add understanding to some of the wide-ranging risk effects of smoking on meta-bolic diseases.
Results
Integrated DNA methylation and gene expression analyses in adipose tissue
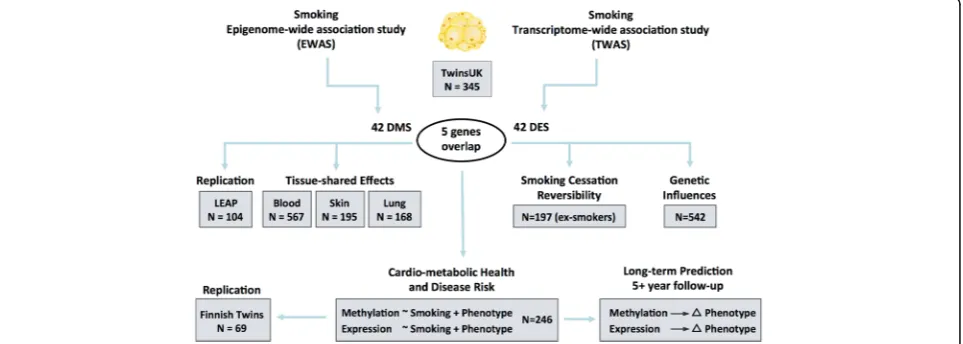
Our study design is summarized in Fig. 1. Both DNA methylation and gene expression profiles were explored in adipose tissue biopsies from 542 subjects, comprising 54
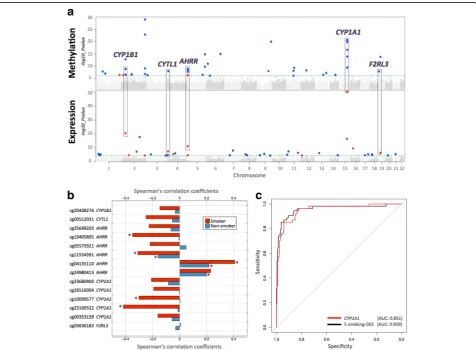
current smokers, 197 ex-smokers, and 291 non-smokers. The 197 ex-smokers in our sample were excluded from analyses investigating methylation differences between current smokers and non-smokers, but were the focus of subsequent smoking cessation analyses. DNA methylation levels at 467,889 CpG sites from the Illumina Infinium HumanMethylation450 BeadChip were first compared be-tween current smokers (mean BMI = 26.11 ± 4.66, mean age = 54.17 ± 8.31) and non-smokers (mean BMI = 26.95 ± 4.83, mean age = 59.18 ± 9.58). At a false discovery rate of 1% (P< 8.37 × 10⁻⁷), there were 42 smoking differentially methylated signals (smoking-DMS) or CpG sites, and these were located in 29 unique genomic regions compris-ing of 28 genes and 1 intergenic region (Fig. 2a). Smoking-DMS are located predominantly in the gene
body (47.6%), extended promoter region (38.1%), 3′UTR (4.7%), and intergenic region (9.5%), representing an en-richment of signals in the gene body relative to array com-position. Using Roadmap annotations (adipose nuclei) [31], we observed that 16 smoking-DMS (38%) were lo-cated in enhancers and 9 (21%) were in or near active transcription start sites (TSS). Of these 25 enhancer or TSS signals, 9 were flanking bivalent enhancers (n= 3) or TSS (n= 6). As expected, methylation levels of current smokers were lower than those in non-smokers in the ma-jority (90.5%) of the 42 signals (Table1).
To assess the impact of potential confounders on these results, we performed two follow-up analyses. First, we considered the impact of adipose tissue cell-type compos-ition heterogeneity by also analyzing these data within the
Table 1Smoking differentially methylated sites in adipose tissue (42 smoking-DMS)
IlmnID CHR Location Gene name Non-smoker Current smoker Coef. S.E. Pvalue cis-meQTL S*
β(mean ± SD) β(mean ± SD)
cg05951221 2 233284402 2q37.1 0.255 ± 0.054 0.172 ± 0.040 −1.380 0.108 1.28 × 10⁻²⁹ rs2853386; 3.87 × 10⁻⁸
cg21566642 2 233284661 2q37.1 0.225 ± 0.040 0.167 ± 0.029 −1.347 0.122 1.87 × 10⁻²³
cg23680900 15 75017924 CYP1A1 0.202 ± 0.036 0.155 ± 0.030 −1.198 0.118 2.96 × 10⁻²¹ O
cg14120703 9 139416102 NOTCH1 0.748 ± 0.045 0.693 ± 0.044 −1.172 0.118 1.44 × 10⁻²⁰
cg26516004 15 75019376 CYP1A1 0.696 ± 0.047 0.628 ± 0.058 −1.258 0.126 1.95 × 10⁻²⁰ Y
cg10009577 15 75018150 CYP1A1 0.068 ± 0.021 0.050 ± 0.016 −0.810 0.090 2.48 × 10⁻¹⁷ Y
cg01985595 6 136479501 PDE7B 0.961 ± 0.025 0.936 ± 0.032 −1.015 0.119 1.09 × 10⁻¹⁵ Y
cg22418620 5 172072885 NEURL1B 0.832 ± 0.049 0.765 ± 0.057 −1.077 0.127 1.63 × 10⁻¹⁵ rs57285944; 2.15 × 10⁻⁸ Y
cg23160522 15 75015787 CYP1A1 0.622 ± 0.033 0.583 ± 0.044 −0.991 0.122 1.33 × 10⁻¹⁴ Y
cg03636183 19 17000585 F2RL3 0.506 ± 0.040 0.473 ± 0.038 −0.826 0.103 1.80 × 10⁻¹⁴
cg07992500 2 37896583 CDC42EP3 0.771 ± 0.051 0.719 ± 0.052 −1.087 0.141 1.88 × 10⁻¹³ rs7595854; 1.32 × 10⁻⁷
cg12531611 6 11212619 NEDD9 0.909 ± 0.021 0.892 ± 0.024 −0.855 0.120 1.12 × 10⁻¹¹ O
cg03646542 5 172076155 NEURL1B 0.689 ± 0.037 0.654 ± 0.035 −0.880 0.133 1.87 × 10⁻¹⁰ rs7715699; 1.72 × 10⁻¹⁰ Y
cg00353139 15 75017914 CYP1A1 0.034 ± 0.013 0.022 ± 0.010 −0.787 0.121 4.47 × 10⁻¹⁰ rs11072498; 2.47 × 10⁻⁶ Y
cg21124714 11 72983097 P2RY6 0.736 ± 0.037 0.707 ± 0.033 −0.874 0.136 5.15 × 10⁻¹⁰ Y
cg01940273 2 233284934 2q37.1 0.334 ± 0.045 0.302 ± 0.044 −0.679 0.105 8.93 × 10⁻¹⁰
cg25648203 5 395444 AHRR 0.503 ± 0.044 0.459 ± 0.040 −0.825 0.132 1.30 × 10⁻⁹
cg20408276 2 38300586 CYP1B1 0.548 ± 0.060 0.499 ± 0.059 −0.781 0.125 1.61 × 10⁻⁹ O
cg20131897 12 52305332 ACVRL1 0.694 ± 0.034 0.673 ± 0.028 −0.693 0.116 5.61 × 10⁻⁹ rs1700159; 2.97 × 10⁻⁷ Y
cg21611682 11 68138269 LRP5 0.370 ± 0.041 0.336 ± 0.035 −0.734 0.124 8.10 × 10⁻⁹
cg19405895 5 407315 AHRR 0.955 ± 0.014 0.942 ± 0.024 −0.768 0.128 8.38 × 10⁻⁹ Y
cg05575921 5 373378 AHRR 0.713 ± 0.044 0.682 ± 0.039 −0.611 0.104 1.07 × 10⁻⁸ rs7731963; 3.97 × 10⁻⁸
cg13531977 9 112013420 EPB41L4B 0.807 ± 0.035 0.833 ± 0.029 0.831 0.140 1.14 × 10⁻⁸ Y
cg00512031 4 5021976 CYTL1 0.880 ± 0.026 0.855 ± 0.028 −0.760 0.129 1.23 × 10⁻⁸ chr4:5022470;1.42 × 10⁻⁹ Y
cg25189904 1 68299493 GNG12 0.100 ± 0.043 0.064 ± 0.030 −0.771 0.131 1.48 × 10⁻⁸
cg00378510 19 2291020 LINGO3 0.217 ± 0.059 0.181 ± 0.053 −0.781 0.134 1.53 × 10⁻⁸ rs12609156; 6.83 × 10⁻¹⁸
cg11554391 5 321320 AHRR 0.065 ± 0.019 0.048 ± 0.014 −0.720 0.125 2.00 × 10⁻⁸
cg01802380 13 107865407 FAM155A 0.845 ± 0.030 0.825 ± 0.037 −0.737 0.133 5.69 × 10⁻⁸ rs9520326; 1.52 × 10⁻¹² Y
cg14179389 1 92947961 GFI1 0.083 ± 0.030 0.063 ± 0.028 −0.665 0.122 1.07 × 10⁻⁷
cg06644428 2 233284112 2q37.1 0.036 ± 0.018 0.024 ± 0.010 −0.704 0.130 1.61 × 10⁻⁷
cg12081267 2 98486185 TMEM131 0.878 ± 0.038 0.858 ± 0.035 −0.650 0.122 1.97 × 10⁻⁷ Y
cg02162897 2 38300537 CYP1B1 0.567 ± 0.060 0.520 ± 0.061 −0.674 0.127 2.89 × 10⁻⁷ O
cg11555067 2 99081350 INPP4A 0.725 ± 0.047 0.700 ± 0.046 −0.717 0.138 3.18 × 10⁻⁷ rs3754893; 2.27 × 10⁻⁷
cg04134818 5 148998446 FLJ41603 0.153 ± 0.026 0.133 ± 0.025 −0.690 0.132 3.26 × 10⁻⁷ rs11950259; 7.83 × 10⁻⁶ Y
cg03976650 13 77456505 KCTD12 0.667 ± 0.061 0.612 ± 0.067 −0.754 0.143 3.56 × 10⁻⁷ Y
cg22851561 14 74214183 C14orf43 0.422 ± 0.041 0.390 ± 0.040 −0.634 0.121 3.92 × 10⁻⁷
cg10376100 1 236017278 LYST;MIR1537 0.923 ± 0.036 0.947 ± 0.030 0.615 0.117 4.03 × 10⁻⁷ Y
cg04063216 2 14772482 FAM84A 0.071 ± 0.016 0.075 ± 0.019 0.441 0.085 4.39 × 10⁻⁷ Y
cg16320419 3 5025570 BHLHE40 0.352 ± 0.052 0.315 ± 0.048 −0.699 0.135 4.88 × 10⁻⁷
cg04135110 5 346695 AHRR 0.339 ± 0.061 0.384 ± 0.065 0.699 0.137 5.34 × 10⁻⁷ rs2672748; 3.42 × 10⁻¹⁷
cg20109054 6 31804109 C6orf48;SNORD52 0.091 ± 0.026 0.072 ± 0.023 −0.659 0.130 7.85 × 10⁻⁷ rs3828922; 2.74 × 10⁻⁵
cg16721845 11 68518800 MTL5 0.018 ± 0.008 0.014 ± 0.007 −0.530 0.106 8.37 × 10⁻⁷ Y IlmnID, Illumina probe ID;CHR, chromosome;Location, location of the CpG site (bp);β(mean ± SD), mean and standard deviation of the Illumina beta
methylation levels in the non-smoker and current smoker group;Coef., regression coefficients from the linear mixed effect model, positive values denote hypermethylation in current smokers and negative values denote hypo-methylation in current smokers;cis-meQTL, top significantcis-meQTL for the CpG site;
S*, adipose tissue-specific effect
reference-free EWAS framework [32]. We observed that the 42 smoking-DMS remained significant at false discov-ery rate (FDR) of 1%, suggesting that cell composition within adipose tissue did not have a major impact on our findings (Additional file 1: Figure S1). Second, habitual smoking is strongly associated with alcohol consumption [33], and in our data, current smokers and ex-smokers have a higher alcohol intake compared to non-smokers (average alcohol intake = 5.96 (non-smokers), 10.03 (ex-smokers), and 11.67 (current smokers) grams per day, P= 1.06 × 10⁻⁵). Although our smoking analyses take into account alcohol consumption as a covariate, it is possible that the smoking-DMS still in part capture alcohol consumption. To test for the co-occurrence of differentially methylated signals for smoking and alco-hol consumption, we performed an alcoalco-hol EWAS adjusting for smoking to compare the results with the 42 smoking-DMS. We observed no significant associ-ation between alcohol consumption and methylassoci-ation at genome-wide significance after adjusting for smoking in adipose tissue, and only 7 smoking-DMS in AHRR (cg01802380, cg04134818, cg19405895), CYP1B1 (cg19 405895, cg20408276),FAM84A(cg04063216), andC6or f48(cg20109054) surpassed nominal significance (Pvalues between 0.05 and 0.005).
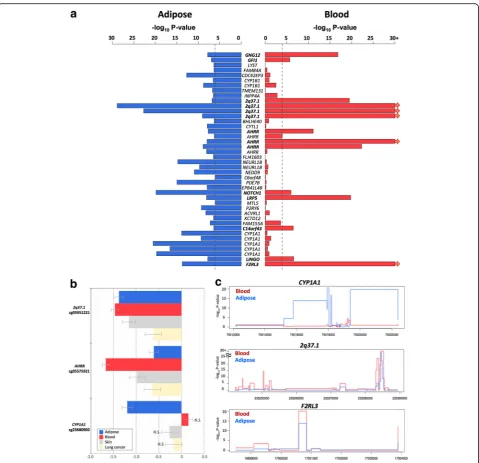
We next compared RNA-sequencing profiles from the same tissue biopsy between current smokers and non-smokers at the gene-based level using RPKM values across 17,399 genes. At an FDR of 1% (P< 2.86 × 10⁻⁵), there were 42 differentially expressed signals (smo-king-DES) or genes (Fig. 2a), and 14 of these were up-regulated in current smokers (Table 2). The strongest smoking-related expression signal was in the CYP1A1 gene—a lung cancer susceptibility gene, which was also one of the differentially methylated signals. Gene expres-sion levels in CYP1A1 were higher in current smokers compared to non-smokers (Figs.2aand3).
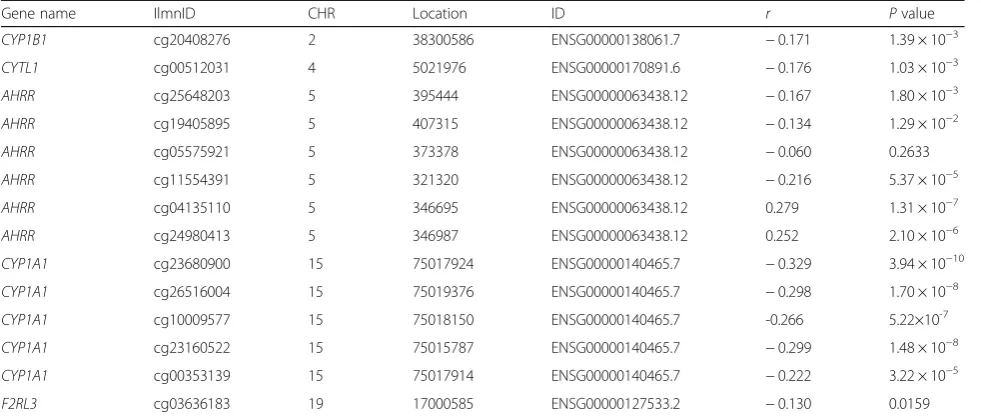
Comparison of the FDR 1% genome-wide significant smoking-DMS and smoking-DES showed overlapping signals at five genes comprising 14 CpG sites, and these included AHRR, CYP1A1, CYP1B1, CYTL1, and F2RL3 (Fig. 2a). CpG sites within AHRR, CYP1B1, and F2RL3 were located in the gene body, whereas CpG sites in or nearCYP1A1andCYTL1were located 200 kb to 1500 kb away from the transcription start sites. All five genes were upregulated in current smokers, and in the majority of smoking-DMS (93%), current smokers showed lower methylation levels compared to non-smokers. These pre-dominantly negative correlations between methylation and expression at these five genes suggested regulatory effects (Table3, Fig.2b). The methylation-expression correlations at some of these CpG sites were only observed in current smokers, and overall correlations were stronger in smokers compared to non-smokers.
Prediction of smoking status based on DNA methylation and gene expression
To assess the impact of smoking on DNA methylation and gene expression within the same analysis framework and at a comparable scale, we used methylation and ex-pression changes at these five overlapping genes (14 CpG sites) to predict a subject’s smoking status using a lo-gistic regression model. We split the overall dataset into training and validation sets of equal size and report here the average area under curve (AUC) values from 1000 val-idation sets. The combination of 14 smoking-DMS levels and 5 smoking-DES levels resulted in reasonable discrim-ination of smoking status (AUC: 0.865). Compared to the prediction results based on 14 smoking-DMS levels alone (AUC: 0.888), smoking-DES levels are better predictors (all five genes, AUC: 0.951). This suggests that smoking leaves a greater impact on gene expression levels, com-pared to DNA methylation levels at these overlapping genes. A similar high predictive value can be achieved by using gene expression levels at just a single gene,CYP1A1 (AUC: 0.952) (Fig.2c).CYP1A1was the peak smoking dif-ferentially expressed gene, with difdif-ferentially methylated signals in the promoter, and a negative correlation be-tween methylation and expression (Fig.3b).
Adipose-specific and tissue-shared smoking signals
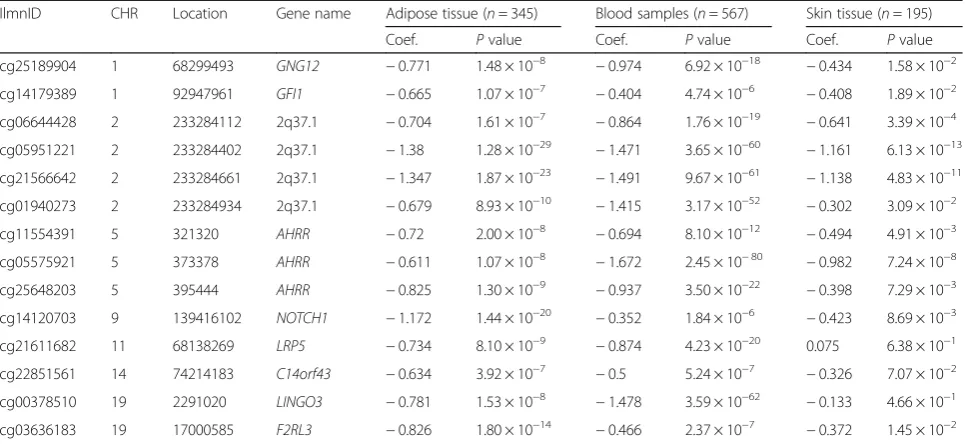
To test if the effects of smoking are shared across tissues, we first compared our adipose findings to results from whole blood samples. To this end, we tested for association between smoking and whole blood genome-wide DNA methylation (in 569 individuals) and gene expression pro-files (in 237 individuals), comparing current smokers with non-smokers. In blood, genome-wide significant results at FDR 1% for smoking DMS and DES overlapped at four genes (Additional file 2: Table S1). Altogether, comparison of FDR 1% significant smoking-DMS results across the adi-pose and whole blood datasets identified 14 CpG sites that were genome-wide differentially methylated in both blood and adipose tissue (Fig.4a). The 14 tissue-shared CpG sites fell in eight genes, including GNG12, GFI1, AHRR,NOTCH1,LRP5,C14orf43,LINGO3,F2RL3, and in the 2q37.1 intergenic region (Table 4). All of these sites were previously reported as smoking differentially methylated sites in blood in previous studies [6–19] and include AHRR—the most robustly replicated smoking-methylation signal (Fig.5a). DNA methylation changes in two genes (AHRR and F2RL3) that exhibit both expression and methylation smoking-associated effects in adipose tissue were also present in the blood (Figs.4cand5b).
Table 2Smoking differentially expressed genes in adipose tissue (42 smoking-DES)
ID CHR Name Coef. S.E. Pvalue ciseQTLs
ENSG00000140465.7 15 CYP1A1 1.899 0.103 5.37 × 10−51 rs35213055; 1.53 × 10⁻⁶
ENSG00000138061.7 2 CYP1B1 1.373 0.131 2.83 × 10⁻²¹
ENSG00000144331.14 2 ZNF385B −1.257 0.134 1.53 × 10⁻¹⁸ rs9288034; 8.33 × 10⁻⁵
ENSG00000179151.6 15 EDC3 1.167 0.129 3.10 × 10⁻¹⁷
ENSG00000063438.12 5 AHRR 1.059 0.149 6.03 × 10⁻¹²
ENSG00000175267.8 16 VWA3A 0.932 0.139 2.18 × 10⁻¹⁰
ENSG00000170381.7 7 SEMA3E −0.821 0.137 8.35 × 10⁻⁹ chr7:83264879;1.22 × 10⁻¹⁰
ENSG00000170891.6 4 CYTL1 0.807 0.142 2.82 × 10⁻⁸
ENSG00000187486.5 11 KCNJ11 −0.859 0.148 3.27 × 10⁻⁸
ENSG00000168280.11 2 KIF5C −0.813 0.145 4.74 × 10⁻⁸
ENSG00000006016.5 19 CRLF1 0.769 0.146 2.53 × 10⁻⁷ chr19:18717389; 2.63 × 10⁻⁶
ENSG00000127533.2 19 F2RL3 0.782 0.147 2.89 × 10⁻⁷
ENSG00000149294.11 11 NCAM1 −0.715 0.135 3.03 × 10⁻⁷ rs17510563; 2.01 × 10⁻⁷
ENSG00000120693.9 13 SMAD9 −0.733 0.140 4.76 × 10⁻⁷
ENSG00000169116.7 4 PARM1 −0.686 0.133 6.76 × 10⁻⁷
ENSG00000154330.6 9 PGM5 −0.716 0.147 1.72 × 10⁻⁶
ENSG00000162430.12 1 SEPN1 −0.663 0.137 1.82 × 10⁻⁶
ENSG00000154721.9 21 JAM2 −0.667 0.136 2.23 × 10⁻⁶
ENSG00000177303.4 17 CASKIN2 −0.669 0.140 2.90 × 10⁻⁶
ENSG00000157404.10 4 KIT 0.708 0.150 3.31 × 10⁻⁶
ENSG00000161544.4 17 CYGB 0.621 0.131 3.42 × 10⁻⁶
ENSG00000154065.9 18 ANKRD29 −0.684 0.144 3.49 × 10⁻⁶
ENSG00000176907.3 8 C8orf4 −0.714 0.151 3.56 × 10⁻⁶
ENSG00000168032.4 3 ENTPD3 −0.674 0.140 3.86 × 10⁻⁶ rs34158576; 7.60 × 10⁻⁶
ENSG00000162367.6 1 TAL1 −0.665 0.142 4.17 × 10⁻⁶
ENSG00000180785.8 11 OR51E1 −0.655 0.142 6.82 × 10⁻⁶ rs11033126; 3.78 × 10⁻¹⁰
ENSG00000164010.9 1 ERMAP −0.690 0.154 9.50 × 10⁻⁶
ENSG00000068078.12 4 FGFR3 −0.643 0.143 9.68 × 10⁻⁶ rs744658; 9.68 × 10⁻⁸
ENSG00000246223.4 14 C14orf64 −0.633 0.142 1.44 × 10⁻⁵ rs75700090; 2.00 × 10⁻⁵
ENSG00000145506.9 5 NKD2 0.616 0.140 1.46 × 10⁻⁵
ENSG00000161649.7 17 CD300LG −0.648 0.147 1.48 × 10⁻⁵
ENSG00000163873.5 1 GRIK3 −0.643 0.146 1.50 × 10⁻⁵
ENSG00000053747.9 18 LAMA3 −0.652 0.148 1.57 × 10⁻⁵
ENSG00000183733.6 2 FIGLA 0.406 0.093 1.57 × 10⁻⁵
ENSG00000164736.5 8 SOX17 −0.629 0.144 1.64 × 10⁻⁵
ENSG00000106078.12 7 COBL −0.680 0.155 1.65 × 10⁻⁵
ENSG00000120156.14 9 TEK −0.610 0.140 1.67 × 10⁻⁵
ENSG00000178726.5 20 THBD −0.612 0.141 2.00 × 10⁻⁵
ENSG00000177675.4 12 CD163L1 0.635 0.148 2.40 × 10⁻⁵
ENSG00000136828.13 9 RALPGS1 −0.646 0.151 2.60 × 10⁻⁵
ENSG00000135914.4 2 HTR2B 0.613 0.144 2.82 × 10⁻⁵
ENSG00000090530.5 3 LEPREL1 −0.617 0.145 2.86 × 10⁻⁵ rs6768989; 1.10 × 10⁻⁹
samples from subjects affected with lung cancer. Four of the 14 CpG sites validated in the skin in the intergenic region 2q37.1 (cg05951221, cg06644428, and cg2156 6642) and inAHRR(cg05575921). Furthermore, the ma-jority (n= 13) of the 14 tissue-shared CpG sites had lower methylation levels in current smokers compared to non-smokers in both lung and skin methylation data-sets, indicating a consistent direction of effect, which was not nominally significant (Table4, Additional file2: Table S2). In lung tissue from subjects affected with lung cancer, we validated 3 of the 14 CpG sites in the intergenic region 2q37.1 (cg21566642 and cg05951221) and in the AHRR gene (cg05575921) at a Bonferroni-corrected P value of 3.57 × 10⁻³ (Additional file 2: Table S2). The smoking-DMS effects observed across tissues were similar for CpG sites in the 2q37.1 region, while the smoking ef-fect was much greater in blood at cg05575921 in AHRR (see Table4, Fig.4b).
In contrast to the methylation results, gene expression signals showed minimal evidence for tissue-shared im-pacts. Comparing our FDR 1% genome-wide smoking-DES across adipose and blood datasets showed that only AHRR was significantly upregulated in current smokers across both tissues (Fig. 5c). AHRR was the only signal that showed both differential methylation and expression changes across all of the datasets that we explored in this study, including blood, adipose, skin, and lung tissue.
A proportion of our smoking-DMS and most of our smoking-DES results appear to be adipose-specific. However, the sample size of the datasets used to explore tissue specificity in gene expression was much lower compared to that used for methylation; therefore, power to detect tissue-shared effects differs across the data types. Furthermore, we are limited by access to available multi-tissue datasets for follow-up, and further investiga-tion of published findings reveals that some of our smoking adipose-specific signals have previously been detected in other tissues [20] For example, one of our peak results at CYP1A1 showed methylation changes only in adipose tissue and not in the blood (Fig.4), but has previously been reported as a smoking-methylation signal in blood [20], lung tissue [30, 35], cord blood [36], and placenta [37, 38]. Unlike the persistent tissue-shared effects identified in other smoking-DMS such as signals in AHRR and 2q37.1, we found that current smokers have lower CYP1A1 methylation levels in adipose, skin, and lung tissue, but not in blood [20], placenta, and cord blood samples [36], overall suggesting that smoking may have contrasting effects, resulting in hyper- or hypo-methylation in dif-ferent tissues (Fig. 4b). A similar contrast in direction of smoking methylation effects is observed at smoking-DMS inNEDD9andCYP1B1across adipose tissue and in blood (Table1).
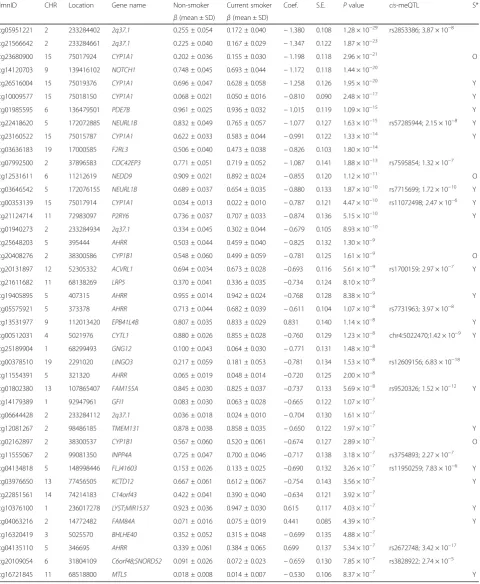
Fig. 3Smoking-associated DNA methylation and gene expression patterns atCYP1A1.acoMET plot [90] describing the genomic region of epigenome-wide association between smoking andCYP1A1methylation (top panel), along with functional annotation of the region (middle panel), and pattern of co-methylation at the 34 CpG sites ofCYP1A1(bottom panel).bDNA methylation and gene expression changes with respect to smoking cessation. Methylation (at cg23680900) and gene expression levels are shown for five smoking status categories: current smokers (red); subjects who quit within 1 year, subjects who quit between 1 and 5 years, and subjects who quit over 5 years at the time of methylation sampling (gray); and non-smokers (blue).X-axis labels include the proportion of subjects who reverted in each smoking quit year category.cCYP1A1
Replication of adipose smoking methylation signals
We pursued replication of the adipose tissue smoking-DMS in an independent dataset of 104 participants from the LEAP cohort, within the New England Family Study (mean BMI 30.9 ± 7.03, mean age 47 ± 1.7, 48% male), described in detail elsewhere [39]. These individuals were not affected with common diseases and had avail-able adipose biopsy methylation profiles for 46 current smokers and 58 non-smokers. We found that the smoking-methylation direction of association was con-sistent at all 42 adipose smoking-DMS (Additional file2: Table S3), and 25 of these also surpassed nominal sig-nificance in the replication dataset (P= 0.05). At a more stringent threshold, the replication signal was signifi-cant at 13 sites, surpassing Bonferroni-adjustedP value for the replication analysis (P= 1.19 × 10⁻³).
Signatures of smoking cessation
We next assessed the effect of smoking cessation on the observed adipose DNA methylation and gene expression signals in ex-smokers from the discovery cohort. We considered reversal of smoking methylation or expres-sion signals, that is, the longitudinal change in methyla-tion to reach levels observed in non-smokers. We quantified the number of subjects who reverted to 25% of the change in methylation towards non-smokers, and estimated the proportion of subjects who reverted over time (in smoking-quit years), using the same approach in gene expression (see the“Methods”section).
We explored reversal patterns in adipose tissue at both the 42 smoking-DMS (Additional file 1: Figure S2) and 42 smoking-DES (Additional file 1: Figure S3) and fo-cused on the five differentially methylated and expressed
genes (14 CpG sites), where the average number of smoking-quit years was 24.8 (± 13.21) years among 197 ex-smokers. Overall, a rapid rate of reversal was ob-served in the first 10 years after smoking cessation, after which only subtle changes were detected in both methy-lation and gene expression. In the expression adipose data, ex-smokers showed a > 50% reversal rate 1 year after smoking cessation and reached > 85% reversal after 10 years (Additional file 1: Figure S3). In comparison, slower reversal was observed in the methylation dataset (Additional file1: Figure S2). Among the 14 CpG sites, only three (two at AHRRand one atCYP1A1) showed a 50% reversal rate 1 year after cessation, while the remaining signals showed between 17 and 33% reversal (Figs. 3b and 5c, Additional file 1: Figure S3). Even after > 40 years of smoking cessation, a proportion of smoking-DMS (n= 12; 29%) showed less than 40% re-versal (Additional file 1: Figure S3). This suggests that smoking leaves a longer lasting influence on DNA methylation levels than on gene expression levels after smoking cessation.
Controlling for genetic variation
Previous studies have shown heritable impacts on smok-ing behavior and nicotine addiction [40–43]. We ex-plored the impact of genetic variation on the identified smoking methylation signals. Of the 42 smoking-DMS, 14 CpG sites had genome-wide significant meQTLs in cis in adipose tissue (Table 1). Of the 14 tissue-shared smoking-DMS, two signals in 2q37.1 and one in LINGO3had meQTLs incisin adipose tissue, and three signals in AHRR and one in F2RL3 had meQTLs in cis in blood samples.
Table 3Correlation between DNA methylation and gene expression
Gene name IlmnID CHR Location ID r Pvalue
CYP1B1 cg20408276 2 38300586 ENSG00000138061.7 −0.171 1.39 × 10⁻³
CYTL1 cg00512031 4 5021976 ENSG00000170891.6 −0.176 1.03 × 10⁻³
AHRR cg25648203 5 395444 ENSG00000063438.12 −0.167 1.80 × 10⁻³
AHRR cg19405895 5 407315 ENSG00000063438.12 −0.134 1.29 × 10⁻²
AHRR cg05575921 5 373378 ENSG00000063438.12 −0.060 0.2633
AHRR cg11554391 5 321320 ENSG00000063438.12 −0.216 5.37 × 10⁻⁵
AHRR cg04135110 5 346695 ENSG00000063438.12 0.279 1.31 × 10⁻⁷
AHRR cg24980413 5 346987 ENSG00000063438.12 0.252 2.10 × 10⁻⁶
CYP1A1 cg23680900 15 75017924 ENSG00000140465.7 −0.329 3.94 × 10⁻¹⁰
CYP1A1 cg26516004 15 75019376 ENSG00000140465.7 −0.298 1.70 × 10⁻⁸
CYP1A1 cg10009577 15 75018150 ENSG00000140465.7 -0.266 5.22×10⁻⁷
CYP1A1 cg23160522 15 75015787 ENSG00000140465.7 −0.299 1.48 × 10⁻⁸
CYP1A1 cg00353139 15 75017914 ENSG00000140465.7 −0.222 3.22 × 10⁻⁵
F2RL3 cg03636183 19 17000585 ENSG00000127533.2 −0.130 0.0159
Given our observed genetic influences on smoking-DMS, we asked if previously reported genetic variants associated with smoking behavior [42] or nicotine me-tabolism [43] could impact DNA methylation levels in adipose tissue. We first focused on common genetic var-iants that were previously associated with smoking
phenotypes in the largest smoking genetic association study to date (n= 15,907) [42]. We observed that all gen-etic variants previously strongly linked to smoking be-havior (14 SNPs) [42] had an impact on adipose DNA methylation levels incis(Additional file2: Table S4). We then explored a recently reported association between Fig. 4Tissue-shared and adipose-specific smoking signals.aTissue-shared DNA methylation effects across adipose tissue and whole blood. The bar-plot shows the -log10Pvalue of the 42 smoking-DMS in adipose samples (blue), and the correspondingPvalue in the blood samples (red
a cluster of SNPs on chromosome 19 and nicotine metabolism, where the same genetic variants were also associated with blood DNA methylation levels in the same region as meQTLs [43]. We replicate the chromosome 19 meQTL findings in our adipose DNA methylation data at CpGs in genes CYP2A7, ENGL2, and LTBP4 (Additional file 2: Table S5), suggesting
that these are strong genetic impacts on DNA methylation that are shared across tissues. Taken to-gether, these genetic-methylation association results provide additional support for the hypothesis that some of the observed genetic impacts on smoking behavior and nicotine metabolism may be mediated by DNA methylation.
Table 4Tissue-shared smoking-induced differentially methylated sites in cancer-free subjects
IlmnID CHR Location Gene name Adipose tissue (n= 345) Blood samples (n= 567) Skin tissue (n= 195)
Coef. Pvalue Coef. Pvalue Coef. Pvalue
cg25189904 1 68299493 GNG12 −0.771 1.48 × 10⁻⁸ −0.974 6.92 × 10⁻¹⁸ −0.434 1.58 × 10⁻²
cg14179389 1 92947961 GFI1 −0.665 1.07 × 10⁻⁷ −0.404 4.74 × 10⁻⁶ −0.408 1.89 × 10⁻²
cg06644428 2 233284112 2q37.1 −0.704 1.61 × 10⁻⁷ −0.864 1.76 × 10⁻¹⁹ −0.641 3.39 × 10⁻⁴
cg05951221 2 233284402 2q37.1 −1.38 1.28 × 10⁻²⁹ −1.471 3.65 × 10−60 −1.161 6.13 × 10⁻¹³
cg21566642 2 233284661 2q37.1 −1.347 1.87 × 10⁻²³ −1.491 9.67 × 10−61 −1.138 4.83 × 10⁻¹¹
cg01940273 2 233284934 2q37.1 −0.679 8.93 × 10⁻¹⁰ −1.415 3.17 × 10−52 −0.302 3.09 × 10⁻²
cg11554391 5 321320 AHRR −0.72 2.00 × 10⁻⁸ −0.694 8.10 × 10⁻¹² −0.494 4.91 × 10⁻³
cg05575921 5 373378 AHRR −0.611 1.07 × 10⁻⁸ −1.672 2.45 × 10−80 −0.982 7.24 × 10⁻⁸
cg25648203 5 395444 AHRR −0.825 1.30 × 10⁻⁹ −0.937 3.50 × 10⁻²² −0.398 7.29 × 10⁻³
cg14120703 9 139416102 NOTCH1 −1.172 1.44 × 10⁻²⁰ −0.352 1.84 × 10⁻⁶ −0.423 8.69 × 10⁻³
cg21611682 11 68138269 LRP5 −0.734 8.10 × 10⁻⁹ −0.874 4.23 × 10⁻²⁰ 0.075 6.38 × 10⁻¹
cg22851561 14 74214183 C14orf43 −0.634 3.92 × 10⁻⁷ −0.5 5.24 × 10⁻⁷ −0.326 7.07 × 10⁻²
cg00378510 19 2291020 LINGO3 −0.781 1.53 × 10⁻⁸ −1.478 3.59 × 10−62 −0.133 4.66 × 10⁻¹
cg03636183 19 17000585 F2RL3 −0.826 1.80 × 10⁻¹⁴ −0.466 2.37 × 10⁻⁷ −0.372 1.45 × 10⁻²
IlmnID, Illumina probe ID;CHR, chromosome;Location, Illumina probe location (bp);Coef., regression coefficients from the linear mixed effect model, positive values denote hypermethylation in non-smokers and negative values denote hypermethylation in current smokers
Fig. 5Tissue-shared smoking-associated DNA methylation and gene expression patterns atAHRR.acoMET plot [49] of the association between 66AHRRCpG sites and smoking. Top panel shows the -log10Pvalue of the association; the middle panel shows genomic annotation; and the
Impacts on metabolic health and disease risk
Given the wide-ranging effects of smoking on human disease, we explored the links between the identified adipose methylation and expression smoking signals and phenotypes that are major risk factors for meta-bolic disease. Three metameta-bolic disease risk pheno-types—total fat mass (TFM), visceral fat mass (VFM), and android-to-gynoid fat ratio (AGR)—were profiled using dual X-ray absorptiometry in 288 subjects with adipose methylation and expression profiles. We assessed the association of the 42 smoking-DMS and 42 smoking-DES with these adiposity phenotypes using a twofold approach.
First, we tested for association between adipose methy-lation levels at the 42 smoking-DMS and the three phe-notypes, adjusting for covariates including age, BMI, and smoking. We observed that smoking-DMS in CYP1A1 and NOTCH1 were significantly associated with mea-sures of metabolic disease risk. First, methylation levels at three CpG sites inCYP1A1 were significantly associ-ated with VFM and AGR, either as main effects (cg23160522 and VFM, beta = 1.35 × 10⁻³, SE = 3.03 × 10⁻³, P= 4.35 × 10⁻⁷; cg23680900 and AGR, beta =−1.59, SE = 0.44, P= 6.58 × 10⁻⁶) or taking into account interactions (cg10009577 and AGR, P= 5.50 × 10⁻⁴), where current smokers and non-smokers have different patterns of associ-ation between DNA methylassoci-ation at CYP1A1 cg10009577 and AGR (Fig. 3c). Probe cg10009577 is located in the CYP1A1 promoter, suggesting gene regulatory impacts on CYP1A1expression levels. Correspondingly, we observed a nominally significant association betweenCYP1A1gene ex-pression and VFM (Fig. 3c), where current smokers and non-smokers have different patterns of association (P= 0.042). A significant negative association between DNA methylation levels and AGR was also observed with cg14120703 in NOTCH1 (beta =−1.80, SE = 0.43, P= 1.07 × 10⁻⁷). We pursued replication of these associations in an independent sample of 69 younger Finnish twins with adipose tissue Illumina 450K methylation profiles. We rep-licated the overall negative association between CYP1A1 cg10009577 and AGR (discovery sample beta =−0.95, SE = 0.31; replication sample beta =−0.58, SE = 0.25, P= 0.02) and observed a similar direction of inter-action effects, which did not reach nominal significance in the replication sample (Additional file2: Table S5).
We performed similar analyses with the 42 smoking-DES and observed main effects at F2RL3 on the three phenotypes (VFM beta =−1.5 × 10⁻³, SE = 3.78 × 10⁻⁴, P= 7.8 × 10⁻⁴; AGR beta = 2.3, SE = 0.56, P= 4.5 × 10⁻⁵; TFM beta = 1.6 × 10⁻³, SE = 3.9 × 10⁻⁴, P= 5.8 × 10⁻⁵), and OR51E1 on VFM (beta =−1.5 × 10⁻³, SE = 3.78 × 10⁻⁴, P= 7.8 × 10⁻⁴) and AGR (beta =−2.85, SE = 0.51, P= 3.1 × 10⁻⁸). We did not observe significant evidence for interaction effects in the gene expression results.
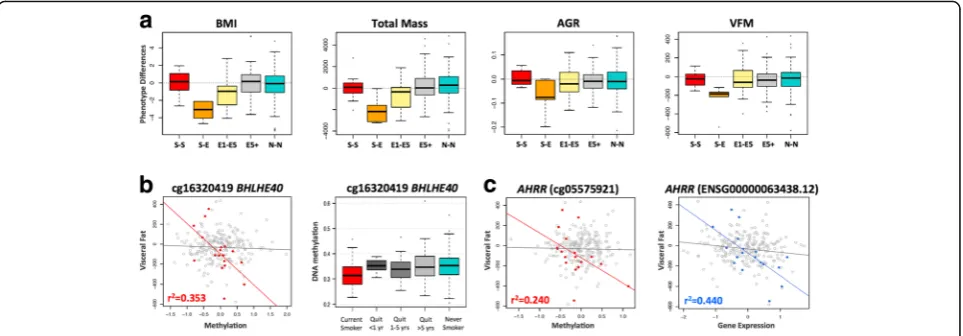
In the second set of phenotypic analyses, we explored the role of the 42 smoking-DMS and 42 smoking-DES on weight gain after smoking cessation. Recent studies have reported not only a gain in weight on smoking cessation, but also an increase in visceral fat [5]. We considered adiposity phenotypes in 246 of the individ-uals in our study at two time points, where time point 1 was the initial adipose DNA methylation profiling and phenotype measurement, and time point 2 was a phenotype measurement on average 5 years later. We found that current smokers who go on to quit smoking over this 5-year interval show a gain in adiposity across all phenotypes (Fig.6a), and this effect is also observed in individuals who quit within up to 4 years at time point 1. However, our data suggests that this gain in adiposity is not long lasting, because we do not observe this effect in the group of ex-smokers who had quit for > 5 years at time point 1. In comparison, there were no major phenotype changes within constant smokers (current smokers at both time points) or never smokers (non-smokers at both time points) across the two time points.
We tested if the 42 smoking-DMS and 42 DES in adi-pose tissue could predict future changes in adiposity upon smoking cessation, focusing on visceral fat accu-mulation as the major risk factor for the development of adiposity-related metabolic diseases. Based on the phe-notype results (Fig. 6a), we compared two groups of in-dividuals: first, the combined group (n= 18) of current smokers at the time of methylation profiling (time point 1) who subsequently quit smoking (n= 5), and in-dividuals who had quit within 1–4 years at time point 1 (n= 13); and second, the combined group (n= 228) of ex-smokers who had quit for > 5 years at time point 1 (n= 92), as well as constant smokers (n= 12) and never smokers (n= 124) across the two time points. We assessed the impact of methylation or expression at the 42 smoking-DMS (Additional file 1: Figure S4) and 42 smoking-DES (Additional file 1: Figure S5) on future changes in visceral fat, selecting results that showed significantly different patterns of association in the two groups of 18 and 228 subjects.
(Fig. 6b). The second signal was observed inAHRR(gene expression by group interaction term P= 4.7 × 10⁻⁵), where gene expression levels in current smokers or recent ex-smokers explain 44% of the variation in future gain in visceral fat (Fig.6c). The results were similar after correct-ing for smokcorrect-ing years and years since smokcorrect-ing cessation.
Discussion
Tobacco smoking is a major disease risk factor. Our study is the first to identify smoking-associated DNA methylation and gene expression changes in adipose tissue in humans. Approximately 30% of the identified smoking-methylation signals showed significant coordinated changes in gene expression levels in five genes, giving insights into the cascade of molecular events that are triggered in re-sponse to smoking, toxin exposure, and nicotine metabol-ism. At least a third of smoking-methylation signals (in nine genomic regions) were shared across tissues, showing that smoking leaves tissue-shared signatures. Given that our target tissue was adipose, we considered the impact of the identified smoking methylation and expression signals on metabolic disease risk. Significant associa-tions were observed between visceral fat and android-to-gynoid fat ratio and several smoking-methyla-tion and expression markers. Furthermore, methylasmoking-methyla-tion and expression levels at BHLHE40 and AHRR in current smokers or recent ex-smokers were predictive of future gain in visceral fat observed after smoking cessation. Our findings provide a first comprehensive assessment of methylation and expression changes related to
smoking in adipose tissue, with insights for metabolic health and disease risk.
Coordinated smoking methylation and expression changes overlapped at five genes (AHRR, CYP1A1, CYP1B1,CYTL1, andF2RL3), which include well-known and strongly replicated smoking-methylation signals, such as AHRR and F2RL3. Some of these genes have previously been linked to human phenotypes. For ex-ample, GWAS associations have been reported with multiple diseases and traits, such as drinking behavior (CYTL1) [44], cystic fibrosis severity (AHRR) [45], caf-feine consumption (CYP1A1) [46], and diastolic blood pressure (CYP1A1) [47], and methylation levels atAHRR have been linked to multiple phenotypes including lung function [48] and BMI [49]. At the five overlapping genes, methylation levels were predominantly negatively correlated with expression levels. CpG sites in AHRR, CYP1B1, and F2RL3 were located on the gene body, whereas those inCYTL1 and CYP1A1 were in the pro-moter. Our results are consistent with the expectation that promoter-based CpG sites negatively associate with gene expression [50–52]. Studies have reported both positive and negative correlations between methylation and expression for CpG sites in the gene body [53–56]. DNA methylation sites in the gene body that are nega-tively associated with expression levels may be located in alternative promoters that regulate the expression of particular isoforms.
signals appear adipose-specific, independent studies have reported links to smoking in multiple tissues. CYP1A1 smoking-associated methylation signals are present in the lung in the fetus [57] and in adults [30,35]. In adults, ef-fects are observed in normal lung tissue from lung cancer patients at both theCYP1A1promoter [35] and enhancer [30], which is also differentially methylated between nor-mal tissue and lung tumor tissue [30]. A recent large-scale meta-analysis of smoking methylation signals in blood also reported a moderate effect atCYP1A1[20]. Maternal to-bacco use was also associated with alterations in promoter methylation of placentalCYP1A1, and these changes were correlated withCYP1A1gene expression and fetal growth restriction [58]. Furthermore,CYP1A1 gene expression is downregulated byAHRR.CYP1A1is inducible by agonists of the aryl hydrocarbon receptor (AhR), which include en-vironmental pollutants and components of cigarette smoke. Following activation of AhR by an agonist in the cytoplasm, the AhR-ligand complex translocates to the nucleus, where it dimerizes with the aryl hydrocarbon re-ceptor nuclear translocator (ARNT) [59]. This heterodi-mer binds to the xenobiotic response element (XRE) site ofCYP1A1in the upstream enhancer region, which acti-vates transcription. CYP1A1 metabolizes drug molecules and environmental pollutants, including polycyclic aro-matic hydrocarbons, dioxin, and benzo(α)pyrene, into highly reactive intermediates. These derivatives can bind to DNA and form adducts, which may contribute to car-cinogenesis [60]. AhR, in a complex with xenobiotic com-pounds and ARNT, induces CYP1A1 expression, which subsequently detoxifies toxic components of cigarette smoke.AHRRsuppresses the effects ofAhRthrough bind-ing to ARNT. Hypo-methylation ofAHRR and increased AHRRexpression may therefore reduce cellular responses to smoking, potentially through CYP1A1 [61]. However, our findings of increased gene expression levels at both AHRR and CYP1A1 in current smokers suggest that smoking-induced AHRR changes do not impact the CYP1A1 response to smoking in adipose tissue. The smoking effects at CYP1A1 in our study appear to be adipose-specific; therefore, these observations do not ex-tend to blood, skin, or lung samples.
In addition to CYP1A1, other smoking signals that we identify in this study have also been previously linked to lung cancer. CYP1B1 differentially methyl-ated effects have been reported for smoking, for lung cancer, and for age at cancer diagnosis in non-small cell lung carcinoma (NSCLC) samples [62]. Several of our smoking signals were previously reported to be differentially methylated in lung adenocarcinoma tumor and matched non-tumor tissue [63]. These included two of our top smoking-DMS,CYTL1andACVRL1,and seven of our top smoking-DES, CYTL1, JAM2, CYGB, TAL1, GRIK3,SOX17, andTEK.
In line with previous studies, we observe that genetic variation can impact the smoking-DMS, with potential implications for genotype influences on the rates of toxin elimination and nicotine metabolism in the human body. Importantly, we observe that all of the major smoking genetic variants detected in the largest smoking GWAS to date appear to influence DNA methylation levels in cis. These findings strongly suggest that DNA methylation may mediate some of the effects of genetic influences on smoking behavior, toxin elimination, or nicotine metabolism. We also replicate results from a genome-wide association study of nicotine metabolite ratio, identifying a 4.2-Mb region on chromosome 19q13 where GWAS SNPs were also associated with DNA methylation levels [43]. Taken together, these findings suggests some of the observed genetic impacts on smok-ing behavior and nicotine metabolism may be mediated by DNA methylation and that such effects are robust and shared across tissues.
Our analyses specifically in ex-smokers show variability in the extent of signal reversal over time, which is consist-ent with previous findings. We observe an overall trend towards at least partial reversal at most of the identified smoking-associated signals. Importantly, our study is the first to show that this trend is also observed in gene ex-pression levels. Our findings suggest that smoking has a longer lasting influence on the methylome compared to the transcriptome, where the majority of reversal effects occur within the first year after smoking cessation.
A limitation to our study is partial correction for the influence of expected covariates. These include, first, alco-hol consumption, which co-occurs with smoking. In our co-occurrence analyses, none of the alcohol-associated CpG sites reached genome-wide significance after adjust-ing for smokadjust-ing. In a previous alcohol EWAS in blood, Liu et al. [66] also found that the effect size of the majority alcohol-DMS was not affected by smoking status suggest-ing that despite their co-occurrence, smoksuggest-ing and alcohol impact DNA methylation in different aspects. A related question is optimal correction for cell composition in pose tissue. Since we only had access to subcutaneous adi-pose tissue biopsies, rather than isolated cell subtypes, we corrected for cell composition by using the analytical ap-proach within the reference-free EWAS [32] framework and found that the majority of results remained largely unchanged. However, it is possible that this does not fully capture the effect of a heterogeneous population of cells as a confounder. Some of the smoking-DMS such as BHLHE40, which was also found to be predict-ive of future gain in visceral fat, may reflect cell-specific methylation profiles.BHLHE40was previously reported to be hypo-methylated in activated NK cells (but not in naive NKs, T, and B cells) [67] and a similar trend was observed for AHRR [67]. One interpretation of these findings is that some smoking signals are cell subtype specific [68, 69], potentially reflecting a selective en-hancement of activated cells, because smoking can also induce changes in blood count [70]. In adipose tissue, this particular effect may be represented as an infiltra-tion of activated NK cells, and this infiltrainfiltra-tion may in-crease with obesity, diabetes, and smoking. On the other hand, the relative abundance of NK DNA com-pared with adipose DNA in adipose tissue is minimal; therefore, these effects should be minimal. Future studies are needed to assess the impact of these potential con-founding effects using for example histological and im-munological staining of adipose tissue.
Conclusion
Our results show that smoking can impact DNA methy-lation and gene expression levels in adipose tissue. To our knowledge, this is the first study that performed genome-wide analyses of smoking in adipose tissue DNA methylation and gene expression profiles. The key results are that, first, smoking leaves a signature on both the methylome and transcriptome with overlapping sig-nals; second, smoking methylation signals tend to be tissue-shared effects; third, smoking has a longer lasting influence on DNA methylation levels than on gene ex-pression after smoking cessation; and forth, specific smoking methylation and expression signals are associ-ated with metabolic disease risk phenotypes, as well as future weight gain after smoking cessation.
Methods
Study population and sample collection
The primary sample of subjects is twins from the TwinsUK cohort who were recruited as part of the MuTHER (Multiple Tissue Human Expression Resource) study [71]. All subjects are Caucasian females and ascer-tained to be free from severe disease when the samples were collected. The sample consisted of 542 female twins, comprising 54 current smokers, 197 ex-smokers, and 291 non-smokers. The 542 twins included 84 MZ twin pairs, 112 DZ twin pairs, and 150 unrelated individuals (Add-itional file2: Table S6). Adipose tissue biopsies were ob-tained from all subjects between August 2007 and May 2009. Details of biopsy procedures and sample descrip-tions are described previously [72]. Briefly, subcutaneous adipose tissue biopsies were dissected from near the um-bilicus of the abdominal region; the fat layer was separated from skin layers and stored immediately in liquid nitro-gen. Both DNA and RNA were extracted from the same adipose tissue biopsy, as previously described [72, 73]. Ethical approval was granted by the National Research Ethics Service London-Westminster, the St Thomas’ Hospital Research Ethics Committee (EC04/015 and 07/H0802/84). All research participants have signed an informed consent prior to taking part in any research activities.
To explore tissue-shared effects, peripheral blood sam-ples from 789 and 362 subjects from TwinsUK were also explored for genome-wide methylation and expression profiling, respectively. The blood samples for methyla-tion measurement were taken from 1992 to 2012, and the samples for gene expression measurement were taken from 2007 to 2009. From the 542 subjects with available adipose tissue samples, 200 and 222 subjects donated blood samples for methylation and expression profiling, respectively. Blood samples and adipose tissues were collected during the subject’s visit to the clinic.
The majority of data analysis focused on methylation and expression level differences between current smokers and non-smokers. The sample subsets of current smokers and non-smokers comprised 345 subjects in adipose methyla-tion and expression samples, 567 subjects in blood methy-lation samples, and 237 in blood expression samples.
Replication and validation analyses
effects at the 42 smoking-DMS. Details of dataset 5 were described in the previous section.
Dataset 1: LEAP cohort adipose tissue (USA)
To replicate the 42 adipose tissue smoking-DMS, we studied 104 participants from the New England Family Study, the LEAP cohort (mean BMI 30.9 ± 7.03, mean age 47 ± 1.7, 48% male; see Additional file 2: Table S6), described in detail elsewhere [39]. The individuals are of mixed ancestry (63.5% white) and were not affected with disease. There were 46 current smokers and 58 non-smokers. Subcutaneous adipose tissue samples in these participants were collected from the upper outer quadrant of the buttock, followed by DNA extraction, and Infinium HumanMethylation450 BeadChip array profiling as previ-ously described [37]. Replication analyses were performed using a linear regression model adjusting for age, gender, BMI, and batch effect.
Dataset 2: Finnish twin adipose tissue
To replicate the methylation associations with metabolic health traits, we studied 69 Finnish twins (mean age 31.1 ± 4.43 years, mean BMI 27.5 ± 4.72, 44.9% male; see Additional file2: Table S6), who were recruited as a part of the Finnish twin cohort. Adipose tissue sample collec-tion and DNA extraccollec-tion in this sample have been previ-ously described in detail [74, 75]. The sample included 34 full MZ twin pairs and 21 current smokers. DNA methylation profiling was measured by Infinium HumanMethylation450 BeadChip array and TFM and AGR were determined by dual energy X-ray absorpti-ometry (DEXA). Replication analyses were performed using a linear mixed effect regression model adjusting for age, gender, BMI, family, batch effect, and alcohol in-take. Sample characteristics of the replication cohorts are shown in Additional file2: Table S6.
To examine the tissue specificity of the 42 smoking-DMS, we included two additional datasets (dataset 3 and dataset 4) for validation of tissue-shared smoking effects.
Dataset 3: TwinsUK skin tissue
The first validation dataset for identifying tissue-shared effects included 195 skin tissue samples from twins (mean age 59.1 ± 9.71 years, mean BMI 26.7 ± 4.71; see Additional file 2: Table S6) from the TwinsUK cohort. This analysis included 37 current smokers and 158 non-smokers cancer-free female subjects only, and some sub-jects also provided adipose samples in the current study. The TwinsUK skin samples and the evaluation of DNA methylation in the samples are described elsewhere [34]. We performed the analysis using a linear mixed effects model adjusting for age, BMI, alcohol consumption, batch effect, family structure, and zygosity. Sample characteristics are shown in Additional file2: Table S6.
Dataset 4: Lung cancer tissue
The second validation dataset for identifying tissue-shared smoking effects included 168 lung cancer female subjects (mean age 65.1 ± 10.66 years; see Additional file 2: Table S6) from a multicenter cohort of 450 subjects with non-small cell lung cancer (GEO dataset: GSE39279) [76]. In the validation analysis, we selected only female subjects who had smoking records (129 current smokers and 39 non-smokers) and used a linear regression model to test for the effect of smoking on methylation, adjusting for age, cancer stage [1 to 4], and cancer type (adeno-carcinoma or squamous). DNA methylation levels were obtained using the Infinium HumanMethylation450 BeadChip, and BMIQ normalization was performed prior to analysis.
Phenotype collection
Some participants have regular clinical research visits, approximately every 2 years. To study the weight gain after smoking cessation, we used phenotype information for VFM collected at two time points: the first time point is the date nearest to the adipose tissue collection date, and the second time point is the most recent clin-ical research visit of the subject where VFM data were collected. The time between longitudinal clinical re-search visits used in this study ranged between 3 and 7 years with a mean of 5.1 ± 0.70.
Genome-wide DNA methylation profiles
The Infinium HumanMethylation450 BeadChip (Illumina Inc., San Diego, CA) was used to measure DNA methyla-tion in both adipose and blood samples. Details of experi-mental approaches have been previously described [72,78]. At each probe, the methylation levels are characterized as a finite bounded quantitative trait ranging between 0 and 1, and represented as beta values. To overcome biases caused by the two Illumina probe types and two-color channels [79], we performed the beta mixture quantile dilation (BMIQ) method [80] and background correction for each sample. DNA methylation probes that mapped incorrectly or to multiple locations in the reference se-quence were removed. Probes with more than 1% of sub-jects with detectionPvalue > 0.05 were also removed. All the probes have non-missing values in blood samples and less than 1% missing subjects in adipose samples. Probes located on chromosomes X and Y were removed from the analysis. To check for sample swaps, we compared 65 sin-gle nucleotide polymorphism (SNP) markers that featured as control probes on the array to genotypes for each sub-ject and removed subsub-jects with incomparable genotypes. Because methylation levels on the majority of probes do not follow the normal distribution, which might violate the regression assumption for downstream analysis, we normalized the methylation levels toN(0,1) prior to ana-lysis. For all the other methylation datasets (USA adipose, Finnish adipose, lung cancer tissues, TwinsUK skin sam-ples, and TwinsUK blood samples), we performed exactly the same quality control steps for data cleaning and normalization prior to the analysis.
RNA-sequencing data
The twin adipose RNA-seq data and quality control have been previously described [81, 82]. Briefly, sequenced paired-end reads (49 bp) were mapped to the human genome (GRCh37) by Burrows-Wheeler aligner (BWA) software v0.5.9 [83], then genes were annotated as de-fined by protein coding in GENCODE v10 [84]. Samples were excluded if they failed during library preparation or sequencing. Samples were only considered to have good quality if more than 10 million reads were sequenced and mapped to exons. Gene expression levels were
quantified per gene, estimated as RPKM values (reads per kilobase of transcript per million mapped reads) and rank normal transformed prior to analysis. The genotype of each subject was used for identity checks in case of sample swaps. After removing genes located on chromo-somes X and Y, and non-coding transcripts, 17,399 genes were included in the gene expression analysis for adipose tissues and blood samples.
Genotype data
Genotypes were available for all subjects in study. Geno-typing of the larger TwinsUK dataset was performed using HumanHap300, HumanHap610Q, HumanHap1M Duo, and HumanHap1.2M Duo 1M arrays. Imputation was done in two datasets separately and subsequently merged with GTOOL. Genotype data were pre-phased using IMPUTE2 without a reference panel, then using the resulting haplotypes to perform fast imputation from 1000 Genome phase1 dataset [85, 86]. We used 1000 Genomes Phase I (interim) as reference set, based on a sequence data freeze from 23 Nov 2010; the phased hap-lotypes were released Jun 2011. After imputation, SNPs were filtered at a MAF > 5%. Genotypes were used for identification of meQTLs and eQTLs in the 542 adipose samples.
Statistical analysis
Differential methylation and expression analyses
zygosity, primer index, and clinic visit date were taken as random effect, and all the other covariates were included as fixed terms. For each CpG site or gene, a full model that regressed all of the covariates was compared to a null model that excluded smoking status. The models were compared using the ANOVA F statistic. A genome-wide significance level was set at 1% false discovery rate for all analyses.
In order to account for mixtures of cell types in adipose tissue, we performed a EWAS using the reference-free ap-proach proposed by Houseman et al. [32]. The method is similar to surrogate variable analysis (SVA) and inde-pendent surrogate variable analysis (ISVA), which is used to adjust for technical errors (e.g., batch effect) and confounders. In addition, the reference-free ap-proach also includes a bootstrap step to account for the correlation in the structure of standard errors. Using this approach, we can estimate direct epigenetic effects that account for cell compositions and use bootstrap-based P values to assess their significance. Due to the limitation that the reference-free approach can currently only be ap-plied to datasets of unrelated individuals, we used 251 unre-lated individuals from the original 542 twins and compared the top results between two EWASs.
To identify tissue-shared smoking differentially meth-ylated signals across adipose and whole blood datasets, we compared the genome-wide FDR 1% signals across adipose and whole blood DNA methylation analyses. In whole blood samples, we tested for association between smoking status and DNA methylation levels at 452,874 CpG sites in 86 current and 481 non-smokers in blood. We compared the FDR 1% adipose DMS to 2782 CpG sites that were associated with smoking in blood at FDR 1% (P= 1.14 × 10⁻⁵). To further explore tissue spe-cificity in other tissues, we explored the 14 tissue-shared smoking-DMS identified in both adipose and blood samples. We used previously published datasets of 196 cancer-free female subjects with skin tissue biop-sies [34] and a lung cancer DNA methylation dataset [76], applying a Bonferroni-adjustedP value of 3.6 × 10⁻⁴ as the significance threshold.
Receiver operative curve (ROC) analysis
We tested several models for predicting smoking status based on the different combinations of the adipose smoking-DMS and smoking-DES. The sensitivity and specificity of these prediction models were calculated using receiver operative curve (ROC). The ROC analysis was performed in R using the“pROC”package [88] with the“lme”function for logistic regression, where outcomes are categorized as current smokers and non-smokers. We then used the “predict” function to predict the expected probabilities under different combinations of predicting factors (methylation levels of 14 CpG sites and expression
levels at five genes), and the “roc” function to predict the sensitivity and specificity and draw the area under the curve. We selected 27 current smokers and 145 non-smokers as a training set to construct a logistic model for smoking status classification, and then used the remaining set of 173 subjects (27 current smokers) as a validation set, in which we obtained the AUC values. We repeated this procedure 1000 times and report the average AUC values across 1000 validation sets.
Smoking cessation analyses
We quantified“reversal” time by estimating the time (in smoking-quit years) required for ex-smokers to revert to 25% of the change in methylation towards non-smokers. We first calculate the difference between methylation levels in current smokers and those in non-smokers and use 25% change of that difference as a “reversal” threshold. For example, at cg05575921 in AHRR, the median level of methylation residual is −0.234 in current smokers and 0.037 in non-smokers, resulting in a 0.271 methylation change. Therefore, ex-smokers who reached methylation levels of −0.031 were classified as subjects who “reversed”. We quantified the proportion of subjects who reversed within different quit years. For example, at cg05575921, 6 ex-smokers quit in less than 1 year, but only one had methylation reverting to 25% of the methylation change towards non-smokers; there-fore, the reversal rate was 16.7%. We quantified reversal at the gene expression level using the same approach.
Methylation QTL (meQTL) analyses
Genome-wide meQTL analyses were performed testing for the association between common genetic variants and DNA methylation at CpG sites in the two adipose tissue samples. We only considered SNPs that were sig-nificantly associated with DNA methylation in cis to be meQTLs. If multiple SNPs were identified for a single CpG site, we reported only the most significant SNP per CpG site (P= 5 × 10⁻⁵, as described in Grundberg et al. [72]). In total, methylation levels of 102,461 CpG sites were associated with genetic factors in cis, and 25,531 sites intrans.
CpG sites within that region, 16 CpG sites showed sta-tistically significant association with 173 SNPs. We com-pared our meQTL findings to those from Loukola et al. [43] at a modified Bonferroni significance threshold of 1.81 × 10⁻⁵(= 0.05/(16 × 173)) and identified SNPs that influence methylation levels at 5 CpG sites (inCYP2A7, ENGL2, andLTBP4genes) (Additional file2: Table S5).
Correlations between methylation and gene expression levels
We compared the 542 subjects’adipose methylation and gene expression levels at the five overlapping genes iden-tified in the two genome-wide association analyses. Both the methylation and expression data were first adjusted for covariates, and Spearman’s correlation test was then performed on the residuals.
Metabolic disease risk phenotype analyses
We studied the impacts of smoking methylation signals on obesity and metabolic phenotypes. We explored 288 adi-pose subjects (42 current smokers and 246 non-smokers, mean BMI = 26.70 ± 4.62) who had available DEXA profiles at or within up to 1 year of the adipose tissue biopsy. We compared the association between DNA methylation and the adiposity phenotypes, such as visceral fat mass (VFM), total fat mass (TFM), and android-to-gynoid fat ratio (AGR). Analyses were carried out at the 42 smoking-DMS using a linear regression model adjusting for BMI, age, and smoking status. A significance level was set at a Bonferroni-adjusted threshold of P= 5.7 × 10⁻⁴. We used a similar approach to test for phenotype associa-tions with the 42 smoking-DES.
To further investigate the effect of 42 smoking-DMS and 42 smoking-DES on weight gain after smoking ces-sation, the adiposity phenotype differences were ob-tained at two time points in a reduced sample size of 248 subjects. Depending on a subjects’smoking behavior at the two time points, we categorized subjects into five categories: current smokers at the two time points (con-stant smokers, S-S, n= 12), current smokers at time point 1 who quit smoking by time point 2 (S-E, n= 5), ex-smokers (who quit smoking within 1–5 years) at time point 1 who remain ex-smokers at time point 2 (E1-E5, n= 13), ex-smokers who quit > 5 years at time point 1 who remain ex-smokers at time point 2 (E5+, n= 92), and non-smokers at both time points (never smokers, N-N,n= 124). We then calculated the phenotype differ-ences (phenotype at time point 2 minus phenotypes at time point 1) for each subject and correlated this differ-ences to their adipose methylation (42 smoking-DMS) and gene expression levels (42 smoking-DES).
We used the R statistical software ( https://www.r-projec-t.org/) for all analyses and figures, and the regional plots were generated using the coMET package [90].
Additional files
Additional file 1:Figure S1.Scatterplot of correlations between EWAS -log10P-values from the linear mixed effect model used in the current study
adipose discovery sample (y-axis) and results from Reference-free EWAS approach proposed by Houseman et al. (x-axis) [32].Figure S2.Smoking cessation and adipose DNA methylation profiles. DNA methylation levels at the 42 smoking-DMS and smoking status in 542 adipose samples. Subject groups include current smoker, subjects who quit smoking within one year, subjects who quit between 1 to 5 years, subjects who quit smoking more than 5 years, and subjects who never smoked. Fourteen CpG sites located in genes with both smoking-DMS and smoking-DES are denoted with asterisks.Figure S3.Smoking cessation and adipose gene expression profiles. Gene expression levels at the 42 smoking-DES and smoking status in 542 adipose samples. Subject groups include current smoker, subjects who quit smoking within one year, subjects who quit between 1 to 5 years, subjects who quit smoking more than 5 years, and subjects who never smoked. Five genes with both smoking-DMS and smoking-DES are denoted with asterisks.Figure S4.Association between DNA methylation levels at the 42 smoking-DMS and future change in visceral fat mass (VFM) in 18 (red solid dots) and 228 subjects (gray hollow dots).Figure S5.Association between gene expression levels at the 42 smoking-DES and future change in visceral fat mass (VFM) in 18 (blue solid dots) and 228 subjects (gray hollow dots). (PDF 1411 kb)
Additional file 2:Table S1.Four smoking-induced differentially methylated and expressed genes in blood samples.Table S2.Validation of 14 tissue-shared smoking-DMS across four sample types.Table S3.
Replication of the 42 smoking-DMS in the LEAP cohort [39] with 104 current smokers and non-smokers.Table S4.Previously-identified smoking genetic variants and their impacts on DNA methylation and gene expression in adipose tissue.Table S5.DNA methylation QTL (meQTLs) analyses at the chromosome 19 region from Loukola et al. [43], showing replication in TwinsUK adipose tissue samples.Table S6.Characteristics of TwinsUK (adipose tissue, blood samples, and skin tissue [34]), Finnish cohort [74,75], LEAP cohort [39], and lung cancer [76] samples. (XLSX 43 kb)
Abbreviations
AGR:Android-to-gynoid fat ratio; AhR: Aryl hydrocarbon receptor; AUC: Area under curve; BMI: Body mass index; BWA: Burrows-Wheeler aligner; DES: Differentially expressed signals; DEXA: Dual energy X-ray absorptiometry; DMS: Differentially methylated signals; EWAS: Epigenome-wide association study; FDR: False discovery rate; LME model: Linear mixed effect model; MAF: Minor allele frequency; meQTL: Methylation quantitative trait locus; NSCLC: Non-small cell lung carcinoma; PCA: Principal component analysis; RNA-seq: RNA-sequencing; ROC: Receiver operative curve; SE: Standard error; SNP: Single nucleotide polymorphism; SVA: Surrogate variable analysis; TFM: Total fat mass; TSS: Transcription start site; TWAS: Transcriptome-wide association study; VFM: Visceral fat mass
Funding
![Fig. 3 Smoking-associated DNA methylation and gene expression patterns at CYP1A1. a coMET plot [90] describing the genomic region ofepigenome-wide association between smoking and CYP1A1 methylation (top panel), along with functional annotation of the regio](https://thumb-us.123doks.com/thumbv2/123dok_us/8980788.1890156/7.595.58.539.87.288/associated-methylation-expression-ofepigenome-association-methylation-functional-annotation.webp)