Open Access
Research
A Method of Drusen Measurement Based on the Geometry of
Fundus Reflectance
R Theodore Smith*
1
, Takayuki Nagasaki
1
, Janet R Sparrow
1
,
Irene Barbazetto
1
, Caroline CW Klaver
2
and Jackie K Chan
1
Address: 1Department of Ophthalmology, Columbia University, New York, NY, USA and 2IGT Afdeling Oogheelkunde, 3015 GD Rotterdam,
Netherlands
Email: R Theodore Smith* - [email protected]; Takayuki Nagasaki - [email protected]; Janet R Sparrow - [email protected]; Irene Barbazetto - [email protected]; Caroline CW Klaver - [email protected]; Jackie K Chan - [email protected] * Corresponding author
Abstract
Background: The hallmarks of age-related macular degeneration, the leading cause of blindness in the developed world, are the subretinal deposits known as drusen. Drusen identification and measurement play a key role in clinical studies of this disease. Current manual methods of drusen measurement are laborious and subjective. Our purpose was to expedite clinical research with an accurate, reliable digital method.
Methods: An interactive semi-automated procedure was developed to level the macular background reflectance for the purpose of morphometric analysis of drusen. 12 color fundus photographs of patients with age-related macular degeneration and drusen were analyzed. After digitizing the photographs, the underlying background pattern in the green channel was leveled by an algorithm based on the elliptically concentric geometry of the reflectance in the normal macula: the gray scale values of all structures within defined elliptical boundaries were raised sequentially until a uniform background was obtained. Segmentation of drusen and area measurements in the central and middle subfields (1000 µm and 3000 µm diameters) were performed by uniform thresholds. Two observers using this interactive semi-automated software measured each image digitally. The mean digital measurements were compared to independent stereo fundus gradings by two expert graders (stereo Grader 1 estimated the drusen percentage in each of the 24 regions as falling into one of four standard broad ranges; stereo Grader 2 estimated drusen percentages in 1% to 5% intervals).
Results: The mean digital area measurements had a median standard deviation of 1.9%. The mean digital area measurements agreed with stereo Grader 1 in 22/24 cases. The 95% limits of agreement between the mean digital area measurements and the more precise stereo gradings of Grader 2 were -6.4 % to +6.8 % in the central subfield and -6.0 % to +4.5 % in the middle subfield. The mean absolute differences between the digital and stereo gradings 2 were 2.8 +/- 3.4% in the central subfield and 2.2 +/- 2.7% in the middle subfield.
Conclusions: Semi-automated, supervised drusen measurements may be done reproducibly and accurately with adaptations of commercial software. This technique for macular image analysis has potential for use in clinical research.
Published: 18 April 2003
BioMedical Engineering OnLine 2003, 2:10
Received: 10 February 2003 Accepted: 18 April 2003
This article is available from: http://www.biomedical-engineering-online.com/content/2/1/10
Background
Color fundus photographs have been routinely employed for diagnostic purposes for many years, and fundus photo gradings are central to clinical studies of macular disease [1,2]. The natural history of age-related macular degener-ation (AMD), the leading cause of blindness in the devel-oped world [3], is in particular tied to that of subretinal deposits known as drusen [4–12]. Drusen are key in the classification of AMD, hence the importance of drusen identification and measurement in clinical studies. The classification of patients by stage of age-related maculop-athy involves painstaking analysis of drusen size, number, area and morphology in several subcategories. Significant effort has been placed in developing and validating the In-ternational [1] and Wisconsin [2] Grading Systems. The systematic study of drusen resorption following laser pho-tocoagulation also underscores the importance of drusen measurement and recognition. [8–10,13–16].
There has been continued interest in the use of digital techniques for quantification of macular pathology, par-ticularly drusen, over the last two decades [17–25]. How-ever, despite progress, none of these methods have gained widespread use. A major obstacle has been that the reflect-ance of the normal background, on which the pathology is superimposed, is inherently non-uniform. In particular, the normally less reflectant central macula is superim-posed on whatever the underlying or "true" drusen reflect-ance might be. Hence, given two anatomically identical drusen, one in the center of the macula and one at 3000
µm, the observer will see them differently in the fundus photograph. The outlying drusen will appear brighter and larger than its identical counterpart. The human eye with training makes allowances for this variability, but a com-puter applying a threshold does not.
Prior methods have so far been unable to deal with this non-uniform macular background reflectance as a whole. An early study [25] used adaptive thresholding techniques on 1024 separate windows of 8 × 8 pixels. Perivascular windows sometimes incorrectly interpreted bimodal dis-tributions as coming from perivascular drusen. Large areas of background were also sometimes included due to in-correct choices of threshold. These sources of error re-quired many operator interventions to correct. The result was a method that was capable of excellent reproducibili-ty (+/- 2.3 %), but was too tedious for general use. Hence, as early as 1986 the limiting factor was not the time com-plexity of computer algorithms, but the fact that the meth-od itself was tied to local reflectance calculations. This problem persisted in a recent study that relied on applying local thresholds to regions ranging from 20 to 100 pixels square [17]. Drusen were identified first by checking the local histogram for sufficient skewness (equivalent in this method to determining that drusen were present in the
re-gion) and then setting a local threshold. However, the method was defeated if a large drusen dominated a local region. In this case the local distribution would not be skew, and the large drusen would be completely missed. A user would be required to correct this error manually af-ter the automated segmentation. In general, a post-processing step was necessary to correct drusen segmenta-tion errors or enlarge incompletely segmented drusen to achieve acceptable accuracy. These studies demonstrate that segmentation by local histograms and threshold tech-niques has serious deficiencies.
Rapantzikos [18] et al have used other morphological op-erators as well as varying local histogram criteria for threshold choice to try to correct these deficiencies. Their criteria involve kurtosis as well as skewness. The funda-mental fact remains, as they readily admit, no matter how many histogram-based criteria are employed for local seg-mentation, that widely different combinations of image features (drusen and background) can yield the same his-togram. An extreme example, as in [17], would be regions that were either all background or all drusen, in either case yielding the same mesokurtic nonskewed distribution. Their solution, a morphological dilation operator, is in-tended in the all drusen case to distort the local histogram by reintroducing background and thereby improve threshold recognition. It is unclear, however, that this ar-tificial operator will always perform as intended. Another example of the arbitrary application of a general tool oc-curs when their segmentation leaves isolated bright groups of pixels. They conclude if these are in close prox-imity, then they possibly belong to the same large drusen and therefore must be expanded by a closing operator. But these could also be isolated small hard drusen. Lastly, de-spite the use of a wide range of general image analysis tools, their methods, as those in the other references, take no account of the intrinsic background variability, and ac-cordingly can produce errors in a systematic and predicta-ble fashion: inadequate segmentation centrally and over inclusive segmentation in the peripheral macula, as their own illustrations demonstrate.
to give a global threshold function. Since diabetic exu-dates tend to be smaller than soft drusen, it is unclear if sufficient featureless windows would be available in an image with multiple soft drusen to apply this method.
Our approach to this problem has been as follows. We first demonstrated that there was an inherent geometric pattern to the background reflectance in normal fundus images [26]. We then developed a semi-automated inter-active method based on these patterns to level the back-ground reflectance of a drusen-containing image independent of the reflectivity of the overlying drusen (preliminary results presented in abstract form [27]). This allows the use of a global threshold to segment the drusen accurately. By adopting this unified approach to the mac-ular reflectance problem, we avoid the multiple local thresholds used in previous approaches [17–20,24,25]. It is important to note, however, that our method is not the standard technique of shadowing by subtracting or divid-ing by a blur image. These standard techniques [28] (also used herein) are useful for shading correction on large scales. As we have shown in our previous work [26], how-ever, the macular reflectance can change significantly over ranges of distance (50–100 µm) comparable to the size of pathologic structures of interest. Hence, subtracting the variation on this scale would tend to remove such struc-tures from the image. Indeed, one reason we are present-ing our particular method is that we found after many trials and errors that none of the standard morphological transform routines (dilations, erosion, closings) or com-binations thereof, were able to precisely define the bound-ary of pathological features in a fundus image. We determined that it would be nearly impossible to com-pletely automate the process relying solely on mathemat-ical morphology. On the other hand, a potential advantage of using simpler techniques in less specialized software, with expert oversight of the final segmentations, is portability and use at other institutions for macular research.
We report a semi-automated digital method for drusen measurement in fundus photographs using commercially available software and test it for reliability against the cur-rent standard of fundus photo grading by stereo pair view-ing in the central 1000-micron diameter and middle 3000-micron subfields.
Methods
Subjects
The drusen images consisted of stereo pairs of standard 35-degree film-based color fundus photographs centered on the macular regions. Clinicians expert in AMD (IB and CCWK) selected twelve good quality stereo pairs of cases with Stage 2 or 3 age-related maculopathy (as defined by the International Grading System) at random from the
Columbia Macular Genetics Study (CMGS). Hence, all cases had soft drusen present but lacked the advanced le-sions of geographic atrophy or choroidal neovasculariza-tion. Pigmentary abnormalities (hyper- or hypopigmentation) were not excluded. The CMGS is an ongoing cross-sectional case-control study of the possible genetic bases of macular degeneration. This study has been approved by the New York Presbyterian Hospital In-stitutional Review Board. One photograph from each pair was chosen for digitization. All patients were white and over 60 years of age. Photographs of normal maculae from the files of the first author (RTS) were also analyzed.
Image acquisition
All photographs were scanned and digitized (CoolScan LS-2000, Nikon Corporation, Tokyo, Japan) at resolu-tions of 2700 pixels/inch (actual optical resolution). The images were saved as 24-bit RGB TIFF files, with 256 levels of intensity value for each color channel.
Image Processing
For uniformity of processing, all images were resized with bicubic interpolation so that the distance from the center of the macula to the temporal disc edge was 490 pixels. These images were smaller than the originals, but still con-tained detail information that was more than adequate for our methods. This disc to macula distance anatomically (3000 microns) is a more reliable constant than the disc diameter (DD) often used as a clinical reference scale. We also found this approach more reliable than resizing based on camera magnifications. We worked completely within commercially available software (Photoshop 5.5, Adobe Systems Inc., San Jose, CA) on a desktop PC. The regions studied were the central 1000-micron diameter circular subfield and the 3000-micron outer diameter an-nular subfield (with 1000-micron inner diameter) cen-tered on the fovea (the 1500 micron diameter anatomical center of the macula). These are the central and middle subfields defined by the Wisconsin grading template [2]. The outer 6000-micron subfield of the Wisconsin system was not used in this study.
was chosen to be a typical arbitrary extra-foveal back-ground color, so that the result was a color-balanced shad-ing-corrected fundus picture recognizable to the human eye. We called this the standardized image. While the off-sets are mathematically arbitrary, and do not affect a study of image variation numerically, we found that human rec-ognition of fundus features was essential. Further optimi-zation of visual recognition of fundus features could be achieved by contrast enhancement in Photoshop (see below).
The resulting standardized images had the property that relative variation in brightness on a small scale was pre-served with respect to the originals. Large-scale photo-graphic variation as a source of bias had been removed, and the mean background colors of these images were nearly identical. Each standardized image was also stored with contrast-enhanced versions (Photoshop/Autolevels and Autocontrast) for ease of visual recognition of drusen. We found, as have others [17,18], that drusen had greater contrast in the green channel than in the other channels, or other combinations of channels. All further analysis and drusen segmentation were hence carried out on the green channel of the standardized image, with the full color contrast-enhanced versions used for subjective comparison.
Macular background leveling in images with drusen
This process takes place entirely within the Photoshop program. The semi-automated method relies on correct-ing the normal concentric patterns of macular reflectance [26]. These concentric elliptical patterns have the addi-tional property that the background reflectance is radially increasing in all directions from the macular center. The ideal correction, then, would be to add back in to the im-age a signal with peak at the fovea and tapering radially that exactly compensated for the loss of central reflectivity in the underlying macular background pattern.
A macula interspersed with drusen, however, obstructs ex-act measurement of the reflectance pattern. Therefore, we have developed an approximate leveling based on the concentric elliptical geometry that "fills in" the non-back-ground regions occupied by drusen (or other pathology). The method relies on the patches of normal to near nor-mal retina amongst the drusen to provide a skeleton framework for what that underlying background would have been. At each step of the procedure, a prescribed el-liptical region surrounding the center is brightened by an additive or multiplicative (percentage) correction; drusen included are thus brightened along with the background, so that a single threshold may ultimately identify them. If other abnormalities such as RPE hypopigmentation were present, they would be brightened also, hence possibly in-cluded in the final threshold (See Results and Discussion).
Step 1. Semi-automated method: luteal pigment correction A major factor in these centrally darker patterns is absorb-ance by luteal pigment. We found in our mathematical modeling (data not presented) that fits to macular data were significantly improved when the region with evident luteal pigment was fit separately. Hence, if luteal pigment was evident (as judged by the presence of a disc of charac-teristic yellowish coloration in the central macula, or marked central background darkening consistent with that of luteal pigment), this region was corrected first. The corrections in this step were all multiplicative.
As an absorber, luteal pigment will reduce the brightness of each underlying structure by a percentage. We therefore constructed appropriate annular zones in the macula for percentage (multiplicative) increases in brightness to be empirically determined using published data on the spa-tial distribution of macular pigment [29,30]. These ob-servers found that the macular pigment density (hence optical density) is greatest centrally, drops to half-maxi-mum within a diameter of 500 to 600 µm, reaches a quar-ter-maximum at a diameter of about 1000 µm, and thence tapers slowly to a low constant level within a 2000 µm di-ameter region. We thus chose to bracket the 500 to 600
µm half-maximum range with a central disc of diameter 375 µm and an annulus of diameter 700 µm. We chose the next annulus of 1000 µm diameter to match the quar-ter-maximum density range, followed by a final annulus of 1250 µm, after which the effect of luteal pigment ap-peared to be essentially constant. The correction percent-ages to be used in these regions were determined empirically by testing on images from several subjects with clinically apparent luteal pigment. We looked at the green channel of these images (standardized as in Meth-ods, III) and applied tapering percentage brightenings to them in the regions chosen above. We found that percent-age increases in gray scale value of 3.5, 2.5, 1.5 and 1.0 percent, applied over the inner disc and three outer annuli of diameters 375, 700, 1000 and 1250 µm, respectively, provided essentially complete pattern corrections for some images, partial corrections for some images, but overcorrections (pattern reversal) in none. We therefore chose to fix these percentages and regions as a conserva-tive (unlikely to overcorrect) luteal pigment correction if luteal pigment was present. The option to scale these per-centages up or down in a given image was still available, but we chose not to exercise this option in the present study.
The first step in the semi-automated method was therefore to apply the above correction to the green channel of the standardized image if luteal pigment was present. We then proceeded directly to the next step, interactive background leveling.
Step 2. Semi-automated method: interactive background leveling Each iteration in this step is an additive correction, as will be described. This step was applied to the entire macular area, including the central luteal area. Hence, if the multi-plicative Step 1 did not entirely level the background cen-trally, the leveling was completed additively in Step 2.
Since we were dealing with photography, not photometry, the choice of multiplicative or additive correction at-tempted to preserve semi-quantitative relationships of re-flectance rather than absolute levels or precise numerical relationships [31]. Further, since reflectance variability was at issue, rather than absolute levels, we considered only the most variable components: the macular luteal pigment, dealt with above, the nerve fiber layer [32–35], and the RPE melanin [36]. The RPE melanin is denser in the fovea, and as such will reduce the reflectance of under-lying drusen in much the same manner as the luteal pig-ment. However, the change in density from central to eccentric locations is not nearly so marked as that of the luteal pigment, and we did not include any further correc-tion for this absorber.
In the case of the retinal nerve fiber layer (RNFL), we lied on the quantitative measurements of its spectral re-flectance by Knighton [32]. The highest spectral reflectance is for blue light (460 nm), dropping off to per-haps 2/3 of this for green (510 nm). The reflectance spec-trum has essentially the same shape at varying points along an arcuate nerve fiber bundle, but decreases almost linearly in magnitude with distance from the disc. The au-thors noted that this parallels the decline in thickness seen histologically [33–35], and hypothesized that the reflect-ance spectrum of the RNFL is proportional to its thickness. This hypothesis applied to the macular area implies that RNFL reflectance will be minimum centrally and will in-crease with its thickness to the arcades, which agrees with clinical observation and with our measurements of nor-mal macular reflectance patterns [26]. Also, since the RNFL is transparent, with transmission on the order of 99% for visible light [31], its reflectance essentially adds to the apparent reflectance of underlying structures. This holds because if rN and rS are the reflectances of the RNFL and the subjacent structures, respectively, and tN is the transmission of the RNFL, then the net reflectance of the retina (both layers combined) will be:
rR = tN2 r S + rN
In this case tN is nearly unity, hence RNFL reflectance is additive to underlying structures such as drusen. For this reason, an additive correction was chosen to complete the background leveling.
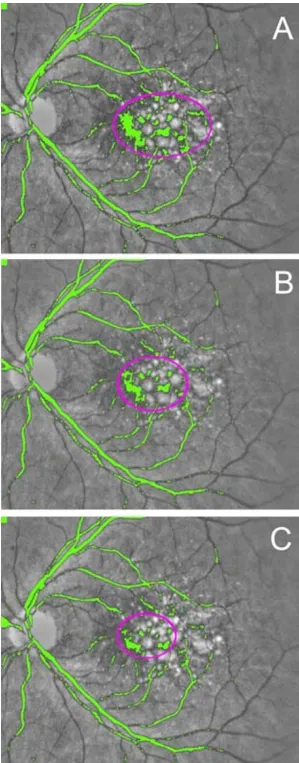
The interactive steps in the additive correction proceed as follows. The user is presented with a pseudo-color topo-graphic map, which highlights those areas in the image whose background lies between the foveal minimum and the higher levels toward the arcades. In Figure 1, the green channel is presented in gray scale. The color green is the pseudo-color representing those pixels whose value is within a given range of the foveal minimum, i.e., the low-est background sources. The user then draws on a graphic tablet (Intuos, Wacom Corp., Vancouver, WA) an ellipse chosen to be just large enough to enclose the background of the given pseudo-color (Fig 1A, magenta ellipse sur-rounding the green areas of low background). Non-back-ground dark sources (e.g., pigment, retinal vessels) are ignored. The gray scale value of each pixel in the selected region (background, drusen and all else) within the el-lipse is then raised two units, and the process repeated (Fig 1B,1C). Since each step is deliberately chosen to be only a partial correction, several iterations are performed on the resulting image until there are no more back-ground sources below this threshold. This partial correc-tion per step was chosen as a reasonable way to force a smoother result, since each iteration uses a new set of ovals with boundary discontinuities limited to two units. In our experience, these are indiscernible in the final re-sult. A higher range of background is then tested, and again the background areas beneath this minimum are step-wise increased. The process terminates when all back-ground has been increased to the higher levels at the ar-cades, which are the highest macular background levels [26].
Step 3. Semi-automated method: choice of threshold
Method reproducibility and validation
Drusen area in each of the 12 digital images was measured in both the central and middle subfields by two independ-ent graders (RTS and JKC) using the semi-automated method. Means and standard deviations were calculated. The first grader (RTS) also regraded the images in random order several weeks later, and the means and standard de-viations of his gradings were calculated. An experienced retinal specialist (Grader 1, CCWK) graded the corre-sponding 12 stereo slide pairs independently, estimating drusen areas as a percent of the central and middle sub-fields in categories of 0 to 10%, 10 to 25%, 25 to 50%, and greater than 50%, as specified by the International Classification System [1]. This method of stereo pair grad-ing is known to and accepted by clinicians as the "gold standard" for quantification of macular pathology. An-other experienced retinal specialist (Grader 2, IB) also graded the corresponding 12 stereo slide pairs independ-ently, but was asked to further refine her gold standard es-timates of drusen areas as a percent of the central and middle subfields to the closest 5%. For example, if she first estimated drusen area to fall between 10 and 25%, then she was asked to assign an estimate of 10, 15, 20 or 25%. For areas less than 10%, an attempt was made to grade to the nearest 1%.
Results and Discussion
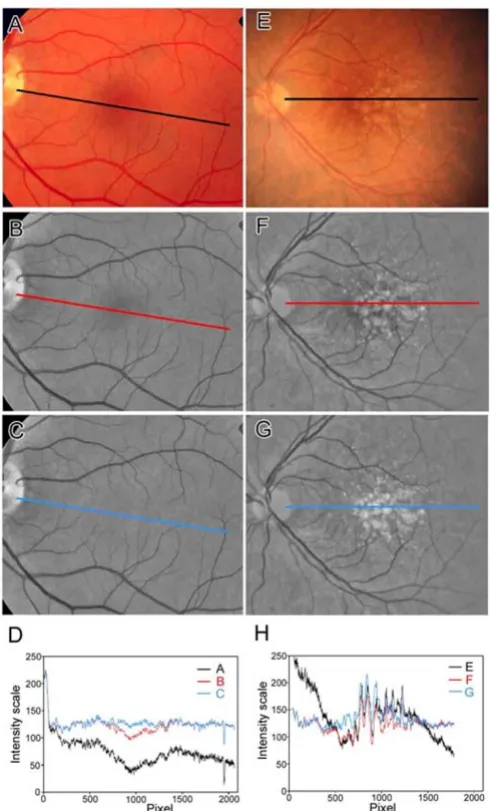
As proof of principle, we first demonstrated that the inter-active procedure was effective in eliminating the concen-tric shading pattern in both a normal image (Figure 2A,2B,2C,2D) and a drusen-containing image (Figure 2E,2F,2G,2H). Line scans through the centers of these im-ages (Figure 2C,2D,2G,2H) show the leveling of the cen-tral valleys in reflectance present in the originals. Since the technique raised the brightness of associated drusen along with the background, it provided a closer approximation to the underlying or true reflectance of the drusen. It was then possible to apply uniform thresholds in the central and middle subfields to define drusen boundaries (Figure 2A,2B,2C), and to create a binary image (Figure 3D) for further morphometric analysis.
Another application of this method to a drusen image is seen in Fig 4. The first frame is the standardized color im-age, which then was contrast-enhanced in Photoshop for ease of drusen visualization (middle frame). The last frame is the final drusen segmentation after leveling the macular background. As in Fig 3, minor errors are present, but no significant bias between quadrants or between cen-tral and middle subfields is observed. We found similar scattered errors in all images tested, but overall good qual-itative agreement with the human graders.
Testing of the digital method showed good inter-observer reproducibility in two independent measurements of 24
Figure 1
Figure 2
Figure 3
Drusen segmentation in central and middle subfields. The background-leveled drusen image from Fig 2 is shown in higher magnification. Drusen are identified by single thresh-old operations, respectively, in the central subfield (A), mid-dle annular subfield (B), and combined regions (C), with the bit-mapped version (D) of segmentation (C) shown as being suitable for quantitative morphometric analysis.
Figure 4
subfields (two subfields each from 12 images). The means of the two measurements had standard deviations ranging from 0.2% to 21.4%. Despite the large outlier, these standard deviations were less than 5% in 20 of 24 cases, and the median was 1.9%. This reproducibility compared favorably with that of standard methods [8]. There was one large deviation in the central subfield of Patient 6 (see Bar graph, Fig 5B). In this case, the photograph was of bor-derline quality due to cataract, and a large pale area within the central subfield was digitally segmented as drusen by one observer (JKC) and left out by the other observer (RTS). The clinical graders were also divided in their opin-ions as to whether this lesion was a druse or retinal pig-ment epithelium (RPE) hypopigpig-mentation.
Intra-observer reproducibility of the digital method was tested by means of two temporally separated measure-ments by one observer. The mean measuremeasure-ments had a median standard deviation of 1.8% (range, 0% to 4.4%). These standard deviations were less than 5% in 22 of 24 cases. Overall, agreement was slightly better than for the inter-observer measurements, but not in every case. On re-view, intra-observer disagreements appeared to be more due to the subjective choice of threshold for final segmentation rather than to disparities in the final back-ground-leveled image to which the threshold was applied.
For method validation, we then compared the results of the semi-automated digital method (24 fields from 12 slides) with the clinically accepted gold standard of expert stereo gradings of the same 24 fields from the 12 corre-sponding stereo pairs of slides. Comparison of the mean digital area measurements to the categories obtained by stereo Grader 1, who used the International Classification, showed 92 % agreement (22/24 digital measurements fell into the range in the International Classification chosen by Grader 1). The two disagreements were both in the middle subfield (digital measurement 41%, Grader 1 cat-egory greater than 50%; digital 7.3%, Grader I, 10 to 25%).
The mean digital area measurements were then compared to the more precise estimates of stereo Grader 2 (Bar graphs, Fig 5 and see Table 1.xls). The 95% limits of agree-ment [37] between the mean digital area measureagree-ments and this second set of stereo gradings were -6.4 % to +6.8 % in the central subfield and -6.0 % to +4.5 % in the mid-dle subfield. The mean absolute differences between the digital and stereo gradings were 2.8 +/- 3.4 % in the cen-tral subfield and 2.2 +/- 2.7% in the middle subfield. Comparison with stereo grader 2 thus showed excellent agreement overall, with better agreement in the middle subfield (3000 micron diameter annulus) than in the cen-tral subfield (1000 micron diameter circle), as evidenced by the smaller absolute differences. The reason was that
inclusion or exclusion of any single lesion in the smaller region had a proportionally larger effect on the measure-ment. With the exception of one measurement in the cen-tral subfield (Patient 11), the mean digital measurements were all within 5% of those of stereo Grader 2 (see Bar graph, Fig 5C). The measurements were often closer for those images with scanty drusen (<10%) in which Grader 2 made estimates to within 1%, but these findings were not statistically significant.
The above examples with larger errors illustrate the impor-tant point that both our method and the current standard of manual stereo grading are subjective, and occasional large disagreements may occur with either method. In our method, the subjective steps include: whether or not to make a luteal pigment correction; the exact placement of the ovals at each step of the interactive procedure; and the final choice of threshold for segmentation in each field. The manual stereo grading method is entirely sub-jective. Furthermore, while our procedure is logically based on a semi-quantitative geometric study of macular reflectance [26], there are photographic nonlinearities in each step that are incorporated only qualitatively. Hence, the procedure itself can be evaluated quantitatively only as to the validity of its outcome in comparison to the subjective current standard of stereo slide viewing at a light box.
A limitation of the present method is that introduction of substantial other pathologies besides drusen might con-found our techniques, whereas a trained human observer makes such distinctions quickly. For example, areas of RPE hypopigmentation or frank geographic atrophy with higher reflectance in the green channel could be included in the drusen threshold. These would have to be removed manually or by additional software relying on other fea-tures. Image quality can also make the differentiation of drusen and RPE abnormalities difficult by any method. Another source of variability not encountered in this study of Caucasians could include racial pigmentation. However, we had found that the macular reflectance pat-terns in standardized images from normal subjects from other races were the same as those of Caucasians [26]. Hence no new difficulty would be anticipated in drusen segmentation in these populations.
Figure 5
process is to some extent self-correcting. That is, if a dark region of pixels were missed by one oval for brightening, they would still be "too dark" in the next iteration and should be picked up there. Hence, errors of this kind in the final result tend to be limited to that of a single itera-tion (two gray scale units). In practice, a) errors of oppos-ing signs in different sections will tend to cancel out around the mean error, and b) the mean error will tend to-wards zero when the optimum threshold is chosen by the user to give the best subjective segmentation overall (i.e., if the image on average is too bright, the user will tend to use a higher threshold). This probably explains why our semi-automated results give close agreement in total area to the gold standard estimates. However, there may still be sections of an image in which the semi-automated seg-mentation is incorrect by wider margins. This means that if it is important to have the greatest precision in a partic-ular subregion other than the standard subfields, a specif-ic threshold for this region should be chosen separately. As noted above, however, we did not find any systematic errors of segmentation with respect to quadrants or subregions.
The luteal pigment correction, which was determined em-pirically, could similarly affect central macular drusen seg-mentation. Luteal pigment density of course varies in density and distribution between individuals, especially in AMD, and in this study we allowed only two options: apply the fixed correction in a given image, or not. As not-ed in the Methods, we usnot-ed data on several normal sub-jects to aim deliberately for under-correction in this step, hence maintaining reflectance pattern concentricity. Fur-ther corrections could then be applied in the next steps, it-erative background leveling. As it happened in this study,
both observers thought that luteal pigment was present and thus applied the fixed correction in every case. As not-ed in the Methods, however, this correction is scalable. By the same reasoning as above, if it were desired to have the most precise segmentation of central macular drusen, the luteal correction scale could be optimized. Ideally, direct measurement of luteal pigment density by an independent method could have been incorporated. We did not pursue this here since central subfield segmenta-tion appeared adequate.
The utility of a method is also a function of the human ef-fort, i.e., time, required to evaluate a given image. The semi-automated method required, after training, about ten minutes of observer time (negligible computer time) per slide to complete drusen segmentation. Manual place-ment of ellipses followed by subjective decisions regard-ing final threshold choice was the most time consumregard-ing. We estimated that full automation of the background-lev-eling steps associated with ellipse placements, etc. would reduce operator time to about five minutes in total. Grad-er 2 required approximately ten minutes for the more pre-cise gradings in two fields. Grader 1, highly experienced, needed about five minutes to grade by the International Classification System.
Conclusions
Quantification of drusen is essential to the study of age re-lated macular degeneration. Current techniques are rela-tively imprecise, subjective, and labor intensive. By applying our findings with respect to macular reflectance patterns we have developed a reproducible, validated semi-automated method for leveling the macular back-ground and segmenting drusen by a uniform threshold. At
Table 1: Semi-automated vs. stereographic manual drusen measurements. Measurements of drusen in the middle and central subfields were performed on twelve patients with AMD. Area measurements were made using the digital method by two independent graders (RTS and JKC). The means and standard deviations are displayed for the middle and central subfields. Similarly, stereo grader 2 (IB) estimated the percentage of drusen in the middle and central subfields using the original fundus photographs as stereographic pairs.
Semi-automated drusen measurements (%) Manual drusen measurements (%)
ID # Middle Subfield std Central Subfield std Middle Subfield Central Subfield
1 7.3350 0.4455 12.3450 6.4135 10 15
2 14.2600 3.3517 8.4750 4.7588 10 5
3 1.4550 0.1626 0.0000 0.0000 0 5
4 0.0000 0.0000 0.3400 0.4808 1 0
5 6.1600 0.7354 7.3350 1.9587 5 10
6 28.3700 4.8790 19.3550 21.4324 30 15
7 0.0000 0.0000 0.0000 0.0000 3 3
8 4.4550 1.5910 10.9500 1.9092 7 10
9 36.3100 8.5136 39.5600 1.7395 35 35
10 55.5350 3.7265 51.4350 1.2233 60 50
11 8.5500 0.3536 32.1550 3.3163 10 45
the present level of automation, this method can give drusen measurements at a higher level of precision (+/-5%) than the widely used International Classification Sys-tem, with a tradeoff of longer operator time until back-ground leveling can be fully automated. The choice of a final threshold is still subjective, but its global application enforces some degree of objectivity as well.
Treating the macular background as a whole is a signifi-cant conceptual advance over previous methods, which rely on multiple local thresholds. Differentiation of drusen from RPE hypopigmentation, however, is still a limitation for both our method and previous methods in dealing with more complex images. The main practical advantage to our technique is that in leveling the macular background, the same correction is smoothly and simul-taneously applied to the drusen embedded within the im-age, with the dimmer central ones being brightened or enhanced. There is still intrinsic variability in terms of the true reflectance of drusen, but the variability in back-ground reflectance is largely eliminated. The result is in-creased precision and objectivity in drusen measurement.
Authors' contributions
RTS with the assistance of all the co-authors developed the digital drusen measurement method and wrote the paper.
TN contributed image analysis and software expertise in method development.
JRS provided cell biology expertise concerning the reflec-tors and absorbers in the macula.
IB and CCWK provided clinical expertise in method devel-opment, selected the clinical slides for testing the method and made independent drusen measurements by stereo pair grading for method validation.
JKC independently applied the digital measurement method to test reproducibility and did statistical analysis.
All authors read and approved the final manuscript.
Acknowledgements
The authors wish to thank Prof. Robert Knighton for reviewing an earlier version of the manuscript.
References
1. Bird AC, Bressler NM, Bressler SB, Chisholm IH, Coscas G, Davis MD, de Jong PT, Klaver CC, Klein BE and Klein R An international classification and grading system for age-related maculopathy and age-related macular degenerationSurvey Ophthalmol 1995, 39:367-374
2. Klein R, Davis MD, Magli YL, Segal P, Klein BE and Hubbard L The Wisconsin age-related maculopathy grading system Ophthal-mology 1991, 98:1128-1134
3. Klaver CC, Wolfs RC, Vingerling JR, Hofman A and de Jong PT Age-specific prevalence and causes of blindness and visual
impair-ment in an older population: the Rotterdam Study Arch Ophthalmol 1998, 116:653-658
4. Smiddy WE and Fine SL Prognosis of patients with bilateral macular drusenOphthalmology 1984, 91:271-277
5. Bressler SB, Maguire MG, Bressler NM and Fine SL Relationship of drusen and abnormalities of the retinal pigment epithelium to the prognosis of neovascular macular degeneration. The Macular Photocoagulation Study GroupArch Ophthalmol 1990,
108:1442-1447
6. Bressler NM, Bressler SB, Seddon JM, Gragoudas ES and Jacobson LP
Drusen characteristics in patients with exudative versus non-exudative age-related macular degenerationRetina 1988,
8:109-114
7. Holz FG, Wolfensberger TJ, Piguet B, Gross-Jendroska M, Wells JA, Minassian DC, Chisholm IH and Bird AC Bilateral macular drusen in age-related macular degeneration. Prognosis and risk factorsOphthalmology 1994, 101:1522-1528
8. Abdelsalam A, Del Priore L and Zarbin MA Drusen in age-related macular degeneration: pathogenesis, natural course, and la-ser photocoagulation-induced regression Survey Ophthalmol 1999, 44:1-29
9. Little HL, Showman JM and Brown BW effect of laser photocoag-ulation of confluent soft macular drusenOphthalmology 1997,
104:623-631
10. Frennesson IC and Nilsson SE Effects of argon (green) laser treatment of soft drusen in early age-related maculopathy: a 6 month prospective studyBr J Ophthalmol 1995, 79:905-909 11. Bressler NM, Munoz B, Maguire MG, Vitale SE, Schein OD, Taylor HR
and West SK Five-year incidence and disappearance of drusen and retinal pigment epithelial abnormalities. Waterman studyArch Ophthalmol 1995, 113:301-308
12. Bressler SB, Bressler NM, Seddon JM, Gragoudas ES and Jacobson LP
Interobserver and intraobserver reliability in the clinical classification of drusenRetina 1988, 8:102-108
13. Figueroa MS, Regueras A and Bertrand J Laser photocoagulation to treat macular soft drusen in age-related macular degenerationRetina 1994, 14:391-396
14. Figueroa MS, Regueras A, Bertrand J, Aparicio MJ and Manrique MG
Laser photocoagulation for macular soft drusen. Updated resultsRetina 1997, 17:378-384
15. Sigelman J Macular drusen resorption one year after perimac-ular laser photocoagulationOphthalmology 1991, 98:1379-1383 16. The Choroidal Neovascularization Prevention Trial Research Group
Laser treatment in eyes with large drusen. Short-term ef-fects seen in a pilot randomized clinical trialOphthalmology 1998, 105:11-23
17. Shin DS, Javornik NB and Berger JW Computer-assisted, interac-tive fundus image processing for macular drusen quantitationOphthalmology 1999, 106:1119-1125
18. Rapantzikos K, Zervakis M and Balas K Detection and segmenta-tion of drusen deposits on human retina: Potential in the diagnosis of age-related macular degeneration Med Image Analysis 2003, 7:95-108
19. Leistritz L and Schweitzer D Automated detection and quantifi-cation of exudates in retinal imagesSPIE 1994, 2298:690-696 20. Schweitzer D, Kalve B, Leistritz L, Wagner M and Hammer M
Exper-imental results with a wavelength-tunable scanning laser La-sers and Light 1998, 8:143-152
21. Sebag M, Peli E and Lahav M Image analysis of changes in drusen areaActa Ophthalmol 1991, 69:603-610
22. Morgan WH, Cooper RL, Constable IJ and Eikelboom RH Automat-ed extraction and quantification of macular drusen from fun-dal photographsAus New Zeal J Ophthalmol 1994, 22:7-12 23. Kirkpatrick JN, Spencer T, Manivannan A, Sharp PF and Forrester JV
Quantitative image analysis of macular drusen from fundus photographs and scanning laser ophthalmoscope imagesEye 1995, 9:48-55
24. Goldbaum MH, Katz NP, Nelson MR and Haff LR The discrimina-tion of similarly colored objects in computer images of the ocular fundusInvest Ophthalmol Vis Sci 1990, 31:617-623
25. Peli E and Lahav M Drusen measurement from fundus photo-graphs using computer image analysis Ophthalmology 1986,
93:1575-1580
26. Smith RT, Nagasaki TJ, Sparrow T and Koniarek J The Fine Struc-ture of Macular Images [abstract]Invest Ophthalmol Vis Sci 2001,
Publish with BioMed Central and every scientist can read your work free of charge
"BioMed Central will be the most significant development for disseminating the results of biomedical researc h in our lifetime."
Sir Paul Nurse, Cancer Research UK
Your research papers will be:
available free of charge to the entire biomedical community
peer reviewed and published immediately upon acceptance
cited in PubMed and archived on PubMed Central
yours — you keep the copyright
Submit your manuscript here:
http://www.biomedcentral.com/info/publishing_adv.asp
BioMedcentral 27. Smith RT, Barbazetto I, Barile G and Allikmets R A Digital Reading
Center for Fundus Photographs of the Columbia Macular Genetics Study [abstract] Invest Ophthalmol Vis Sci 2002,
43(12):E-Abstract 2507[http://www.iovs.org]
28. Russ JC Correcting image defects In: The image processing handbook(Edited by: Fourth) Boca Raton, CRC Press 2002, 131-206 29. Bone RA, Landrum JT and Cains A Optical density spectra of the
macular pigment in vivo and in vitroVision Res 1992, 32:105-110 30. Snodderly DM, Auran JD and Delori FC The macular pigment. II. Spatial distribution in primate retinasInvest Ophthalmol Vis Sci 1984, 25:674-685
31. van de Kraats J, Berendschot TT and van Norren D The pathways of light measured in fundus reflectometry Vision Res 1996,
36:2229-2247
32. Knighton RW, Jacobson SG and Kemp CM The spectral reflect-ance of the nerve fiber layer of the macaque retinaInvest Oph-thalmol Vis Sci 1989, 30:2392-2402
33. Ogden TE Nerve fiber layer of the primate retina: thickness and glial contentVision Res 1983, 23:581-587
34. Ogden TE Nerve fiber layer of the primate retina: morpho-metric analysisInvest Ophthalmol Vis Sci 1984, 25:19-29
35. Radius RL Thickness of the retinal nerve fiber layer in primate eyesArch Ophthalmol 1980, 98:1625-1629
36. Weiter JJ, Delori FC, Wing GL and Fitch KA Retinal pigment epi-thelial lipofuscin and melanin and choroidal melanin in hu-man eyesInvest Ophthalmol Vis Sci 1986, 27:145-152