Synthesis of Carbon Spheres of Controlled Size by Hydrothermal Method
S. Feshkia,M. Marandi a,*a
Physics department, Faculty of Science, Arak University, Arak, Iran.
Abstract
Carbon Spheres were fabricated by hydrothermal method and their
structural properties were investigated. Carbon Spheres with average
sizes around of 230, 320 and 430 nm were synthesized in different concentration of glucose aqueous solution and different
hydrothermal reaction time. The temperature of 180 °C by a
hydrothermal reaction was fixed in all of glucose concentration and hydrothermal reaction time. The result showed that the spherical
shape of Carbon Spheres was formed in the special concentration of
glucose aqueous solution and hydrothermal reaction time.The product obtained was characterized by X-ray diffraction(XRD);
Fourier transforms infrared (FTIR) spectra, which have inferred the Carbonic nature of the product. Further,SEM images have revealed
the spheres having quite spherical morphology.
2014 JNS All rights reserved
Article history:
Received 3/7/2014 Accepted 9/8/2014 Published online 1/9/2014
Keywords:
Hydrothermalmethod Glucose
Carbon Spheres Diameter
*Corresponding author:
E-mail address:
[email protected] Phone: +98 86 341 73 318 Fax: +98 86 341 73 406
1. Introduction
Carbonic materialsareone of the most important
functional materials due totheir unique electromagnetic, thermo dynamical and mechanical
properties [1]. These materials exhibit potential applications in many areas such as drug delivery,
hydrogen storage, junction devices, and sensors[2,
3]. Many trials have been made for the synthesis of
nanoparticles with controllable structure and size. Spherical nanoparticles are very commonly
generated due to the minimum surface energy compared to other structures (e.g., films, tubes,
rods)[4]. Recently, Carbon Spheres (CSs) have
attracted a great interest owning to their unique
properties, their potential applications including high-density and high-strength carbon artifacts
lithium storing materials [5-8], sacrificial template to prepare hollow structures(e.g., TiO2 hollow
spheres) [9-16], catalyst support material in
methanol electro-oxidation [17], good mechanical
stability, chemical inertness, porous nature with large pore volume, and coating material in
core/shell structure [7,18, and 19]. An important insight gained by the discovery of carbon
nanostructures is that the carbon atoms can form
combination of these two basic structural units
with the hexagonal carbon rings can form a variety
of morphologies.
The functional properties of nanoparticles are heavily dependent on their shapes, sizes, and size
distribution. Various methods can be used to fabricate of carbon spheres, such as chemical vapor
deposition [21], arc plasma technique, templating
method [22], pyrolysis carbon sources [23], and
hydrothermal method. Some of the methods require complicated equipment and strict
experimental condition. Among them, the hydrothermal method is widely used for synthesis
of carbonic materials [24]. In this method the
closed system, characterized by low temperature
growth and a suitable atmosphere to produce oxidizing or reducing conditions is an excellent
approach to produce carbon polymorphs. Thus, hydrothermal technique allows the synthesis of
phases, which cannot be stabilized by any other
method at such low pressure-temperatures. This general approach provides an efficient, scalable
route to synthesize spherical, porous carbon
particles with porous structure and is suitable for large scale manufacturing. Moreover, the Carbon
Spheres produced by the hydrothermal approach
have a hydrophilic surface covered with C–OH groups, which are available for further surface
functional modification, as well as the Carbon
Spheres can be easily removed by oxidation at high temperature or by dissolving via enzyme in
solution. Nowadays, mesoporous carbon particles
with rod, fiber, plate, and donut-like morphologies
were prepared by using mesoporous silica
templates. Therefore, many studies focused on the
synthesis of carbon spheres via the hydrothermal
approach.
Despite some successes, limitations still exist in
generating monodispersed Carbon Spheres. This is because it is difficult to control or adjust the
concentration of the precursor in a sealed system,
which will affect the nucleation and growth, and
hence the morphology and size of Carbon Spheres. Therefore, to develop a simple and efficient
method to prepare monodispersed Carbon Spheres is still challenging [1, 22, and 25].
In this research, we report the synthesis of
Carbon Spheres of controlled size by a
hydrothermal method. The average size of Carbon Spheres was around230, 320 and 430 nm for
different glucose concentration and different hydrothermal reaction time. The glucose
concentration was selected as 0.5 M, 1.0 M and 1.5
M. The hydrothermal reaction time wasseton 3 h, 8 h and 16 h. However, the spherical structures were
found for special glucose concentration and
hydrothermal reaction time. The particle characteristics (shape, size, distribution) are then
characterized by using various techniques,
including scanning electron microscopy (SEM),FTIR spectrum analysis, and X-ray
diffraction.
2. Experimental procedure
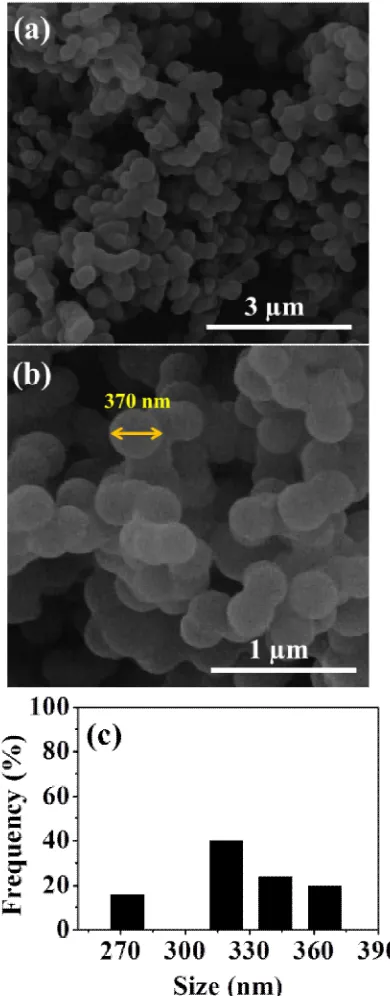
Fig.1.SEM images of Carbon Spheres prepared with glucose concentration of 0.5 M in 3 µm scale (a), 1 µm scale (b) and histogram of size of them (c).
Carbon spheres with different sizes were
synthesized by a hydrothermal method. Briefly 25
ml of an aqueous solution of glucose with different
concentrations of 0.5 M, 1 M and 1.5 M was prepared. Then it was transferred to a 100 ml
Teflon-lined stainless steel autoclave and sealed and maintained at 180 ºC for 3 h, 8 h and 16 h.
The dark brown precipitate was centrifuged at
2000 rpm for 10 min and washed with ethanol and
DI water for four times. Finally the carbon spheres were dried at 70 ºC for 4 h.
2.2. Characterization
The morphology and size of the Carbon Spheres
were checked using scanning electron microscope (T-Scan System). To prepare the SEM sample, a
drop of the diluted suspension was placed on a
glass slide and then it was coated with gold prior to examination. The average particle size was
estimated based on the SEM image. FTIR spectrum (Perkin Elmer, Spectrum one NTS) was used to
identify the functional groups. The X-ray
diffraction pattern was also recorded with Cu Kα
radiation by a Philips Xpert-pro system.
3. Results and discussion
Carbon Spheres with different sizes synthesized by hydrothermal method in different concentration
of glucose aqueous solution and hydrothermal
reaction times. The fine and spherical shape of them formed in special concentration of glucose
aqueous solution and hydrothermal reaction
times.Fig. 1 demonstrated the SEM images of the Carbon Spheres prepared at 0.5 M concentration of
the glucose aqueous solution and with the
hydrothermal time 8 h. It could be seen that the average size of Carbon Spheres is about 230 nm.
Spheres is shown in the Fig. 1c too.
In the hydrothermal time 3 h, these structures
didn't form, because at this time the powder of
Carbon Spheres has not received. By increasing the glucose concentration to 1 M and 1.5 M, the power
of Carbon Spheres didn't preserved. So this time isn't good for hydrothermal reaction in all of
glucose concentrations and this time was omitted.
In the hydrothermal time 16 h, these structures
didn't form, because at this time the product of autoclave were burnt especially in 1.5 M glucose
concentration. So this time was so long for hydrothermal reaction in all of glucose
concentrations and this time was omitted too.
Fig. 2 demonstrated the SEM images of the
CarbonSpheres prepared at 1 M concentration of the glucose aqueous solution and with the
hydrothermal time 8 h. According to size distribution of them (Fig. 2c), it could be seen that
the most of Carbon Spheres size is around 320 nm.
In this case, when the glucose concentration increased the average size of these spherical
structures was increased.
The morphology and structure of the samples were also investigated by SEM images. The
Carbon Spheres have been prepared in 1.5 M
glucose concentration, shown in Fig. 3. In these images, the spherical Carbon structures are quit
spherical with 435 nm diameter. Also the size
distribution histogram of the Carbon Spheres is shown in the Fig. 3c. According to it, the most of
the Carbon Spheres diameter is approximately 435
nm.
Fig.3.SEM images of Carbon Spheres prepared with glucose concentration of 1.5 M in 3 µm scale (a), 1 µm scale (b) and histogram of size of them (c).
Fig.4. Effect of glucose concentration to diameter of Carbon Spheres.
When the glucose concentration was increased,
the diameter of resulting Carbon spheres was
increased. In addition, a graph of the average
diameter of Carbon Spheres and the glucose concentration aqueous solution were liner (Fig. 4).
Therefore, the diameter of the carbon sphere can be easily controlled by adjusting the concentration of
the glucose solution.
There are numerous works on the chemical
transformations that take place when glucose is treated under pressure in sub- or supercritical water
in the literature [26]. From this information it is
possible to reconstruct the mechanism of the formation of hydrochar products from glucose.
This is schematically illustrated in Fig. 5. The final
product of this hydrothermal approach is the Carbon Spheres with hydrophobic core and
hydrophilic sell. This schematic is showing in Fig.
5.This is so useful for using of Carbon Spheres as template because hydrophilic shell cause to easy
dispersion of them to ethanol and water. Then
thissolution makes a good place for two dimension growth of nano structures on the surface of them.
We also used the X-ray diffraction (XRD) to
examine the phase of Carbon Spheres and found that the sample is amorphous (Fig. 6). Two peaks
Fig.5. A schematic of Carbon Spheres prepared with glucose.
Fig.6. TheX-ray diffraction pattern (XRD) of the
Carbon Spheres with around 320 nm diameter.
Fig.7. TheFT-IRspectrum of the Carbon Spheres
with around 320 nm diameter.
Spheres with around 320 nm diameters. These two
broad peaks are assigned to (002) and (101) planes
of carbon materials.
The chemical transformations that occur when
the glucose is converted into carbonaceous products by means of hydrothermal
carbonization.An FTIR spectrum of Carbon
spheres with around 320 nm diameter is shown in
Fig. 7. It can be seen that the FTIR spectra of the sample contain several bands which reveal that
aromatization processes take place during hydrothermal carbonization. The presence of
aromatic rings is also evidenced by the band at
1620 cm-1, attributed to C=C vibrations [27,32], and to the bands in the 875–750 cm-1 region,
assigned to aromatic C-H out-of-plane bending
vibrations [36]. These hydrochar materials also
possess aliphatic structures, as can be deduced from the band at 3000–2815 cm-1, which
corresponds to stretching vibrations of aliphatic
C-H [37,38]. Moreover, the presence of oxygen groups is suggested by the bands at: 3000–3700
cm-1 (a wide band attributed to O-H stretching vibrations in hydroxyl or carboxyl groups) [37],
1710 cm-1 (C=O vibrations corresponding to
carbonyl, Quinone, ester or carboxyl) [35] and
1000–1460 cm-1 (C-O stretching vibrations in hydroxyl, ester or ether and O-H bending
vibrations) [35]. The decrease (in relation to raw
cellulose) in the intensity of the bands at 1000– 1460 cm-1 and the broad band at 3000–3700 cm-1
suggest that dehydration occurred during the
hydrothermal carbonization of the glucose.
References
[1] A. Ramaprabhu, Nanoscale Res. Lett.76
(2008)145-151.
[2]Z. Dong, B. Yang, J. Jin, J. Li, H. Kang, X. Zhong,
R. Li, J. Ma, Nanoscale Res. Lett. 4 (2009)335.
[4] Q. Wang, H. Li, L. Chen, X. Huang, Carbon 39
(2001)2211-2214.
[5] Z. Wen, Q. Wang, Q. Zhang, J. Li,
Electrochem. Commun. 9 (2007)1867-1872. [6] Z. Yi, Y. Liang, X. Lei, C. Wang, J. Sun,
Mater. Lett. 61 (2007)4199-4203.
[7] Z. Wang, W. Tian, X. Liu, R. Yang, X. Li, J.
Solid State Chem. 180(2008)3360-3365.
[8] Q. Wang, H. Li, L. Chen, X. Huang, Solid
State Ion. 43 (2002)152–153.
[9] X. Li, T. Lou, X. Sun, Y. Li, Inorg. Chem. 43
(2004)5442-5449.
[10] X. Sun, Y. Li, Angew. Chem. Int. Ed. 43
(2004)3827-3831.
[11] W. Shen, Y. Zhu, X. Dong, J. Gu, J. Shi,
Chem. Lett. 34(2005)840-841.
[12] X. Sun, J. Liu, Y. Li, Chem. Eur. J.
12(2006)2039-2047.
[13] M. Titirici, M. Antonietti, A. Thomas, Chem.
Mater. 18(2006)3808-3812.
[14] R. Yang, H. Li, X. Qiu, L. Chen, Chem. Eru. J. 12 (2006)4083-4090.
[15] M. Zheng, J. Cao, X. Chang, J. Wang, J. Liu,
X. Ma, Mater. Lett.60(2006)2991-2993.
[16] Y. Liu, Y. Chu, Y. Zhuo, L. Dong, L. Li, M.
Li, Adv. Funct.Mater. 17(2007)933-938.
[17] J.Joo, Y. Kim, W. Kim, P. Kim, J. Yi, Catal. Commun. 10 (2008)267.
[18] X. Sun, Y. Li, Angew. Chem. Int. Ed. 43
(2004)597-601.
[19] X. Sun, Y. Li, Langmuir 21(2005)6019-6024.
[20]T. Nakamura, Y. Yamada, K. Yano,
Microporous Mesoporous Mater. 117(2009)478-485.
[21] H. Qian, F. Han, B. Zhang, Y. Guo, J. Yue,
BPeng, Carbon 42(2004)761-766.
[22] J.Joo, P. Kim, W. Kim, J. Kim, N. Kim, J. Yi, Curr. Appl. Phys. 8(2008)814-817.
[23] B. Friedel, S. Weber, Small 2(2006)859.
[24] K. Byrappa, T. Adschiri, Prog. Crystallogr.
Growth Ch. 53 (2007)117-166.
[25] Y. Mi, W. Hu, Y. Dan, Y. Liu, Mater. Lett. 62
(2008)1194-1196.
[26]
M. Sevilla, A.B. Fuertes, CARBON. 47
(2009) 2281 –2289.
[27] X. Su, Y. Li,Angew. Chem. Int. Ed. Engl.
43(2004) 597–601.
[28] S. Shaka, T. Ueno, ProgPolym Sci. 6 (1999)
177–191.
[29] O. Bobleter,ProgPolym Sci. 19(1994) 797– 841.
[30] M. Serageldi, W. Pan., ThermochimActa.
76(1984)145–160.
[31] D. Van Krevelen, Fuel. 29 (1950) 269–284.
[32] H. Holgat, J. Meyer, J. Teste,AIChE J. 41
(1995) 637–648.
[33] S. Karago,T.Bhaskar, A. Muto,
Y.Sakata,JFuel. 84(2005)875–884.
[34] T. Aid, Y. Sat, M. Watanab, K. Tarim, T.
Nonak, H. Hattor, J Supercrit Fluids.
40(2007)381–388.
[35] B. Kabyemel,T .Adschir, R. Malalua, K. Arai. IndEngChem Res. 38(1999)2888–2895.
[36] A. Lua, T. Yang, J Colloid Interface Sci. 274(2004)594–601.
[37] C. Araujo, F. Ruiz, J. Martı, H. Terrones, J.
MolStruct.THEOCHEM.714(2005)143–146.