DEPARTMENT OF INFORMATION ENGINEERING AND COMPUTER SCIENCE ICT International Doctoral School
Predictive Modeling
of Human Behavior:
Supervised Learning from Telecom Metadata
by
Andrey Bogomolov
Advisor
Prof. Fabio Pianesi,
Fondazione Bruno Kessler, EIT Digital
Industrial Co-Advisor
Michele Caraviello,
Telecom Italia SpA
SUBMITTED IN PARTIAL FULFILLMENT OF THE REQUIREMENTS FOR THE DEGREE OF DOCTOR OF PHILOSOPHY IN COMPUTER SCIENCE
©2014-2017 Andrey Bogomolov. All rights reserved.
Acknowledgements
The work of Andrey Bogomolov is partially supported by Telecom Italia Semantics and Knowledge Innovation Laboratory (SKIL) research grant “T” and EIT Digital Doctoral School grant.
For happiness and stress recognition problems the data was collected us-ing FUNF Open Sensus-ing Framework based on Android Developer API in compliance with the Android Software Development Kit License Agree-ment issued by Google Inc., a Delaware corporation with principal place of business at 1600 Amphitheatre Parkway, Mountain View, CA 94043, United States.
The experiments involving United States individuals or conducted on the territory of United States were set up in full comliance with National Com-mission for the Protection of Human Subjects of Biomedical and Behav-ioral Research regulations concerning basic ethical principles that should underlie the conduct of biomedical and behavioral research involving hu-man subjects and guidelines assuring that such research is conducted in accordance with those principles (“The Common Rule”, 45 CFR pt. 46).
For crime hotspot prediction problem the source data processing, re-ported data transformations and feature selection, which were derived from anonymised and aggregated mobile network dataset, provided by Telef´onica Digital Limited, a corporation existing under the laws of Eng-land, with company number 07884976 and a registered office or regular place of business located at 260 Bath Road, Slough, Berkshire, SL1 4DX, were done during the public competition – “Datathon for Social Good” organized by Telef´onica, The Open Data Institute and the MIT during the Campus Party Europe 2013 at the O2 Arena in London during 2-7 September 2013, in full compliance with the competition rules and legal limitations imposed by the “Terms and Conditions” document.
For energy prediction problem the source data was processed in full com-pliance with the rules of the public competition – Telecom Italia Big Data Challenge 2014.
Abstract
Big data, specifically Telecom Metadata, opens new opportunities for hu-man behavior understanding, applying machine learning and big data processing computational methods combined with interdisciplinary knowl-edge of human behavior.
In this thesis new methods are developed for human behavior predictive modeling based on anonymized telecom metadata on individual level and on large scale group level, which were studied during research projects held in 2012-2016 in collaboration with Telecom Italia, Telefonica Re-search, MIT Media Lab and University of Trento. It is shown that human dynamics patterns could be reliably recognized based on human behavior metrics derived from the mobile phone and cellular network activity (call log, sms log, bluetooth interactions, internet consumption).
On individual level the results are validated on use cases of detecting daily stress and estimating subjective happiness. An original approach is introduced for feature extraction, selection, recognition model train-ing and validation. Experimental results based on ensemble stochastic classification and regression tree models are discussed.
On large group level, following big data for social good challenges, the problem of crime hotspot prediction is formulated and solved. In the pro-posed approach we use demographic information along with human mo-bility characteristics as derived from anonymized and aggregated mobile network data. The models, built on and evaluated against real crime data from London, obtain accuracy of almost 70% when classifying whether a specific area in the city will be a crime hotspot or not in the follow-ing month. Electric energy consumption patterns are correlated with human behavior patterns in highly nonlinear way. Second large scale group behavior prediction result is formulated as predicting next week energy consumption based on human dynamics analysis derived out of the anonymized and aggregated telecom data, processed from GSM net-work call detail records (CDRs). The proposed solution could act on energy producers/distributors as an essential aid to smart meters data for making better decisions in reducing total primary energy consumption by limiting energy production when the demand is not predicted, reduc-ing energy distribution costs by efficient buy-side plannreduc-ing in time and providing insights for peak load planning in geographic space.
Contents
1 Introduction 1
1.1 Motivation - The Problem of Human Behavior Computation . . . 2
1.2 Research Goals . . . 3
1.3 Contribution and Structure . . . 4
1.4 Main Publications List . . . 6
2 Supervised Learning of Individual Characteristics: Affective States 7 2.1 Happiness Recognition from Telecomunications Metadata . . . 8
2.2 Daily Stress Recognition from Mobile Phone Data . . . 24
3 Predictive Modeling of Large Scale Group Behavior 40 3.1 Predicting Crime Hotspots Based on Aggregated Anonymized People Dynamics . . . 41
3.2 Predicting Electric Energy Consumption Using Aggregated Telecom Data . . . 51
4 Summary and Future Work 54 4.1 Computing Human Behavior: The New Kind of Science . . . 55
4.2 Supervised Learning of Individual Characteristics . . . 55
4.3 Supervised Learning of Large Scale Group Behavior . . . 56
4.4 Challenges . . . 57
A Gradient Boosting Implementation
for Stress Recognition Problem 60
B Additional Visualizations
for Energy Consumption Prediction Use Cases 62
List of Figures
1 Recorded Happiness Scores Density . . . 11 2 Within Person and Between-subject Variance for Happiness
Recogni-tion Problem . . . 12 3 Misclassification Error vs Number of Tree Classifiers in Ensemble Model
for Happiness Recognition Problem . . . 18 4 Final Model ROC Curve for Happiness Recognition Problem . . . 23 5 Recorded Daily Stress Scores Histogram . . . 29 6 Within- and Between-Subject Variance for Daily Stress Recognition
Problem . . . 29
7 Sample Visualization of Anonymized Data by Smartsteps Platform . 44 8 Ground Truth of Crime Hotspots . . . 48 9 Predicted by Algorithm Crime Hotspots . . . 48
10 Spatially Mapped Max Energy Consumption vs Telecom Patterns for a Weekday on a SET grid . . . 63 11 Energy Consumption Time Series Decomposition for a Residential Area 64 12 Energy Consumption Time Series Decomposition for a Touristic Area 64 13 Energy Consumption Time Series Decomposition for a City Center and
Industrial Areas . . . 64 14 Spectral Characteristics of Typical Energy Consumption Response
List of Tables
2.1 Recorded Daily Happiness . . . 11 2.2 List of Basic Features for Happiness Recognition Problem . . . 15 2.3 List of Basic Bluetooth Proximity Features for Happiness Recognition
Problem . . . 16 2.4 Top-30 Features for Happiness Recognition . . . 17 2.5 SVM Kernel Functions . . . 17 2.6 10-fold CV Model Comparison for Happiness Recognition Problem:
Accuracy . . . 19 2.7 10-fold CV Model Comparison for Happiness Recognition Problem:
Kappa . . . 20 2.8 10-fold Cross Validation Happiness Recognition Metrics for Each Fold
Comparison . . . 20 2.9 Final Classifier Happiness Recognition Model Confusion Matrix for
Training Set . . . 20 2.10 Final Classifier Happiness Recognition Model Confusion Matrix for
Test Set . . . 21 2.11 Final Classifier Happiness Recognition Model Performance Metrics
Com-parison . . . 21 2.12 Selected Features Ranked by Mean Decrease in Accuracy for Daily
Stress Recognition Problem . . . 28 2.13 List of Basic Features for Daily Stress Recognition Problem . . . 30 2.14 List of Basic Bluetooth Proximity Features for Stress Recognition
Prob-lem . . . 32 2.15 Stress Recognition Model Performance Metrics . . . 36 2.16 10-fold Cross-Validation Metrics for Stress Recognition Problem . . . 36 2.17 Stress Recognition Model Metrics Comparison for Feature Subsets . . 36
3.1 SmartSteps Data Description . . . 44 3.2 Number of Crime Hotspots in January . . . 46 3.3 Crime Hotspots Prediction Top-20 Selected Features Ranked by Mean
Decrease in Accuracy . . . 48 3.4 Crime Hotspots Prediction Problem Metrics Comparison . . . 49 3.5 Mean Daily Consumption Model Metrics for Energy Prediction Problem 53 3.6 Peak Daily Consumption Model Metrics for Energy Prediction Problem 53
Chapter 1
1.1
Motivation - The Problem of Human
Be-havior Computation
Since the beginnings in the 1930s, computation has been primarily approached from the tradition of engineering (which seeks to build practical systems using computa-tions) and mathematics (which seeks to prove theorems about computation). And starting from 1970s, computing has been described as being at the crossroads of mathematical, engineering, and empirical traditions[Denning, 2003].
Recent advancements in artificial intelligence and machine learning open new frontiers for computation, specifically for human behavior understanding on personal and group level, thus fuel up Computational Social Science and
Social physics – the new interdisciplinary fields of science which attract growing academic, government and business interest.
Big data, specifically Telecom Metadata, opens new opportunities for human be-havior understanding, combining machine learning and big data processing compu-tational methods multiplied by the interdisciplinary knowledge of human behavior.
The computer hardware capable for terabyte-scale computing is becoming affordable for mid-sized companies and universities. Cloud computing and hardware virtualization delivers simplicity, availability and scalability at a fraction of the cost. High Performance Computing is shifting from expensive supercomputers and specialized HPC clusters to commodity servers, running as GPU-accelerated and heterogeneous computing.
How human could create companies and government agencies that are efficient, cooperative and creative? These are the questions of social physics, and they are especially important in global competition, environmental challenges, economic and political crises and government failures. The first engine that drives social physics is big data. Specifically, data driven modeling is the second wave of New Kind of Science, exploiting the nature of computation to be explored experimentally. The results of these experiments have great relevance to understanding the world than traditional modelling by mathematical functions or simulation.
In modern science Social physics refers to using big data analysis and the math-ematical laws to understand the behavior of human crowds [George et al., 2014]. The core idea is that data about human activity, such as phone call records, sms records, geo location data from mobile phone, credit card transactions, social net-works and web activity logs, contain mathematical patterns that are characteristic of the way how social interactions evolve in time and space. These mathematical models could serve as a filter for analysis of behavior change and for detecting emerg-ing behavioral patterns for a bunch of filed of science, such as Economics, Finance, Psychology, City Science, Architecture, Law, Public Security, Criminology, Politics, Ecology, Energy Efficiency, Biology, Medicine, etc.
1.2
Research Goals
At the highest level, our goal is to evaluate and improve upon the state-of-the-art scholar results of software-enabled human behavior understanding derived from be-havioral big data. We focus specifically on telecom metadata, since this is obviously cheap and ubiquitous source of behavioral information.
Since we are interested in practical and applied data driven results rather than theoretical solutions, we implement our machine learning algorithms in a state-of-the-art way, featuring the possibility to define and measure the impact of the actual predictive variables in a human interpretable way. For that, deep learning, convolutional neural networks and automated feature autoencoders techniques are out of scope of this research.
We are interested in predicting human behavior, overreaching characterization or
recognition. This approach requires that the response variable that we predict for our use case problems is shifted in the future. Concerning this point, the key research goal is to test, if human behavior could be predicted on historical data and develop appropriate algorithmic methods for solving this type of problems.
Our approach starts with individual behavior recognition and prediction and ex-tends to large scale group behavior prediction.
We explore use cases in affective computing, such as daily happiness and stress recognition, and extend our methodolody and computational approach to crime hotspots prediction and energy consumption prediction based on telecom and multimodal data.
These applications in machine learning are interesting both because they tend to suffer from noise, limited data quality, unpredictable latency during data collection, data privacy limitations, due to the large size of the arrays of source data with wide separation between different data providers, also be-cause the data logging could be not regular and predictable based on internal policies of telecom companies in different countries.
By handling all of these cases, our methodology could cover a significant frac-tion of scientific and engineering limitafrac-tions.
1.3
Contribution and Structure
In this thesis we address several important problems related to the processing and analysis of complex, multi dimentional, structured and semi-structured data.
First, we do algorithmic recognition of individuals’ affective states based on the data collected on their smart phones.
Second, we are the first who formulated and algorithmically solved the problem of predicting crime hot spots from telecom metadata in a city.
Third, we propose new methods for learning the intrinsic relationships between the characteristics given observations (logs) framed as machine learn-ing problems with reduced and highly compactified feature space for energy consumption prediction problem.
Finally, the research effort presented in this thesis provides insight into developing novel signal processing and machine learning techniques for human behavior understanding.
The main scientific contributions of the thesis include the computational algo-rithms for supervised learning of human individual characteristics based on affective computing use cases, such as (1) happiness recognition from telecom metadata, and (2) daily stress recognition from mobile phone data and algorithms for modeling of large scale group behavior, such as (3) predicting crime hotspots based on aggre-gated and anonymized people dynamics, and (4) electric energy consumption using aggregated telecom network data. These contributions include feature engineering, problem formulation using machine learning approach and optmization algorithms development for non-linear classification and regression problems.
Also we show the benefit to the real world applications in social psychology, city science, criminology, energy efficiency and telecommunications.
The outline of this thesis is as follows.
In chapter 1 we summarize motivation for this research, show the nature of the problem of Human Behavior Computation. Next we show the research goals, scientific contribution and thesis structure. Finally, we list the main publications published during this research work.
In chapter 2 we go into details of state-of-the-art literature on affective states recognition, investigate the automatic recognition of people’s happiness and daily stress from three different sets of data, such as people activity, as detected through their smartphones (data pertaining to transitory properties of individuals), weather conditions (data pertaining to transitory properties of the environment); and per-sonality traits (data concerning permanent dispositions of individuals). Taken to-gether, and despite the discussed limitations, our results not only provide evidence that individual happiness and daily stress can be reliably predicted, but they also point to the necessity of considering at the same time people’s transitory proper-ties (smartphone activity), transitory properproper-ties of the environment and information about stable individual characteristics. For the sake of transitory individual proper-ties, mobile phone usage patterns have important advantage over alternative meth-ods: they are less unobtrusive and raise limited privacy problems as compared to, e.g., voice analysis or the exploitation of data from physiological sensors. Moreover, and importantly, automatic stress detection based on mobile phone data can take advantage of the extensive usage and diffusion of these devices, it can be applied in several real world situations and it can be exploited for a variety of applications that are delivered by means of the same mobile device.
for predictive modeling of large scale group behavior, specifically we are (1) predicting crime hotspots based on aggregated anonymized people dynamics and (2) predicting electric energy consumption using aggregated telecom data.
We show that daily average and peak energy consumption prediction metrics by our approach for the next 7 days are much better than the normal time se-ries forecasting baselines used in the industry. Our results prove that human dy-namics, extracted from aggregated and anonymized mobile phone data, are good proxies for modelling crime hostpots and energy consumption. Also we discuss the practical implications for our results.
1.4
Main Publications List
This thesis is a summary of computer science research conducted during 2013-2017 and widely published in the following conference and journal articles:
1. Andrey Bogomolov, Bruno Lepri, and Fabio Pianesi. Happiness recognition from mobile phone data. InSocial Computing (SocialCom), 2013 International Conference on, pages 790–795. IEEE, 2013.
2. Andrey Bogomolov, Bruno Lepri, Michela Ferron, Fabio Pianesi, and Alex Sandy Pentland. Daily stress recognition from mobile phone data, weather conditions and individual traits. In Proceedings of the 22nd ACM international conference on Multimedia, pages 477–486. ACM, 2014.
3. Andrey Bogomolov, Bruno Lepri, Michela Ferron, Fabio Pianesi, and Alex Sandy Pentland. Pervasive stress recognition for sustainable living. In Pervasive Computing and Communications (PERCOM), 2014 IEEE International Conference on, pages 345–350. IEEE, 2014.
4. Andrey Bogomolov, Bruno Lepri, Jacopo Staiano, Nuria Oliver, Fabio Pianesi, and Alex Pentland. Once upon a crime: towards crime prediction from demo-graphics and mobile data. In Proceedings of the 16th international conference on multimodal interaction, pages 427–434. ACM, 2014.
5. Andrey Bogomolov, Bruno Lepri, and Fabio Pianesi. Generalized compression dictionary distance as universal similarity measure. In Big Data from Space (BiDS’14), number doi: 10.2788/1823, pages 63–66. Publications Office of the European Union, 2014.
6. Andrey Bogomolov, Bruno Lepri, Jacopo Staiano, Emmanuel Letouz´e, Nuria Oliver, Fabio Pianesi, and Alex Pentland. Moves on the street: Classifying crime hotspots using aggregated anonymized data on people dynamics. Big Data, 3(3):148–158, 2015.
Chapter 2
Supervised Learning of Individual
Characteristics:
Supervised learning in Computer Science is an approach of creating a model from data, i.e. “learn from data”, such that is implies the existance of prior etalon labels or values, which directly characterize the explored process or states. Supervised Learning of Individual Characteristics of a human is a complex interdisciplinary problem, involving knowledge of machine learning, psychology, neuroscience and software engineering.
2.1
Happiness
Recognition
from
Telecomuni-cations Metadata
“Life, Liberty and the pursuit of Happiness” are described by Thomas Jefferson, the principal author of the Declaration of Independence, and the third President of the United States, as ”self-evident” and is among the basic rights of every per-son. Also the term “happiness” appears in several drafts of the European Union constitution. To be happy is one of the major goals, if not the ultimate goal, of human beings. During the last decades, the consequences and benefits of happiness have also come into the focus of research. Happiness might not only be a goal of life but also a means for reaching other goals and for facilitating desirable behaviors and outcomes. In a recent review, Lyubomirsky et al. [Lyubomirsky et al., 2005] showed that happy people are successful in many life domains and that this success is at least partly due to their happiness. Happy people are more social, altruistic, active, like themselves and others more, have strong bodies and immune systems, and have better conflict resolution skills. Moreover, pleasant moods promote cre-ative thinking. For this reason, there was an explosion of research on happiness and subjective well-being. Several theories have been proposed to identify the causes of this elusive state (see for a general review [Myers and Diener, 1995]). At the same time, several studies dealt with the problem of measuring happiness. Researchers have generally relied on self-reports which are sometimes coupled with informant data, interviews by trained clinicians, unobtrusive observations of nonverbal expres-sions, and physiological assessments (see [Diener, 1994]). Respondents typically are asked to rate their levels of positive and negative affect over a particular period of time or to make a judgment of their overall life quality. Moreover, Zajonc and McIntosh [Zajonc and McIntosh, 1992] showed the current inadequateness of using psychophysiological measures or brain techniques for this task.
The development of the mobile phones and other mobile smart devices in re-cent years created new alternatives. Some digital applications have started to replace paper-based questionnaires to collect happiness data. For example, Track your Happi-ness [app, 2013b] is a web based platform for tracking and visualizing user’s happiHappi-ness. It was created as part of Matt Killingsworths doctoral research at Harvard University. Three times a day the user is notified by email or text message to report on his smart phone what he is doing and how he is feeling during that activity. After 50 samples, a happiness report is created with details about how user’s happiness varies depending on a variety of factors, such as weekday or location. The main weakness of this tool is that the measuring method at the end is still based on self-reported surveys.
devices are, in fact, able to sense a wealth of behavioral data: i) location, ii) other devices in physical proximity through Bluetooth scanning, iii) communication data, including both metadata (logs of who, when, and duration) of phone calls and text messages (sms) as well as their actual contents, iv) scheduled events, v) operational status, vi) movement patterns, vii) usage information, etc. Recently, the social psy-chologist Geoffrey Miller wrote ”The Smartphone Psychology Manifesto” in which he argues that the smartphone should be taken seriously as new research tools for psychology. In his opinion, these tools could revolutionize all fields of psychology and other behavioral sciences making these disciplines more powerful, sophisticated, in-ternational, applicable, and grounded in real-world behavior [Miller, 2012]. Muaremi et al. [Muaremi et al., 2012] suggested to use smartphones to measure the level of happiness of a person and of an entire community. Along similar lines, recent works have started using smartphone data to automatically infer users’ personality traits [Chittaranjan et al., 2013], [Staiano et al., 2012b], [Montjoye et al., 2013].
In this work we formulated the automatic recognition of daily happiness as a 3-class classification problem based on information concerning: a) peoples activity, as detected through their smartphones; b) weather conditions; c) personality traits. The first information type is represented by features extracted from call and sms logs and from Bluetooth hits, able to capture (i) amount of call, sms and prox-imity; (ii) diversity of call, sms, and proxprox-imity; and (iii) regularity in user behav-iors. Concerning weather conditions, the commonsense and the literature suggest, that they can have an important impact on daily happiness states. Finally, in-dividual dispositions (as captured by personality traits) are expected to interact with situational and contextual aspects (including weather conditions) to play a role in determining daily happiness states.
Classification experiments are performed through a variety of approaches, including support vector machines, neural networks and random forests, yielding an accuracy up to 80.81%.
2.1.1
Related Work
The majority of works in affect recognition focuses on the recognition of emotional states using the visual and acoustic signals found in the speech [Schuller et al., 2005] in the gestures and in the faces of people [Cohn, 2007] [Pantic, 2009] (see [Zeng et al., 2009] for a survey of acoustic and visual approaches). While the authors sometimes use emotion, mood, and happiness interchangeably, they usually measure transient affective states and not moods or daily happiness. One of the most recent ex-amples is the Mood Meter system that detects smiles using video cameras distributed around the MIT campus [Hernandez et al., 2012]. These momentary smiles, the momentary facial expressions or the momentary spoken expressions, usually studied in affective computing, tell little about long-term states such as daily happiness.
To our knowledge the automatic recognition of happiness using smart phones has not been the main target of the research community so far. Some previous works tried to estimate only some possible determinants of happiness. BeWell [Lane et al., 2012] monitors three daily behaviors (activity, social interaction, and sleep patterns), describes the effect of the behavior on well-being, and provides some feedback to the user. Another similar example was proposed by Rabbi et al. [Rabbi et al., 2011] that tries to estimate the mental and physical health based on the amount of speech occurring in natural settings and the overall physical activity performed during a day. Moreover, Muaremi et al. [Muaremi et al., 2012] in a position paper proposed to use smartphones to automatic measure the happiness level of an individual and of an entire community.
Some previous papers tried to focus on mood assessment using mobile phones. Moturu, et al. [Moturu et al., 2011] explored the associations between sleep, mood and sociability by analyzing mobile-phone-generated social communication data and self-reported mood and sleep data. Rachuri et al. [Rachuri et al., 2010] proposed EmotionSense, a novel system for social psychology study of user emotion based on mobile phones. They also showed how the information collected by EmotionSense can be used by social scientists in order to understand the patterns of interaction and the correlation of emotions with places, groups, and activity. More recently, Ma et al. [Ma et al., 2012] proposed a novel framework called MoodMiner for assessing and analyzing mood in daily life. MoodMiner uses mobile phone datamobile phone sensor data and communication data (including acceleration, light, ambient sound, location, call log, etc.) to extract human behavior pattern and assess daily mood. The authors reported a not impressive performance of 50% of accuracy. A significant work is the one conducted this year by LiKamWa et al. [Robert LiKamWa, 2013], in which the authors reported a smartphone software system, called MoodScope, able to infer the mood of its user based on how the smartphone is used.
2.1.2
Dataset:
Living Laboratory
We exploited a dataset, called ”Friends and Family”, capturing more than eight complete weeks in the lives of 117 subjects living in a married graduate student res-idency of a major US university, collected between 21 February, 2010 and 16 July, 2011. During this period, each participant was equipped with an Android-based cellular phone incorporating a sensing software explicitly designed for collecting mo-bile data. Such software runs in a passive manner and does not interfere with the normal usage of the phone [Aharony et al., 2011].
The data collected consisted of: i) call logs, ii) SMS logs, iii) proximity data, obtained by scanning near-by phones and other Bluetooth devices every five minutes, and iii) data from surveys administered to participants, which provided self-reported information about personality (”Big Five”) and self reported information about daily happiness.
More specifically, social interactions were derived from Bluetooth proximity de-tection data in a manner similar to those in previous reality mining studies
[Eagle and Pentland, 2006], [Madan et al., 2010]. The FUNF phone sensing plat-form [app, 2013a] was used to detect Bluetooth devices in the user’s proximity. The Bluetooth scan was performed periodically, every five minutes, in order to keep from draining the battery while achieving a high resolution for social interaction.
the Bluetooth identifiers of each smartphone in the study, we could thus infer when 2 participants’ phones were in proximity.
In total, the dataset consisted of 33497 phone calls, 22587 SMS, and 1460939 Blue-tooth hits.
2.1.3
Happiness data
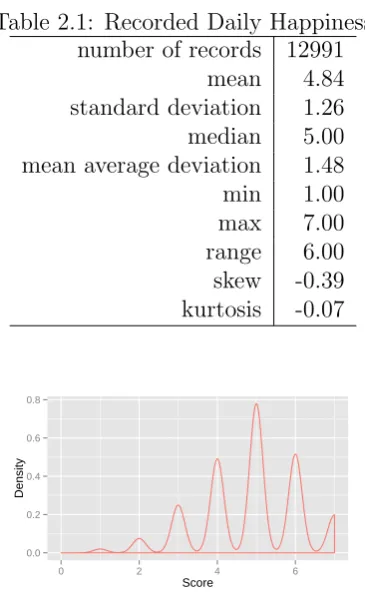
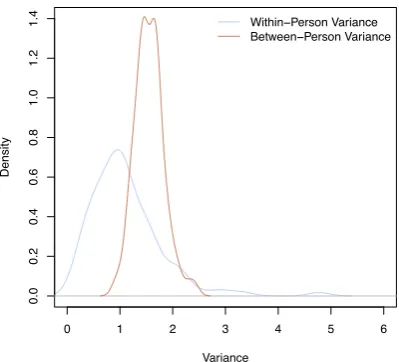
The participants were also asked to fill daily surveys about their self-perceived hap-piness. The happiness information was reported by the participants filling a seven items scale with 1 = ”being very unhappy”, 4 = ”being neither unhappy, nor happy”, and 7 = ”being very happy”. The distribution of the happiness score in the sample is provided in Table 2.1. The distribution of daily happiness is visualized in Fig. 1. We see that it has a negative skew – the density is moved to the higher region of happiness score. The distribution has negative excess kurtosis which is called platykurtic. In our case, that means that the focus group reported specific daily happiness score more often, than neutral. In our sample 91 subjects have the highest score, 43 – low score, 112 – neutral scores at least one day. Within person and between-subject variance for happiness scores (Fig. 2) show, that within-person daily happiness vary much higher than between-person. This property shows the possibility to reliably understand daily emotional states of the same person for each variety ground-truth class from the data. As can be seen, most of the people for most of the time described themselves as having been from moderately to quite happy during the day.
Table 2.1: Recorded Daily Happiness number of records 12991
mean 4.84 standard deviation 1.26 median 5.00 mean average deviation 1.48 min 1.00 max 7.00 range 6.00 skew -0.39 kurtosis -0.07
0.0 0.2 0.4 0.6 0.8
0 2 4 6
Score
Density
0 1 2 3 4 5 6
0.0
0.2
0.4
0.6
0.8
1.0
1.2
1.4
density.default(x = r1[, 1])
Variance
Density
Within−Person Variance Between−Person Variance
Figure 2: Within Person and Between-subject Variance for Happiness Recognition Problem
2.1.4
Personality Data
Several studies in social psychology highlighted the impact of personality traits on happiness: in particular, these studies showed the role played by extraversion and neuroticism [Vitters, 2001], [Lyubomirsky et al., 2006].
Costa and McCrae have also found evidence of a positive relationship between ex-traversion and happiness, whereas negative affect was more strongly correlated with neuroticism [Costa and McCrae, 1980]. In an effort to more fully explicate the re-lationship between extraversion and happiness, several studies have emerged. One of them conducted by Gray suggests that extraverts are more sensitive to rewarding stimuli (social and not) than introverts [Gray, 1991]. Numerous studies have shown that subjective well-being is related to the Five-Factor Model (FFM) of personality, especially the domains of Neuroticism, Extraversion, and Conscientiousness, and that, although subjective well-being is not subsumed by personality, the two constructs are reliably correlated [DeNeve and Cooper, 1998]. At a psychological level, several plausible mechanisms have been proposed to explain the relationship between per-sonality and subjective well-being. For example, some researchers [Sanderson, 1999], [Carver and Scheier, 1990] have emphasized the roles of Extraversion and Neuroti-cism in reward and punishment systems, respectively. Others have proposed that the relationship arises from indirect, instrumental effects of personality on the expe-riences an individual encounters [McCrae and Costa, 1991].
2.1.5
Weather data
Weather is widely believed to influence people’s mood and daily happiness. For example, the majority of people think they feel happier on days with a lot of sun-shine as compared to rainy days. However, the number of studies investigating the associations between daily weather and happiness or between daily weather and mood is relatively small [Keller et al., 2005].
More recently, Denissen et al. [Denissen et al., 2008] investigated the effects of six daily weather variables (temperature, wind power, sunlight, precipitation, air pres-sure, photoperiod) on three mood variables (positive affect, negative affect, and tired-ness). Furthermore, they examined also individual differences in sensitivity to weather fluctuations including personality and demographic characteristics. Their results re-vealed main effects of temperature, wind power, and sunlight on negative affect. Sun-light had a main effect on tiredness and mediated the effects of precipitation and air pressure on tiredness. Finally, the authors found that individual differences in weather sensitivity could be not explained by the personality traits, the gender or the age.
More specifically on happiness, Tsutsui [Tsutsui, 2012] found that subjective hap-piness is related to temperature. The effects of other meteorological variables – humidity, wind speed, precipitation, and sunshine – were not significant. More-over, happiness is more strongly affected by current temperature than by average temperature over the day. While enjoyment (a positive affect measure) is affected by weather in a similar way to happiness, sadness and depression (negative af-fect measures) behave somewhat differently.
In our experiments we used the following weather parameters: mean temperature, pressure, total precipitation, humidity, visibility and wind speed metrics.
2.1.6
Feature Extraction
Several cross-sectional studies have documented that happy people are usually in-volved in more social and active behavior. Moreover, several works highlighted an association between happiness and the actual number of friends or companions peo-ple report they can rely on [Lee and Ishii-Kuntz, 1987].
Friendship has been found to have one of the highest positive correlations with self-rated happiness [Campbell et al., 1976]. For example, the happiest college students (the top 10%) have been shown to have high quality social relationships [Diener and Seligman, 2002]. Happy people also report being more satisfied with their friends and their social activities [Lyubomirsky et al., 2006]. Not surpris-ingly, loneliness is negatively correlated with happiness, especially in older adults [Lee and Ishii-Kuntz, 1987]. As shown by Eagle et al. [Eagle et al., 2009a] and by Dong et al. [Dong et al., 2011a], data collected from mobile phones (call logs, sms and Bluetooth hits) can provide insights into the relational dynamics of individuals, in particular those concerning friendship. It makes, therefore, sense to address the discussed relationships between happiness and friendship by addressing social communication as mediated by, or detected through, the smartphone.
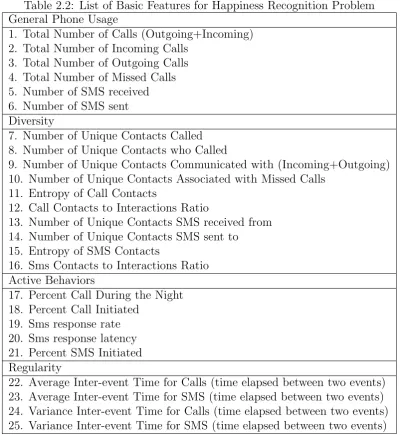
Based on these considerations, on previous works attempting to characterize social interactions by means of mobile phone data and taking inspirations from works on personality prediction using mobile phone data [Chittaranjan et al., 2013], [Montjoye et al., 2013], we derived the 25 call and sms features reported in Table 2.13 and the 9 proximity features reported in Table 2.14.
quantiles with a linear step of 0.05, quantiles for the cases of 0.5, 1, 1.5 and 2 standard deviations from the mean (applying Chebyshev’s inequality), variance and standard deviation functions. Moreover, to capture the possible influence of the previous hap-piness states on the current one we computed each basic subset of features using backward moving windows of different size, more specifically of 2, 3, 4 and 5 days.
Finally, in order to get bias corrected empirical entropy estimates we ap-plied Miller-Madow correction for entropy calculation [Miller, 1955], which is explained in Equation 2.13.
ˆ
HM M(θ)≡ − p
X
i=1
θM L,ilogθM L,i+
ˆ m−1
2N , (2.1)
where mˆ is a number of bins with nonzero θ-probability. The likeli-hood function is given as the product of probability density functions P(θ) = f(x1;θ)f(x2;θ)· · ·f(xn;θ) for a random sample X1,· · · , Xn . θM L is
the maximum likelihood estimate of θ, which maximizes P(θ).
2.1.7
Call and SMS Features
The features reported in Table 2.13 fall under four broad categories: (i) general phone usage, (ii) diversity, (iii) active behaviors and (iv) regularity.
Features for general phone usage (Table 2.13) capture the total number of out-going, incoming and missed calls, and the total number of sent and received sms. Moreover, they also capture the duration of the calls the user has performed, re-porting about the total duration of the calls, the total duration of outgoing calls, the total duration of incoming calls and the average of each feature. Finally, we also extracted the Outgoing to Incoming Calls Ratio, Missed to (Outgoing + In-coming) Calls Ratio, and SMS Sent/Received Ratio.
Concerning regularity features, we measured the time elapsed between calls, the time elapsed between sms exchanges and the time elapsed between call and sms. More precisely, we consider both the average and variance of the inter-event time of ones’ call, sms, call+sms. A thing to note is that even though two users have the same inter-event time for both call and sms, their mean inter-event times for call+sms can be very different.
Diversity measures how evenly an individual’s time is distributed among others. In our case, the diversity of user behavior is addressed by means of three kinds of features: (i) entropy of contacts, (ii) unique contacts to interactions ratio, (iii) number of unique contacts. We compute the diversity features both for calls and sms.
In particular, the entropy of an individual is the ratio between his/her total number of contacts and the relative frequency at which he/she inter-acts with them. The more one interacts equally often with a large number of contacts the higher the entropy will be.
2.1.8
Proximity Features
Table 2.2: List of Basic Features for Happiness Recognition Problem General Phone Usage
1. Total Number of Calls (Outgoing+Incoming) 2. Total Number of Incoming Calls
3. Total Number of Outgoing Calls 4. Total Number of Missed Calls 5. Number of SMS received 6. Number of SMS sent Diversity
7. Number of Unique Contacts Called 8. Number of Unique Contacts who Called
9. Number of Unique Contacts Communicated with (Incoming+Outgoing) 10. Number of Unique Contacts Associated with Missed Calls
11. Entropy of Call Contacts
12. Call Contacts to Interactions Ratio
13. Number of Unique Contacts SMS received from 14. Number of Unique Contacts SMS sent to
15. Entropy of SMS Contacts
16. Sms Contacts to Interactions Ratio Active Behaviors
17. Percent Call During the Night 18. Percent Call Initiated
19. Sms response rate 20. Sms response latency 21. Percent SMS Initiated Regularity
22. Average Inter-event Time for Calls (time elapsed between two events) 23. Average Inter-event Time for SMS (time elapsed between two events) 24. Variance Inter-event Time for Calls (time elapsed between two events) 25. Variance Inter-event Time for SMS (time elapsed between two events)
that RSSI is merely a relative parameter. The RSSI parameter is intended to be used for power control purpose. The receiver sends increase or decrease transmission power request to the transmitting side depending on whether the perceived RSSI level. A positive or negative RSSI, measured in dB, means the received power level is above or below the GRPR, respectively. A zero implies that it is ideal.
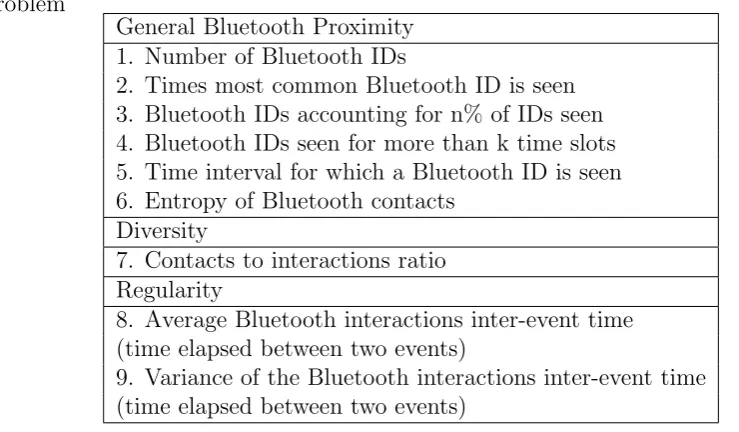
From the filtered Bluetooth proximity data we extracted the following basic Bluetooth proximity features (Table 2.14).
In this case, the extracted features fall under three broad categories: (i) general proximity information, (ii) diversity, and (iii) regularity.
2.1.9
Methodology and Experimental Results
We formulated the automatic recognition of daily happiness as a classification problem with 3 classes (happy, neutral, not happy). The ground truth labels for classification problem were set to−1 for ”not happy” class, when the (score < 4), 0 for ”neutral” (score = 4) and 1 for ”happy” daily mood (score > 4).
Table 2.3: List of Basic Bluetooth Proximity Features for Happiness Recognition Problem
General Bluetooth Proximity 1. Number of Bluetooth IDs
2. Times most common Bluetooth ID is seen 3. Bluetooth IDs accounting for n% of IDs seen 4. Bluetooth IDs seen for more than k time slots 5. Time interval for which a Bluetooth ID is seen 6. Entropy of Bluetooth contacts
Diversity
7. Contacts to interactions ratio Regularity
8. Average Bluetooth interactions inter-event time (time elapsed between two events)
9. Variance of the Bluetooth interactions inter-event time (time elapsed between two events)
more efficiently the feature matrix was normalized by each column to [−1,1] interval and centered to 0. Then, we trained a three families of classifiers: (i) Support Vector Machines, (ii) Neural Networks and (iii) Random Forests.
For support vector machines model[Vapnik, 1995] we used the following
decision function for each class: D(x) = sign(
l
X
i=1
yiαiK(xi, x) +b) (2.2)
Our multi-class classification problem is solved as a one-versus-all case by a winner-takes-all strategy, in which the classifier with the highest out-put function is assigned to the class.
We used the kernel functions provided in Table 2.1.9.
Linear kernel did not provide accurate enough results thus only Gaussian radial basis [Buhmann and Buhmann, 2003] kernel results are reported in this chapter.
The second family of statistical models used to solve our classification prob-lem is based on random forest algorithm.
Random forests is a combination of tree predictors, such that each tree is de-pendent on the values of a random vector sampled indede-pendently with the same distribution for all the classification trees in the forest[Breiman, 2001]. The decision boundary is formed according to the margin function. Given an ensemble of tree classifiersh1(x), h2(x), ..., hK(x) and if the training set is drawn at random from the
empirical distribution of the random vectorY,X the margin function is defined as:
mg(X, Y) =avgkI(hk(X) =Y)−
maxj!=Y avgkI(hk(X) = j),
(2.3)
whereI(·) is the characteristic function. The margin function measures the distance between the average votes at (X, Y) for the right class and the average vote for any other class. For this model the generalization error function is:
Table 2.4: Top-30 Features for Happiness Recognition
-1 0 1 MeanDecreaseAccuracy MeanDecreaseGini meanTemperature 0.0099 0.0033 0.0094 0.0082 154.8379 humidity 0.0047 -0.0033 0.0115 0.0074 149.7668 pressure -0.0002 0.0008 0.0015 0.0011 149.0302 windSpeed 0.0028 0.0017 0.0051 0.0040 142.7727 visibility 0.0024 -0.0009 0.0051 0.0034 120.8683 neuroticism 0.0690 0.0288 0.0399 0.0419 90.5721 conscientiousness 0.0659 0.0480 0.0668 0.0627 90.2708 extraversion 0.0511 0.0357 0.0472 0.0454 76.9467 openness 0.0656 0.0340 0.0406 0.0429 73.9181 totalPrecipitation 0.0007 -0.0000 0.0012 0.0009 73.5273 agreeableness 0.0536 0.0282 0.0235 0.0289 70.7261 bluetoothQ95TimeForWhichIdSeen 0.0233 0.0120 0.0149 0.0155 22.4018 bluetoothQ90TimeForWhichIdSeen 0.0161 0.0082 0.0141 0.0131 19.8364 smsRepliedEventsLatencyMedian 0.0093 0.0085 0.0096 0.0093 18.7719 bluetoothIdsMoreThan04TimeSlotsSeen 0.0114 0.0066 0.0124 0.0110 15.6738 bluetoothMaxTimeForWhichIdSeen 0.0141 0.0072 0.0095 0.0097 15.2546 bluetoothTotalEntropyMillerMadow 0.0058 0.0017 0.0035 0.0035 13.9000 bluetoothTotalEntropyShannon 0.0065 0.0009 0.0060 0.0050 13.1826 callMeanInterEventTimePerDay -0.0003 -0.0000 0.0014 0.0009 13.1180 incomingAndOutgoingCallsPerDay -0.0000 -0.0002 0.0024 0.0015 12.3962 bluetoothQ50TimeForWhichIdSeen 0.0104 0.0104 0.0091 0.0095 12.2270 callStandardDeviationInterEventTimePerDay 0.0004 -0.0005 0.0007 0.0004 10.1723 bluetoothIdsMoreThan19TimeSlotsSeen 0.0087 0.0033 0.0089 0.0077 9.7388 incomingCallsPerDay 0.0003 -0.0005 0.0009 0.0005 9.6572 outgoingContactsToInteractionsRatioPerDay 0.0005 -0.0004 0.0013 0.0009 9.2016 callsInitiatedRatioPerDay -0.0001 -0.0001 0.0014 0.0008 9.0245 entropyMillerMadowCallsOutgoingWindow3Days 0.0001 -0.0008 0.0014 0.0008 8.7199 bluetoothIdsMoreThan09TimeSlotsSeen 0.0074 0.0046 0.0040 0.0046 8.6006 bluetoothQ75TimeForWhichIdSeen 0.0027 0.0018 0.0032 0.0028 8.4454 outgoingCallsPerDay -0.0001 -0.0001 0.0012 0.0007 8.3368
Table 2.5: SVM Kernel Functions
Name Kernel Parameters
Linear u>v
-Radial Basis Function exp{−γ|u−v|2} γ
where PX,Y is the probability over hX, Yi space. For any event A ⊂ Ω of the
fea-ture space the characteristic function I(·) of A is:
IA(x) =
(
1 ⇐⇒ (x⊂A) 0 otherwise
) (
1 ⇐⇒ ∃x 0 otherwise
)
(2.5)
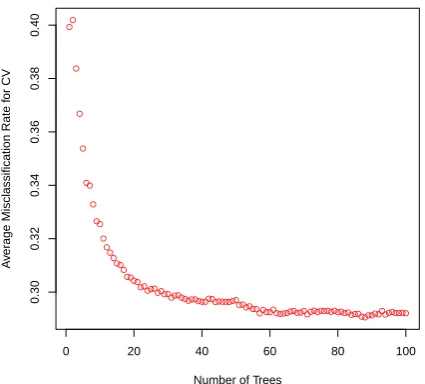
Random Forests classifiers were trained with a stepwise increase of the number of trees equal to the upper limit of 211. Optimal number of trees for model gen-eralization as measured by mean misclassification rate for 10-fold cross validation strategy is estimated to be 100 (Fig. 3).
The third approach for a solution is based on multi-layer perceptron neural net-work. In a parametric functional form it is expressed as:
fθ(x) =S(hw,x˜i+b), (2.6)
where
˜
x=S(Whiddenx+bhidden), (2.7)
with parameters
● ● ● ● ● ●● ● ●● ● ● ● ● ●●● ●●●● ●●●●●●●●● ●●●●●●●●●●●●●●●●●●●●●●●●●● ●●●●●●●●●●●●●●●●●●●●●●●●●●●●●●●●●●●●●●●●●●●●
0 20 40 60 80 100
0.30 0.32 0.34 0.36 0.38 0.40
Number of Trees
A
v
er
age Misclassification Rate f
or CV
Figure 3: Misclassification Error vs Number of Tree Classifiers in Ensemble Model for Happiness Recognition Problem
and the decision function is a sigmoid function
S = 1
1 +e−x (2.9)
The happiness recognition problem was solved as the following optimization problem:
ˆ
θ = arg min
θ
ˆ
Rθ(fθ, Dn), (2.10)
where the sum of empirical risk and regularization term is expressed
ˆ
Rθ(fθ, Dn) = n
X
i=1
L(fθ(x(i)), t(i)) +λΩ(θ). (2.11)
Neural network training was performed using classical backpropagation algorithm. Neural network topology was iteratively searched, based on the assumptions inferred from the data, for the best balance between empirical error minimization and max-imum κ metric validated using 10-fold cross validation technique.
In order to select the final approach and the model, we compared these three families by means of a set of accuracy and κ metrics. The κ measures pairwise agreement among a set of functions which are making classification decisions with correction for an expected chance agreement [Cohen, 1960]:
κ= P(A)−P(E)
1−P(E) (2.12)
it highly relevant for our classification model search and comparison task. κ statis-tic has the properties of more robust measure than the simple percent agreement measure taking into account the agreement occurring by chance.
During the learning and model selection process we used a random sampling with replacement to generate a new set of data for each fold from the basic training set following leave-one-out 10-fold cross validation scheme. We adopted this strategy in order to deal with potential data loss in cases when calls, sms and Bluetooth proximities existed in the real world but were not registered in the database.
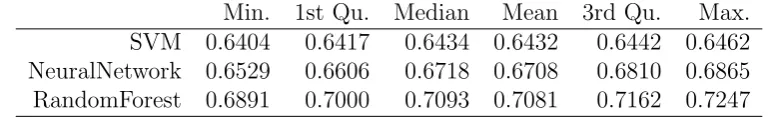
Given the unbalanced classes of the ground truth daily happiness labels (that peo-ple were more happy than unhappy during the experiment) we found a solution to prevent data overfitting by the way we trained the models and searched in the possible classifier’s space. Ourstructural risk minimizationas opposed to empirical risk mini-mization solution, to prevent the data overfitting, was incorporated by working with a regularization penalty into the learning process, by balancing the model’s complexity against its fitting the training data and by sampling of the model training sets in the way they mimic the empirical distributions without most probable erroneous outliers. Accuracy andκmetrics comparison for each model type using 10-fold cross valida-tion strategy are provided in Table 2.6 and Table 2.7. Random Forest classifier showed an average accuracy for this classification problem better than the best SVM-based model with radial basis kernel for 10.09% and better than neural network classifier for 5.56%. The conservative measure of agreementκcomparison explains the problem of unbalanced classes for an SVM classifier. SVM did good only for majority classes. As κ has a tendency to take the observed categories’ frequencies as given, which causes the effect of underestimating agreement for a category that is most commonly used. Neural network classifier captured relations between the variables in a pretty stable manner among the unbalanced classes, comparing to SVM. This best tradeoff be-tween generalization capabilities of a neural network and high overfitting for a neural network is still less efficient in comparison to the Random Forest classifier results.
We found that distribution of the estimated performance metrics does not vary substantially among each fold, leading to a good generalization de-spite of possible existence of heterogeneous data in each fold and the “noise” coming from the resampling procedure.
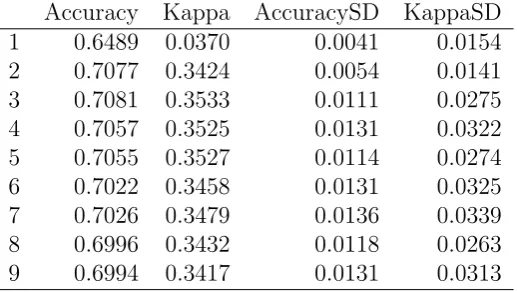
Given the reason discussed above, as we trained the models on artifitially gen-erated data from each fold of the training sample, we have lower accuracy and κ results for the cross validation reported results (Table 2.8) than we get on the na-tive data (training and test feature subsets).
Table 2.6: 10-fold CV Model Comparison for Happiness Recognition Problem: Accu-racy
Min. 1st Qu. Median Mean 3rd Qu. Max. SVM 0.6404 0.6417 0.6434 0.6432 0.6442 0.6462 NeuralNetwork 0.6529 0.6606 0.6718 0.6708 0.6810 0.6865 RandomForest 0.6891 0.7000 0.7093 0.7081 0.7162 0.7247
The final model is based on a Random Forests algorithm and uses a 111-dimensional feature vector. We identified the variables that have more predictive power for the Random Forest model by calculating mean de-crease in Gini index (Table 2.4).
Table 2.7: 10-fold CV Model Comparison for Happiness Recognition Problem: Kappa Min. 1st Qu. Median Mean 3rd Qu. Max.
SVM 0.0012 0.0056 0.0133 0.0115 0.0162 0.0226 NeuralNetwork 0.1381 0.1708 0.2055 0.1963 0.2173 0.2570 RandomForest 0.3094 0.3358 0.3565 0.3533 0.3733 0.3950
Table 2.8: 10-fold Cross Validation Happiness Recognition Metrics for Each Fold Comparison
Accuracy Kappa AccuracySD KappaSD
1 0.6489 0.0370 0.0041 0.0154
2 0.7077 0.3424 0.0054 0.0141
3 0.7081 0.3533 0.0111 0.0275
4 0.7057 0.3525 0.0131 0.0322
5 0.7055 0.3527 0.0114 0.0274
6 0.7022 0.3458 0.0131 0.0325
7 0.7026 0.3479 0.0136 0.0339
8 0.6996 0.3432 0.0118 0.0263
9 0.6994 0.3417 0.0131 0.0313
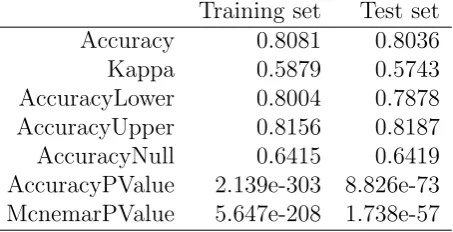
the test set (Table 2.11). It this table the final happiness recognition model per-formance metrics and statistical estimates comparison are provided. In contrast, to show generalization power of the model, we provide detailed metrics for each fold during 10-fold cross validation process (Table 2.8).
The confusion matrices for this model for each training and test sets are provided in Table 2.9 and Table 2.10. These matrices show in details that there is a major agreement between classes. But Table 2.10 shows that there are still a lot of mis-classified samples as “unhappy” (152 out of 2597 samples) which are, in fact, the happy state for the actual class. 243 samples are classified as “neutral” being actu-ally “happy”. The best result we have for the majority “happy” class (1616 correctly classified). These tables prove us good generalization capabilities of the model – for each the training and the test sets we have similar results in detail.
To show our result visually in a simple form, that actually the final proposed model delivers better results than “by chance”, we report the multi-class area under the ROC curve [Wandishin and Mullen, 2009], [Hand and Till, 2001]. The final model ROC curve plotted for the test subset is provided in Fig. 4. The multi-class area under the ROC curve (AUC) = 0.844 means a good reduction of missclassification error for each class combination [Krzanowski, 2005]. The area between the ROC curve and the diag-onal is, in fact, what our model does better then “by change”. The area between the ROC curve and the perpendicular lines going to the upper left corner [1.0,1.0] is the measure of what is not explained by our model, what causes the misclassification error.
Table 2.9: Final Classifier Happiness Recognition Model Confusion Matrix for Train-ing Set
-1 0 1
Table 2.10: Final Classifier Happiness Recognition Model Confusion Matrix for Test Set
-1 0 1
-1 197 30 14
0 34 274 37
1 152 243 1616
Table 2.11: Final Classifier Happiness Recognition Model Performance Metrics Com-parison
Training set Test set Accuracy 0.8081 0.8036
Kappa 0.5879 0.5743
AccuracyLower 0.8004 0.7878 AccuracyUpper 0.8156 0.8187 AccuracyNull 0.6415 0.6419 AccuracyPValue 2.139e-303 8.826e-73 McnemarPValue 5.647e-208 1.738e-57
2.1.10
Discussion
The present study provides the first evidence that daily happiness of individuals can be automatically predicted using a set of indicators obtained from mobile phone data (call logs, sms logs and Bluetooth interactions) and additional indicators related to weather factors and individuals’ personality traits. Our final model based on a Random Forest classifier using 111-dimensional feature vector obtains an accuracy measure of 80.81% for a 3-class classification problem.
An investigation of the most important features to predict daily happiness revealed interesting associations. Indicators linked to the weather factors were really useful to predict daily happiness. Our results confirm some of the results obtained by a previous study done by [Tsutsui, 2012]. In our study, we found a confirmatory association between subjective happiness and temperature. Additionally, we found significant effects of other meteorological variables – humidity, wind speed, pressure, total precipitation and visibility – for predicting daily happiness.
We also found interesting associations between personality traits and daily hap-piness. All the traits contribute significantly the prediction of daily happiness re-sponse variable. These results are interesting because the previous studies in so-cial psychology focus their analyses mainly on the associations between happiness or subjective well-being and Extraversion or Neuroticism. Instead, our work shows the important contribution played also by Conscientiousness, Openness and Agree-ableness for the automatic classification of daily happiness. Moreover, these results open us the possibility of creating a multi-step stochastic model in which first we estimate the personality and then we use the estimated variables as independent variables for a happiness recognition problem.
Regarding the role played by mobile phone data in predicting daily happiness, it’s interesting to note the significant contribution of the proximity features. Among the top 30 features used for happiness recognition, 10 features are proximity ones calculated from the Bluetooth data. In particular, an interesting predictive role is played by the time intervals for which an id is seen.
power for daily happiness recognition based on median, 0.75, 0.9 and 0.95 quantiles from the distribution of the time intervals, measured in seconds, for which a Bluletooth identifier is seen.
Moreover, features capturing the diversity in co-location interactions are in the top 30 list (e.g. entropy of proximity contacts). This result seem to confirm previous studies in social psychology that found associations between people’s happiness and the richness in terms of the amount and the diversity of people’s social interactions.
For call interactions, we can infer the role played by general phone usage fea-tures such as the number of incoming calls and the number of outgoing calls. This result is consistent with previous studies on happiness showing that happy people are usually more social and have more interaction and exchange. In addition, a role of the regularity in call patterns (average and standard deviation values of the time elapsed between two calls) and active behavior of an individual (the ratio of calls initiated by the individual) also play predictive role. The latter indicator could be easily explained making reference to the standard definition of happy people as more active people given by social psychologists.
The role of sms interactions is less evident from our investigation. The only feature related to sms interactions among the top 30 predictive features is a feature related to an active behavior of the individual and more specifically is the latency in replying to a text message that we define as the median value that people take to answer a text. The predictive power of the sms data needs further investigations.
Among the limitations of the present study we list the following: our sample comes from a population living in the same environment (our subjects were all married grad-uate students living in a campus facility of a major US university); the non-availability of proximity data concerning the interaction with people not participating in the data collection, a fact that is common to many other studies of this type. The first two problems are at least partially attenuated by the large variability of the sample in terms of provenance and cultural background, which can be expected to correspond to a wide palette of interaction behaviors that efficaciously counterbalance the effects of living-place homogeneity. Moreover, the Funf framework used for collecting this data did not account for the data loss in cases when calls, sms and Bluetooth proximities existed in the real world but were not registered in the database as not available. The source data loss, when the battery is out, was also not registered and was un-predictable during the data collection. In order to solve these potential problems, we proposed and used a random sampling with replacement for each fold of our learning task and we used it to generate better datasets from the separate training set.
2.1.11
Conclusion
The goal of this chapter is to investigate the feasibility of automatic recognition of people’s daily happiness from mobile phone data. To achieve this goal, we formu-lated the automatic recognition of daily happiness as a 3-class classification problem based on the information concerning: a) peoples activity, as detected through their smartphones; b) the weather conditions; c) personality traits. The first information type is represented by features extracted from call and sms logs and from Bluetooth hits, able to capture (i) amount of call, sms and proximity; (ii) diversity of call, sms, and proximity; (iii) user active behaviors; and (iv) regularity in user behaviors.
Specificity
Sensitivity
0.0
0.2
0.4
0.6
0.8
1.0
1.0 0.8 0.6 0.4 0.2 0.0
AUC: 0.844
Figure 4: Final Model ROC Curve for Happiness Recognition Problem
2.2
Daily Stress Recognition from Mobile Phone
Data
2.2.1
Introduction
Nowadays, the number of mobile phones in use worldwide is about 5 billion, with millions of new subscribers everyday 1. Mobile phones allow for unobtrusive and cost-efficient access to huge streams of previously inaccessible data related to daily social behavior [Lane et al., 2010b]. These devices are able to sense a wealth of behavioral data such as (i) location, (ii) other devices in physical proximity through Bluetooth scanning, (iii) communication data, including both metadata (logs of who, when, and duration) of phone calls and text messages (sms), etc. Correspondingly, the availability is continuously growing of huge streams of personal data related to activities, routines and social interactions [Lane et al., 2010b, Dong et al., 2011a] which represent a novel opportunity to address fundamental problems of our societies in different fields, such as mobility and urban planning [Gonzalez et al., 2008], finance [Singh et al., 2013], healthy living and subjective well-being [Madan et al., 2012, LiKamWa et al., 2013].
In this work, we focus on one of the most widespread problem of subjective well-being and society – the stress. Stress is a well-known condition in modern life and research has shown that the amount of cumulative stress plays a role in a broad range of physical, psychological and behavioural conditions, such as anxiety, low self-esteem, depression, social isolation, cognitive impairments, sleep and immunological disorders, neurodegenerative diseases and other medical conditions [Cohen et al., 1997], while also significantly contributing to healthcare costs. Hence, measuring stress in daily life situations has become an important challenge [Plarre et al., 2011]. Today, the availability of huge and diverse streams of pervasive data produced by and about people allows for automatic, unobtrusive, and fast recognition of daily stress levels. An early prediction of stress symptoms can indeed help to prevent situations that are risky for human life[Healey and Picard, 2005].
Several studies have produced interesting results that support the feasibility of detecting stress levels through physiological sensors (see [Healey and Picard, 2005], [Jovanov et al., 2003]). However, the use of physiological sensors is limited by several shortcomings. Stress detection systems based on physiological measurement such as heart-rate variability or skin conductance are intrusive and need to be easily wearable to be exploited in natural settings; the data they produce can be con-founded by daily life activities such as speaking or drinking; they exhibit important between-person differences [Plarre et al., 2011].
Recently, social psychologist Miller wrote “The Smartphone Psychology Mani-festo” in which he argued that the smartphones should be seriously considered as new research tools for psychology. In his opinion, these tools could revolution-ize all fields of psychology and other behavioral sciences making these disciplines more powerful, sophisticated, and grounded in real-world behavior [Miller, 2012] and [Lathia et al., 2013]. Indeed, several works have started to use smartphone activ-ity data in order to detect and predict personalactiv-ity traits [de Oliveira et al., 2011, Staiano et al., 2012b, Chittaranjan et al., 2013, Montjoye et al., 2013], mood states [LiKamWa et al., 2013], and daily happiness [Muaremi et al., 2012]. Stopczynski et al. [Stopczynski et al., 2014] described the Copenhagen Networks Study, a large-scale
study designed to measure human interactions spanning multiple years.
Smartphones data can be used to detect stress levels as well. Indeed, stress levels are associated with the type of activities people engage in, including those executed at/through their smartphone (for instance, a high number of phone calls and/or e-mails from many different people could be associated with higher stress levels). Weather conditions – an environmental transitory property – in turn, have been argued [Howarth and Hoffman, 1984], [Sanders and Brizzolara, 1982] to be often as-sociated with stress, acting either directly (as stressors) or indirectly (by affecting individual sensitivity to stressors). Finally, the impact of all these transitory factors – (smartphone) activities and weather conditions – on stress induction can be ex-pected to be modulated by personal characteristics and differences [Suls et al., 1998], [Vollrath and Torgersen, 2000]. For example, a neurotic person could react with higher levels of stress to a high number of interactions (call, sms or proximity in-teractions) than an emotionally stable person; an extrovert or agreeable person, in turn, might well find him/herself at ease with a high number of interactions.
In this chapter, we approach the automatic recognition of daily stress as a 2-class 2-classification problem (non-stressed vs stressed) based on information concerning different types of data: a) people activities, as detected through their smartphones; b) weather conditions; c) personality traits. The information about people activities is represented by features extracted from call and sms logs and from Bluetooth hits, are able to capture (i) the amount of calls, of sms and of proximity interactions; (ii) the diversity of calls, of sms, and of proximity interactions; and (iii) regularity in user behaviors. In addition, we use weather conditions (environmental and transitory factors) along with personality traits (internal and stable factors); the latter are mediating factors that can modulate people responses to stressors (e.g., weather, daily activity). This multifactorial approach will be compared to approaches based only on a family of features (personality, weather conditions, mobile phone features) or simpler combinations of families of features (personality and weather conditions; personality and mobile phone features; weather conditions and mobile phone features).
Classification experiments are performed using a variety of approaches and the best solution for our classification problem was found using an ensemble of tree clas-sifiers based on a Random Forest algorithm. Our multifactorial approach obtains an accuracy score of 72.28% for a 2-class daily stress recognition problem, provid-ing evidence that individual daily stress can be reliably predicted from the com-bination of smartphone usage data, weather conditions and individual dispositions (personality traits). Interestingly, if one of these information sources is dropped, the recognition performances decrease drastically.
The main contributions of this chapter are as follows:
1. We propose a multi-factorial data-driven approach to the prediction of individ-ual daily stress;
2. We validate our approach with a seven-months dataset collected from 111 sub-jects;
2.2.2
Related Work
A large body of research on stress detection focused on physiological measure-ments to infer stress levels (see [Healey and Picard, 2005], [Majoe et al., 2010], [Plarre et al., 2011]). Heart-rate variability, galvanic skin response, respiration, muscle activity and temperature are among the most relevant features. How-ever, despite providing reliable insights on stress levels, this approach has major limitations because it comprises wearable sensors that need to be carried at all times to allow for continuous monitoring.
Among the different changes in physiological parameters that happen during stressful situations, variation in speech production has inspired a number of studies using acoustic sensing on smartphones. Research on stress detection based on voice analysis considered different speech characteristics such as pitch, glottal pulse, spectral slope and phonetic variations. For example, Lu and colleagues [Lu et al., 2012] proposed StressSense, an Android application for stress detection from human voice in real-life conversation, and they achieved 81% and 76% accuracy for indoor and outdoor environments.
However, these methods depend on sound quality, which is not granted in natural settings (e.g., crowded public places, noisy outdoor), and the correla-tion between speech and emocorrela-tion is subjected to large individual differences [Scherer et al., 2002]. Hence, our performance of 72.28% is a good and reliable alternative to stress detection. Other studies focused on the video analysis of behavioural correlates of psychological stress [Giakoumis et al., 2012]. These systems, despite providing an unobtrusive method for stress monitoring, cannot be employed in a large variety of real world and mobile environments and pose privacy concerns related to the recording of people’s behaviour.
A promising approach that can overcome the major shortcomings of stress detection based on physiological measures and on audio/video analysis is activity recognition from smartphone usage patterns. Studies in this field have been mainly fo-cused on the understanding of relational dynamics of individuals [Eagle et al., 2009b]. Recently studies have started to investigate how smartphone usage habits can pro-vide insights into users’ affective state [LiKamWa et al., 2013] and stress levels [Bauer and Lukowicz, 2012]. LiKamWa and colleagues [LiKamWa et al., 2013] proposed MoodScope, a mobile software system that recognizes the users’ mood, but not stress states, from smartphone usage analysis. They collected usage data and self-reported mood in a two months longitudinal study and used them to train mood models. Smartphone usage data consisted in phone calls, SMSes, e-mail messages, application use, web browsing histories and location changes, while self-reported mood was collected from users’ input at least four times a day. MoodScope reached a 66% accuracy of participants’ daily-average mood, with phone calls and categorized applications as the most useful features for mood discrimination.
stressed” or ”stressed”, while Bauer and Lukowicz try to detect stressful situations. In 2013, Sano and Picard [Sano and Picard, 2013] reported an accuracy performance in stress recognition of 75% using a combination of features ob-tained from mobile phones and wearable sensors. However, the limited number of subjects used in their experiments (18) and the limited number of days (5) make preliminary the results of this study.
2.2.3
Data Collection
From November 12, 2010 to May 21, 2011, we collected a dataset capturing the lives of 117 subjects living in a married graduate student residency of a major US university. Our sample of subjects has a large variety in terms of provenance and cultural background: we have subjects from 16 countries such as USA, China, Israel, India, Iran, Russia, etc. During this period, each participant was equipped with an Android-based cellular phone incorporating a sensing software explicitly designed for collecting mobile data. Such software runs in a passive manner and does not interfere with the every day usage of the phone. The data collected consisted of: (a) call logs, (b) sms logs, (c) proximity data, obtained by scanning nearby phones and other Bluetooth devices every five minutes, and (d) data from surveys administered to participants, which provided self-reported information about personality traits (“Big Five”) and self reported information about daily stress.
Proximity interaction data were derived from Bluetooth hits in a similar way as in previous reality mining studies [Eagle and Pentland, 2006]. Bluetooth scans were performed every 5 minutes in order to keep the battery from draining while achieving a high enough temporal resolution. The Bluetooth log of a given smartphone was then used to extract the list of the other participants’ phones which were in proximity.
In total, the dataset consisted of 33497 phone calls, 22587 SMS, and 1460939 Blue-tooth hits.
2.2.4
Stress data
At the evening, the participants were also asked to fill daily surveys about their daily self-perceived stress level. The stress information was reported by the participants filling a seven items scale with 1 = “not stressed”, 4 = “neutral” and 7 = “extremely stressed”. In our experiments we used the data only for the subjects (111 subjects) who had provided at least 2 weeks of consecutive data.
The distribution of daily stress is visualized in Fig. 5. We see that it has a small negative skew – the density is moved to the higher region of stress score. The distribution has negative exc