MODELING FINANCIAL STABILITY:
THE CASE OF THE BANKING SECTOR
IN MACEDONIA
Jasmina Popovska
Fund for innovations and technology development Skopje, Macedonia
Abstract
The global financial crisis from 2007-2009 has additionally emphasized the necessity of paying special attention to the financial system stability, especially to the stability of banking system. In Macedonia, the effects of the crisis were felt during 2008-2009, and the National Bank of the Republic of Macedonia (NBRM) has immediately undertaken several measures in order to increase the banking sector stability. However, there is a need for an aggregate indicator to follow the banking sector development that will give an overall image of the banking sector condition. In this paper, a simple index of financial stability of the Macedonian banking sector is constructed, that will adequately reflect the effects of the crisis in 2008-2009. The index is based on the main financial stability determinants by CAMELS, using a selection method for the most representative financial indicators. Furthermore, the index will be compared with two other similar aggregate measures of financial or banks stability in order to test its performance.
Key words
Financial stability; Index; Banking; Aggregate indicator.
INTRODUCTION
collapse of several major banks, which spilled over from the banking sector into the other sectors of the economy.
Composite indices comprised of banks’ financial indicators (especially those published by the International Monetary Fund - IMF) are increasingly used as a basis for assessment of the stability of the financial system and the banking sector. Regulators mostly use financial indicators based on the CAMELS rating for ranking individual banks by their financial soundness and risk level. Furthermore, they calculate aggregate financial indicators for the overall banking sector to estimate its main risks and financial soundness level. There are numerous studies on financial stability that rely on the basic assumptions of CAMELS, which emphasize the importance of this method and its practical use, though there are, also, some studies that try to discredit its usefulness. Despite numerous controversies, this method still has a significant role in practice, especially in the central banks and international institutions, and its use is unavoidable in the assessment of the financial stability of individual banks and the banking system as a whole.
Although the effects of the crises were not as severe in Macedonia as they were in the developed countries, still the banking system showed signs of deceleration in its activities and weaknesses of the financial indicators. The regulator of the banking sector (NBRM) in order to supervise the financial stability calculates quarterly aggregate financial indicators for the banking system, including the basic groups of indicators given by CAMELS. However, there is a lack of publicly available aggregate measure (indicator, index) for the overall banking system that could be used in assessing financial stability and even building a model for prediction of future financial crisis.
This paper attempts to introduce additional elements in the analysis of the financial stability and to provide a potential tool for monitoring the banking sector, such as the index of financial stability of the banking sector to the affected stakeholders (regulators, investors, debtors, savers, public and private sector, etc.). Furthermore, the purpose of this paper is to estimate the index and to examine its ability to fully capture the performance and the state of the banking sector, as well as the impact of the separate factors in the model. The index will include the most representative financial indicators for financial stability of the banking sector chosen by the statistical method “principle component analysis”. Furthermore, the index will be compared with two other similar aggregate measures of financial or banks stability in order to test its performance.
FINANCIAL STABILITY
crisis from 2007-2009. However, the most encompassing definition is given by the ECB, which defines financial stability as a condition in which the financial system is capable of withstanding shocks, thereby reducing the likelihood of disruptions in the financial intermediation process, which are severe enough to significantly impair the allocation of savings to profitable investment opportunities (ECB, 2013). Therefore, financial stability is considered as a state of the financial system, which is closely associated with the risks reduction to minimum level and shocks resistance.
The Czech National Bank defines “financial stability as a situation where the financial system operates with no serious failures or undesirable impacts on the present and future development of the economy as a whole, while showing a high degree of resilience to shocks”. Financial stability may be disturbed both by processes inside the financial sector leading to the emergence of weak spots, and by strong shocks. Such shocks may arise, among other things, from the external environment, domestic macroeconomic developments, and the position of the main debtors and creditors of financial institutions, economic policies or changes in the institutional environment. Any interaction between weak spots and shocks can result in the collapse of major financial institutions and disruption of the functions of the financial system as regards financial intermediation and payments. In the extreme case, it may even lead to a financial crisis with adverse implications for the economy (CNB, 2013).
Domestic macroeconomic environment, international environment (external influences and spillovers) and the situation of the banking sector are typically considered as major determinants of the financial stability. The identification of most important determinants of financial stability is also affected by financial crises, which revise the existing determinants and usually change the perception of their impact respectively to the causes of the survived crisis, often changing the complete structure of the determinants. The financial crisis of 2007-2009 was a result of the mortgage and real estate markets inefficiencies, and spilled over to the other institutions, markets and economies, affecting mostly the less liquid institutions. Adopting Basel III and its recommendations is related to establishment of regulation in liquidity risk management and improvement of capital adequacy.
The banking sector has the main role and significant impact on the macroeconomic conditions. The importance of banks in the economy is proved by the recent financial crisis, which began partly because of the irresponsible bank management, investments in high-risk financial instruments, “adjustment” in financial reports and bonuses, when the regulation was loosened and there was lack of strict internal and external control, which is adequate to the financial innovations in banking. Many authors emphasize the importance of the banking system and its crucial role in economic growth (Levine, 1997 and 1998; Levine et al, 2000).
Considering the significant role of the banking sector for monetary and financial stability of the economy, the regulatory bodies, primarily the central banks and the international financial institutions, constantly follow its stability through identification and connection of the determinants and indicators of financial stability. The indicators of financial stability established by the IMF, which are applied by central banks on national level, are mostly in aggregate form for the entire banking system and are defined as macro prudential indicators. “These macroprudential indicators comprise both aggregated microprudential indicators of the health of individual financial institutions, and macroeconomic variables associated with financial system soundness. Aggregate microprudential indicators are primarily contemporaneous or lagging indicators of soundness; macroeconomic variables can signal imbalances that affect financial systems and are, therefore, leading indicators. Financial crises usually occur when both types of indicators point to vulnerabilities, that is, when financial institutions are weak and face macroeconomic shock. The ability to monitor financial soundness presupposes the existence of indicators that can be used as a basis for analyzing the current health and stability of the financial system. Indicators of the current health of the financial system are primarily derived by aggregating indicators of the health of individual financial institution. One commonly used framework for analyzing the health of individual institutions is the so-called CAMELS framework, which involves the analysis of six groups of indicators reflecting the health of financial institutions” (Evans et al, 2000). The CAMELS framework groups these indicators in six groups: capital adequacy, assets quality, management quality (performance), profitability, liquidity and interest rates and market sensitivity.
components of financial sector, such as capital market, private equity funds, pension funds and insurance companies, the microprudential indicators defined by the IMF are dominating. This is the case with the Romanian, Czech, Turkish, Albanian and Serbian indices.
FINANCIAL STABILITY IN MACEDONIA
Banks have a central role in the financial sector of Macedonia, too. Macedonian financial sector is characterized by a simple structure where the banking system is the most significant segment and the role of the non-deposit financial institutions is still small, while the share of the saving institutions is only 0.8% of the total asset of the banking system (NBRM, 2012).
EBRD (2010) pays special attention to the global financial crisis and its effects on transition economies, including Macedonia. Considering the macrofinancial vulnerability of most European developing countries and the size of the shock, it was expected that it would spill over quickly in transition countries. However, the crisis in the transition economies, including Macedonia, carries out in three phases: March 2008, December 2008 and March 2009. In March 2008, the signs of the crisis were obvious in some of transition economies, by the end of 2008 all transition economies felt the effects of the crisis to some extent, and in the first quarter of 2009 the crisis had already spread.
the results of the stress test simulations show resilience of the banking system to the simulated shocks. In addition, according to the NBRM Report for 2012, the liquidity risk is within acceptable parameters and liquidity assets grew in 2012, partly as result of the measures taken by NBRM and also as caution measures undertaken by banks management. In 2012, the comparison between financial stability indicators of the Macedonian banking sector and the banking sector of other 24 countries, including developed European countries and countries from the region, showed that the Macedonian banking system was among those with highest indices of stability. When compared by the capital adequacy ratio, Macedonian banking sector is in the upper part of the list of 18 analyzed countries. It can be concluded, by the EBRD and NBRM reports, that the Macedonian banking sector has been stable during and after the recent financial crisis. There have been difficulties in the private sector that affected the banking sector in the peak of the crisis (end of 2008 - beginning of 2009) that resulted in non-performing loans growth and higher credit risk. However, the undertaken measures from NBRM and the individual banks have maintained the banking sector stability and the risks within acceptable limits (EBRD, 2010 and 2013; NBRM, 2012 and 2013).
FINANCIAL STABILITY INDICES
The constructed index in this paper is based on similar methodologies used extracted from the literature on financial stability and financial stress. However the methodology is adapted to the local economic conditions of Macedonia as an emerging country and furthermore it is connected to the theoretical CAMELS rating. Usually the consulted work of the other authors encompassed usage of independent variables that are considered relevant for the assessment of the stability and vulnerability of the financial sector. The core function of these indices was historical comparison, and for some even comparison between separate economies.
Illing and Liu (2003) have created an index of financial stress for Canada aiming to provide a quantitative score for the macroeconomic financial stress. They included measures for the possible loss, risk and insecurity of banking, foreign exchange rates, and debt and capital market. Similarly, Hanschel and Monnin (2005) have created an index for financial stress for Switzerland. This index measures the level of stress of the banking sector in a given moment. In addition, Van den End (2006) creates an index for the financial stability for the Netherlands including the interest rates, foreign exchange rates, real estate prices and indices of financial institutions’ stocks. These indices are used as indicators for stress and crises prediction, and not only that contain microprudential indicators for the banking sector, but also macroeconomic indicators and indicators for the other financial markets.
countries, these indices are mostly comprised of microprudential indicators defined by the IMF. Thus, Albulescu (2010) has developed aggregate index for stability of financial system in Romania, while Geršl and Hermánek (2006) calculate an aggregate indicator for financial stability in the Czech Republic, based on the indicators for financial stability of the IMF. The Central Bank of Turkey (2006), in its regular report on financial stability in 2005 introduced the index for financial stability, based on the CAMELS methodology. This aggregate index is based on the assumptions similar to the indices of financial stress for Canada and Switzerland. This index is calculated as an arithmetic mean of a set of six sub-indices. In 2011, the National Bank of Albania has calculated similar index retrograding from 2005 to 2011. The National Bank of Serbia (2011) calculates an aggregate indicator on financial stability in order to compare the state in banking systems and separated economies by the method of elimination and choice that are transmitting reality (ELECTRA MLO - ELimination Et Choix Traduisant la REalité). The benefit of such aggregate indices is greater in terms of a national economy for monitoring the conditions of the banking sector continuously and for historical comparison. Their usage for comparing separate and individual economies is less effective due to differences in accounting policies and the lack of standardization.
management. IMF has identified a set of indicators based on their long-term experience and knowledge gained through monitoring the financial sector, technical assistance and their program activities.
The aggregate microprudential indicators are based on the CAMELS framework, which includes analysis of six groups of indicators that reflect the financial health of the financial institutions, namely: capital adequacy, assets quality, management soundness, profitability, liquidity and sensitivity to market risk. These six areas are useful in the analysis of the various possible areas of vulnerability. The CAMEL rating model was created in 1970’s by the US federal regulators in order to provide structured approach to the assessment of the banks. Later, this model was upgraded with a sensitivity component that encompasses banks’ level of reaction on the changes in market risk and it was called CAMELS. The model has a wide range of usage by the international financial institutions but also by national central banks and individual financial institutions, in order to evaluate the financial state and risk exposure.
Similarly to other central banks, NBRM acknowledges the CAMELS approach using it for the classification of indicators that signal certain risks. Thus, NBRM regularly calculates the indicators for financial stability at the individual bank level when it evaluates their rating, but also at the level of the banking system as a whole. However, there is a lack of aggregate indicator or index for financial stability or banking sector stability that will encompass all determinants of financial stability and will be easier to follow by the relevant stakeholders in decision making, together with in-depth qualitative analysis.
METHODOLOGY
The research in this study is implemented through several methodological procedures:
- Descriptive statistics;
- Transformation of variables - standardization;
- Analysis of the correlation matrix;
- Principle component analysis with oblique rotation;
- Checking the dimensions of financial stability by CAMELS with the results of the principle component analysis;
- Principle component analysis for each dimension separately in order to choose the most representative financial indicator;
- Construction of sub-indices for each individual dimension;
- Comparison of the constructed index with two other measures of financial soundness: Shar’s s-score and Boyd and De Nicolo’s z-score.
SELECTION OF VARIABLES
In order to construct a simple index of financial stability in Macedonia, the most explanatory financial indicators are selected from a wide range of indicators usually used in the theory and practice in assessment of the financial condition of the banks and bank’s risks. As a pragmatic solution, the financial indicators at the level of the whole banking sector, regularly published in NBRM’s quarterly reports for financial stability for the period from 31.12.2005 to 31.12.2012 are taken into consideration as an initial base. Furthermore, only indicators that are relevant and important by the classification of CAMELS are selected. For example, indicators for the structure of liquidity and credit portfolio are considered as a second range and less important than the direct liquidity indicators (the share of high liquid assets in total bank assets) and credit quality (the share of non-functional loans in total loans). Additionally, those indicators whose information is already included in some other indicator as well as the indicators that have discontinued time series and contain less information for the CAMELS category are excluded from the analysis. According to CAMELS, indicators are classified as indicators for capital adequacy, quality assets, management quality, profitability, liquidity and market sensitivity. Considering that NBRM do not publish indicators for the quality and efficiency of the management, the choice of the indicators is made according to the theory and the studies in this area such as Chowdhury (2011). The variables are exclusively quantitative because of the attempt of the study to result with a quantitative index. In sum, there are 21 financial indicators used in the initial analysis of this paper (see Annex 1).
The financial indicators that are included in the analysis are being transformed, i.e. standardized in order to create indicators that are on the same scale and to avoid some of the variables to have greater influence on the index then due to scale measurement. The variables are standardized by subtracting the sample mean from each individual observation in the sample and further on the difference is divided with the standard deviation of the sample. The standardization of variables is conducted by the formula (1).
(1)
where z is the standardized value or z-score, x is the observation of the variable; µ is
the sample mean and is the standard deviation of the sample.
distance from the mean measured in units of standard deviations. Positive z-scores lie above the mean, negative z-scores below the mean. This type of statistic is called a measure of relative standing. Standardization of financial indicators is often applied in the construction of composite variables, especially in financial stability or financial stress indices, such as the indices of Hanschel and Monnin (2005),the National Bank of Turkey, the National Bank of Albania and others. Standardization is also recommended in the guidelines for constructing composite indicators by Saisana and Tarantola (2002).
The financial indicators that have a negative impact on the financial stability of the banking sector went through additional transformation and received negative sign (multiplied by "-1"), in order to calculate sub-indices with exclusively positive impact on the aggregate index, i.e. their growth to have a positive effect to the growth of the aggregate index and vice versa. According to Hollo et al, (2012) in most of the studies the authors use standardization of the data in order to construct sub-indices which further are aggregated by using equal ponders or with ponders calculated by principle component analysis.
The index, the subject of this study, is calculated as an arithmetic mean of the six indices. The method of calculating the index as an arithmetic mean of the sub-indices is used by the National Bank of Turkey and National Bank of Albania. Also, according to Saisana and Tarantola (2002) this method of aggregation of the indicators is used in calculating the human development index and the index of technological advancements of the United Nations, the two synthetic indices of Isla for environment, the index of sustainable and economic wealth of CES and NEF etc. The index of the financial stability for the Macedonian banking sector is calculated by the formula (2).
(2)
where n is the number of variables (sub-indices), Xj,t is the j-the variable in time t.
A negative value of the index means that the index is below the sample mean, while a positive value of the index means that it is above the sample mean. The index shows the distance of its value from the sample mean expressed in number of standard deviations.
while others rely on the experts’ opinion on the importance of the individual indicators. However, one of the most used methods is the equal-weights system, especially in the case of highly-correlated indicators. Supporters of equal-weights believe that if the weights obtained by principle component analysis are being used, indices might be ineffective, because sometimes the indicators have negative values, even though they have positive effects on the dimension that they measure. For example, equal weights of indicators are used in the following indices: the OECD composite leading indicators, the index of environmental sustainability of the World Economic Forum, the indicator for economic sentiment of the European Commission, the aggregate innovation index of the European Commission (DG Enterprise), the index of financial stability of the banking sector of the National Bank of the Czech Republic, while the National Bank of Turkey and the National Bank of Albania use equal weights for all sub-indices, except for the quality of asset.
The sub-indices (I) are calculated by the formula (3).
(3)
where n is the number of the financial indicators, j is the weight of the appropriate
indicator, Xj,y is j-the financial indicator in time t, is the sample means of the ј-the
indicator, and 𝜎 is the standard deviation of the financial indicator. The last part of the formula represents the standardization process of the financial indicators.
The applied principle component analysis on the initial sample using the oblique rotation method (due to high correlation of the variables-indicators) has confirmed only four dimensions of the financial stability by CAMELS (all of the results from the principle component analysis are presented in Annex 1) such as: capital adequacy, assets quality, liquidity and profitability, while management and market sensitivity are present in all four dimensions. This is somehow expected and predictable, especially considering the role of the management with its central in risk management, i.e. all dimensions of financial stability depend on management quality and effectiveness. Management decisions also affect capital adequacy, assets quality, liquidity and profitability of the banks. Additionally, market sensitivity, as measured by the interest rate risk and the foreign currency risk, has impact on the other dimensions of financial stability, because they depend on the interest and currency structure of loans, deposits, assets and liabilities, and liquid assets.
analysis. The total variance is explained by the four components with the percentage of 92.45% and the variance of each variable is explained by a component, with over 77%, which is a significant result. The indicators for capital adequacy mostly pertain to the first component, the assets quality indicators are mostly attached to the second component, the liquidity indicators to the third component, while the profitability indicators are mostly related to the fourth component.
However, the purpose of this paper is not to question and review the theoretical background of CAMELS. Although there are four identified basic dimensions in the principle component analysis, in the calculation of the financial stability index in Macedonia all the six dimensions of the CAMELS-based financial stability are taken into consideration. Therefore, aiming to lower the number of variables included in the index of financial stability and choosing the most representative indicators for each of the separate six dimensions for financial stability according to CAMELS, we perform the principle component analysis without rotation (because the number of variables in separate individual dimensions is small) for each of the dimensions. The goal of this procedure is to include two or maximum three most representative and reliable indicators for each of the six dimensions in the index of financial stability, in line with other relevant cases (the central banks of Turkey, Albania, and Czech Republic). Thus, after performing the separate principle component analysis, the initial twenty-one basic indicators has decreased to the most representative eleven indicators (see Annex 2).
For all individual dimensions of financial stability, the tests show high correlation between the variables and justify the application of the principle component analysis (the results of the principle component analysis for each of the individual dimensions of the financial stability are presented in Annex 2). In addition, only one component explains a big part of the variables’ variance.
In the separate principle component analyses, based on the value of correlation coefficient between the component and the variables, we select the following indicators as most representative for each individual dimension:
o Capital adequacy: capital adequacy ratio (0.971), Tier I capital and risk weighted assets ratio (0.963), and capital and reserves to total assets ratio (0.957);
o Assets quality: total allocated loss-loan provisions to non-functional loans ratio (0.910), and non-functional loans to gross loans ratio (0.903); and
o Management: loan to deposit ratio (-0.917) and loan growth (0.849).
Although asset growth is right behind these two indicators, as in the case with most of the dimensions we include only two indicators:
o Liquidity: here we consider only two indicators, highly-liquid assets to the total assets ratio, and highly-liquid assets to short term liabilities (contractual maturity) ratio, that are both included and highly-correlated (0.988); and
o Market sensitivity: net open foreign currency position to own funds ratio (0.976) and the spread between the interest rates on denar-denominated loans and deposits (0.969).
CONSTRUCTION OF THE FINANCIAL STABILITY INDEX FOR THE BANKING SECTOR IN MACEDONIA
As we previously mentioned, the index is calculated as an arithmetic mean of six sub-indices: the sub-index for capital adequacy, the sub-index for assets quality, and the sub-index for management, the sub-index for profitability, the sub-index for liquidity and the sub-index for market sensitivity. Each sub-index is calculated as a weighted-sum of the previously chosen most representative indicators for the dimensions of financial stability by the principle component analysis method. In each sub-index we use the method of equal weights for the indicators that are included, hence for the sub-index composed of three indicators their individual weight is 0.33, while for the sub-index composed of two indicators their individual weights are 0.50. The sub-index for market sensitivity is composed of one indicator for interest risk and one indicator for foreign currency risk, so their individual weights are 0.50.
RESULTS AND DISCUSSION
-.6 -.4 -.2 .0 .2 .4 .6 05 Q 4 06 Q 1 06 Q 2 06 Q 3 06 Q 4 07 Q 1 07 Q 2 07 Q 3 07 Q 4 08 Q 1 08 Q 2 08 Q 3 08 Q 4 09 Q 1 09 Q 2 09 Q 3 09 Q 4 10 Q 1 10 Q 2 10 Q 3 10 Q 4 11 Q 1 11 Q 2 11 Q 3 11 Q 4 12 Q 1 12 Q 2 12 Q 3 12 Q 4 CAMELS
FIG 1. FINANCIAL STABILITY FOR THE BANKING SECTOR IN MACEDONIA (2005Q4 - 2012Q4)
Figure 2 presents the financial stability index (CAMELS) along with the sub-indices for the period 2005-2012: capital adequacy sub-index (C), assets quality sub-index (AQ), management sub-index (M), profitability sub-index (E), liquidity sub-index (L) and market sensitivity sub-index (S).
-2 -1 0 1 2 3 05 Q 4 06 Q 1 06 Q 2 06 Q 3 06 Q 4 07 Q 1 07 Q 2 07 Q 3 07 Q 4 08 Q 1 08 Q 2 08 Q 3 08 Q 4 09 Q 1 09 Q 2 09 Q 3 09 Q 4 10 Q 1 10 Q 2 10 Q 3 10 Q 4 11 Q 1 11 Q 2 11 Q 3 11 Q 4 12 Q 1 12 Q 2 12 Q 3 12 Q 4
CAMELS C AQ
M E L
S
FIG 2. DECOMPOSITION OF IFS IN MACEDONIA (2005Q4 - 2012Q4)
Macedonian banking sector represents the condition of the banking sector well enough (the values of the index and sub-indices are presented in Annex 3).
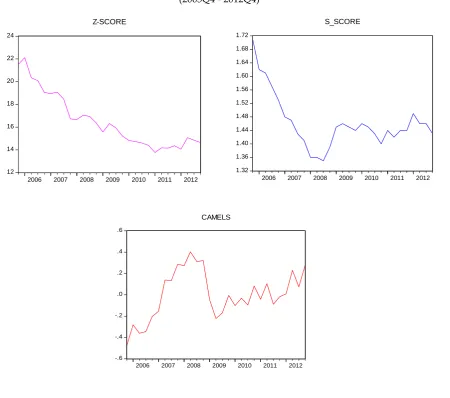
The performance of financial stability index is checked by its comparison with other aggregate financial stability indicators, the Shar’s s-score (Shar, 2010) and Boyd and De Nicolo’s z-score (Boyd & De Nicolo, 2005). The calculated aggregate indicators and the index for the Macedonian banking sector are analyzed in order to identify if they move in same or opposite direction and if they adequately reflect positive and negative events in the economy.
Shar’s model categorizes banks as solvent and insolvent on basis of IMF recommendations for control of vulnerability of financial systems. The same method is used when calculating the aggregate s-score for Macedonian banking sector for the period 31.12.2005 - 31.12.2012 on quarterly basis by the formula (4).
S = 1.5X1+1.2X2 +3.5X3+0.6X4+0.3X5+0.4X6 (4)
where:
X1 is Capital to Asset ratio;
X2 is Shareholders capital to total assets ratio;
X3 is Capital adequacy coefficient;
X4 is Non-functional loans to total loans ratio;
X5 is Costs to Revenues ratio;
X6 is Total loans to Assets ratio;
“S” is solvency: 50% < S < 70%
Banks that have “S“ value above 70% are considered solvent and are called super-sound banks, while banks with “S” value under 50% are considered insolvent. The area between 50% и 70% is defined as gray zone due to the risk of wrong classification. This model is focused on capital adequacy, asset quality and profitability (earnings). Every indicator in the formula has different weight depending of their estimated importance and impact on the solvency indicator. Boyd and De Nicolo’s z-score is calculated by the following equation:
Z-Score=(ROAi,t+CARi,t)/SDROA (5)
GRAPH 3. IFS, S-SCORE AND Z-SCORE FOR MACEDONIAN BANKING SECTOR (2005Q4 - 2012Q4)
12 14 16 18 20 22 24
2006 2007 2008 2009 2010 2011 2012 Z-SCORE
1.32 1.36 1.40 1.44 1.48 1.52 1.56 1.60 1.64 1.68 1.72
2006 2007 2008 2009 2010 2011 2012 S_SCORE
-.6 -.4 -.2 .0 .2 .4 .6
2006 2007 2008 2009 2010 2011 2012
CAMELS
TABLE 1. CORRELATION MATRIX BETWEEN IFS, Z-SCORE AND S-SCORE FOR MACEDONIAN BANKING SECTOR (2005Q4 - 2012Q4)
CAMELS S_SCORE Z_S CAMELS 1.000000 -0.836024 -0.452394 S_SCORE -0.836024 1.000000 0.681035 Z_S -0.452394 0.681035 1.000000
CONCLUSION
included. The index has few limitations, such as the short time series (quarterly published by the NBRM) and the financial indicators that are mainly based on accounting and historical values. The index has positive sides and is well reflective on the condition of the banking sector but it should be used in combination with other indicators, with focus on the qualitative analysis in order make accurate conclusions. Nevertheless, it is a good foundation for constructing other indicators, such the index of financial stability of the financial sector as a whole or indices of financial stress that are used for crises prediction or it could be used as a variable in macroeconomic models. On the other hand, the index could be also used for predicting the reactions of the banking sector in conditions of negative shocks. Although macro stress-tests for system have numerous limitations when it comes to crises prediction, they still have their good side in the possibility for creating a wider picture for the future macroeconomic perspectives, with the financial system as a whole and the unique approach for assessment of risk exposure of all institutions. Still, such a macro stress-test could be useful for considering the aspect of financial stability when defining the measurements of monetary and fiscal policy, i.e. when defining the level of influence on the vulnerability of the financial system.
The index of financial stability of the banking sector in Macedonia shows that the banking system has been continuously stable as a result of the previous conservative policies of the banks and NBRM. This is confirmed with the stability that Macedonian banking sector showed after the harsh effects of the last global economic crises that were absorbed quite quickly without more serious consequences.
REFERENCES
Albulescu, C. T. (2010). Forecasting the Romanian Financial Sector Stability Using a Stochastic Simulation Model, Journal of Economic Forecasting, 0(1), 81-98.
Bank of Albania. (2011). Financial stability report 2011 H1.
Boyd, J. & De Nicoló G. (2005). The Theory of Bank Risk-Taking and Competition Revisited, Journal of Finance, 60(3), 1329-1343.
Central Bank of the Republic of Turkey. (2006). Financial Stability Report, 2.
Czech National Bank. (2013). Financial stability, Prague: Czech National Bank. Available at: http://www.cnb.cz/en/financial_stability/ (accessed on 4.5.2013).
European Bank for Reconstruction and Development (EBRD). (2010). Transition report 2009 - Transition in crisis, London.
European Bank for Reconstruction and Development (EBRD). (2013). Transition report 2012 - Integration across borders, London.
European Central Bank (ECB). (2013). What is financial stability?, Frankfurt A/M: European Central Bank. Available at: http://www.ecb.europa.eu/pub/fsr/html/index. en.html, (accessed on 04.05.2013).
Geršl, A. & Hermánek, J. (2006). Financial Stability Indicators: Advantages and Disadvantages of their Use in the Assessment of Financial System Stability, Occaisonal Publications – Chapters in Edited Volumes, in: Financial Stability Report 2006, chapter 0, Czech National Bank (CNB), Research Department, 69-79.
Hanschel, E. & Monnin, P. (2005). Measuring and forecasting stress in the banking sector: evidence from Switzerland, BIS papers chapters, in: Bank for International Settlements (ed.), Investigating the relationship between the financial and real economy, 22, 43-49.
Hollo, D., Kremer, M. & Lo Duca, M. (2012). CISS - A Composite Indicator of Systemic Stress in the Financial System, Available at SSRN: http://ssrn.com/abstract=1611717 or http://dx.doi.org/10.2139/ssrn.1611717 (accessed on 5.4.2013).
Illing, M. & Liu, Y. (2003). An Index of Financial Stress for Canada, Bank of Canada Working Paper 2003-14.
Levine, R. (1997). Financial Development and Economic growth: Views and agenda, Journal of Economic Literature, 35, 688-726.
Levine, R. (1998). The Legal Environment, Banks and Long-Run Economic Growth, Journal of Money, Credit and Banking, 30(3), 596-613.
Levine, R. & Beck, T. (2000). Finance and the Sources of Growth, Journal of Financial Economics, 58(1-2), 261-300.
National Bank of Republic of Macedonia. (2012). Financial stability report of the Macedonian banking sector in 2011, Skopje.
National Bank of Republic of Macedonia. (2013). Macedonian banking system report in 2012, Skopje.
National Bank of Serbia (2012), Annual Financial Stability Report for 2011.
Saisana, M. & Tarantola, S. (2002). State-of-the-art Report on Current Methodologies and Practices for Composite Indicator Development, EUR 20408 EN, Institute for the Protection and Security of the Citizen Technological and Economic Risk ManagementI-21020 I Joint Research Centre European Commission Composite Indicator of Systemic Stress (CISS), 1-72.
Shar, A. H. (2010). Performance Evaluation of Banking Sector in Pakistan: An Application of Bankometer, International Journal of Business and Management, 5(9), 81-86.
ANNEX 1
Principal component analysis of the initial set of variables (financial indicators)
Pattern Matrix
Component
1 2 3 4
Capital adequacy ratio -0.982 -0.196 0.010 0.240 Regulatory Tier I capital/risk weighted assets -0.961 -0.082 -0.121 0.082 Local currency spreads between reference lending and
deposit rates
0.911 -0.104 0.092 0.108
Equity and reserves to total assets -0.832 -0.150 -0.367 0.136 Loans to deposits ratio 0.797 -0.027 -0.159 0.395 NPLs / gross loans 0.780 0.485 -0.098 -0.188 Foreign currency spreads between reference lending and
deposit rates
0.728 -0.217 -0.049 0.420
Net open foreign exchange position / equity 0.712 -0.109 0.151 0.356 Interest margin/gross income 0.591 -0.224 0.129 0.405 NPLs net of total provision / equity 0.058 0.973 0.163 0.054 Total provisions to non-performing loans 0.088 0.963 0.052 0.013 Interbank market interest rate 0.062 0.305 0.909 -0.049 High liquid assets / total assets 0.184 -0.017 0.885 0.070 High liquid assets to total short-term liabilities
(contractual maturity)
0.096 -0.033 0.863 0.211
Large exposures /equity 0.298 0.532 -0.614 0.206 Personnel expenses/noninterest expenses 0.445 0.194 0.524 0.331 Asset growth 0.013 -0.305 0.120 -0.961 ROAE -0.057 0.303 -0.268 -0.722 ROAA -0.204 0.237 -0.274 -0.682 Noninterest expenses/gross income 0.039 0.166 -0.361 -0.678 Loan growth -0.412 0.463 -0.023 -0.503 Extraction Method: Principal Component Analysis.
Rotation Method: Oblimin with Kaiser Normalization. Rotation converged in 14 iterations.
KMO and Bartlett's Test
Kaiser-Meyer-Olkin Measure of Sampling Adequacy. 0.587 Bartlett's Test of Sphericity Approx. Chi-Square 1274.606
df 210
Sig. 0.000
Communalities Extraction
Capital adequacy ratio 0.969
Regulatory Tier I capital/risk weighted assets 0.988 Equity and reserves to Assets 0.984 NPLs net of total provision / own funds 0.947
NPLs / gross loans 0.968
Total provisions to Non-Performing Loans 0.962
Large exposures /own funds 0.796
ROAA 0.952
ROAE 0.944
Noninterest expenses/gross income 0.774 Personnel expenses/noninterest expenses 0.946 Local currency spreads between reference lending and deposit rates 0.962 Foreign currency spreads between reference lending and deposit rates 0.956 Interbank market interest rate 0.873 Net open foreign exchange position / own funds 0.962 High liquid assets / Assets 0.962 High liquid assets to total short-term liabilities (contractual maturity) 0.958
Assets growth 0.831
Loans growth 0.855
Loans to deposits ratio 0.981
Extraction Method: Principal Component Analysis.
Component Correlation Matrix
Component 1 2 3 4
dim ensi on0
Total Variance Explained
Compon ent
Initial Eigenvalues Extraction Sums of Squared Loadings
Rotation Sums of Squared
Loadings
Total % of Variance
Cumulative
% Total
% of Variance
Cumulative
% Total
d
im
ens
io
n
0
1 11.250 53.572 53.572 11.250 53.572 53.572 9.642 2 4.864 23.163 76.735 4.864 23.163 76.735 4.274 3 2.353 11.206 87.941 2.353 11.206 87.941 5.450 4 0.947 4.509 92.450 0.947 4.509 92.450 7.009 5 0.445 2.119 94.568
6 0.297 1.415 95.984 7 0.266 1.267 97.250 8 0.177 0.842 98.093 9 0.138 0.657 98.750 10 0.084 0.399 99.149 11 0.065 0.310 99.460 12 0.036 0.173 99.633 13 0.030 0.141 99.773 14 0.025 0.119 99.892 15 0.008 0.038 99.931 16 0.007 0.036 99.966 17 0.004 0.018 99.985 18 0.002 0.008 99.993 19 0.001 0.004 99.997 20 0.001 0.002 99.999 21 0.000 0.001 100.000 Extraction Method: Principal Component Analysis.
ANNEX 2
Principal component analysis of the individual dimensions of the financial stability
Component Matrixa
Component 1
Capital adequacy ratio 0.971
Regulatory Tier I capital/risk weighted assets 0.963
Equity and reserves to Assets 0.957
NPLs net of total provision / own funds -0.648
Extraction Method: Principal Component Analysis. a. 1 components extracted.
Component Matrixa
Component 1
Total provisions to Non-Performing Loans 0.910
Non-Performing Loans / Gross Loans 0.903
Large exposures /own funds 0.810
Extraction Method: Principal Component Analysis. a. 1 components extracted.
Component Matrixa
Component 1
ROAA 0.976
ROAE 0.940
Interest margin/gross income -0.880
Noninterest expenses/gross income 0.868
Personnel expenses/noninterest expenses -0.805
Extraction Method: Principal Component Analysis. a. 1 components extracted.
Component Matrixa
Component 1
Net open foreign exchange position / own funds 0.976
Local currency spreads between reference lending and deposit rates 0.969 Foreign currency spreads between reference lending and deposit rates 0.939
Interbank market interest rate 0.491
Extraction Method: Principal Component Analysis. a. 1 components extracted.
Component Matrixa
Component 1
High liquid assets / Assets 0.997
High liquid assets to total short-term liabilities (contractual maturity) 0.997 Extraction Method: Principal Component Analysis.
a. 1 components extracted.
Component Matrixa
Component 1
Loans to Deposits ratio -0.917
Loans growth 0.849
Assets growth 0.847
ANNEX 3
The index of financial stability of the banking sector and its sub-indices
obs CAMELS C A M E L S
2005Q4 -0.478499 2.6994 -1.950000 -0.840395 0.155 -1.240 -1.695 2006Q1 -0.280667 2.3496 -1.625000 -0.483600 0.965 -1.135 -1.755 2006Q2 -0.360507 1.8612 -1.345000 0.080760 0.175 -1.080 -1.855 2006Q3 -0.344238 1.5576 -1.065000 -0.913030 0.740 -1.030 -1.355 2006Q4 -0.202968 0.8151 -0.755000 -0.007905 0.890 -0.670 -1.490 2007Q1 -0.154538 0.6336 -0.185000 -0.200830 0.870 -0.695 -1.350 2007Q2 0.139423 0.4884 -0.125000 -0.036860 1.765 -0.170 -1.085 2007Q3 0.132668 0.1980 0.245000 0.408010 1.315 -0.525 -0.845 2007Q4 0.287839 -0.1815 1.355000 0.138535 1.145 -0.140 -0.590 2008Q1 0.271908 -0.5544 1.365000 0.690850 1.035 -0.695 -0.210 2008Q2 0.402922 -0.7689 1.565000 0.676430 1.705 -0.675 -0.085 2008Q3 0.311355 -0.9174 1.700000 0.620530 1.305 -0.910 0.070 2008Q4 0.320559 -0.5973 1.840000 0.570655 0.695 -0.875 0.290 2009Q1 -0.045888 -0.3498 0.820000 0.504470 -0.945 -1.060 0.755 2009Q2 -0.221814 -0.3201 -0.025000 0.014215 -0.555 -1.075 0.630 2009Q3 -0.170618 -0.4290 -0.340000 -0.149710 -0.295 -0.655 0.845 2009Q4 -0.005443 -0.5874 0.050000 0.114745 -0.370 -0.060 0.820 2010Q1 -0.100953 -0.3762 -0.425000 0.005485 -1.060 0.275 0.975 2010Q2 -0.031793 -0.5742 -0.480000 0.073445 -0.750 0.645 0.895 2010Q3 -0.095979 -0.6798 -0.950000 0.038925 -0.620 0.705 0.930 2010Q4 0.082671 -0.8976 -0.030000 -0.256375 -0.135 1.015 0.800 2011Q1 -0.041438 -0.5412 0.145000 -0.077430 -1.380 0.820 0.785 2011Q2 0.104931 -0.6303 0.280000 0.099885 -0.920 0.940 0.860 2011Q3 -0.088776 -0.5643 0.070000 -0.198355 -1.090 0.645 0.605 2011Q4 -0.017986 -0.5412 -0.060000 -0.286715 -0.720 1.085 0.415 2012Q1 0.008923 -0.1980 0.025000 -0.178465 -1.610 1.385 0.630 2012Q2 0.230516 -0.1947 0.109995 0.057800 -0.745 1.410 0.745 2012Q3 0.074662 -0.3201 -0.385000 -0.246925 -0.885 1.665 0.620 2012Q4 0.278711 -0.3696 0.180000 -0.218135 -0.655 2.105 0.630