Volume 3, Issue 4, April 2014
Page 74
ABSTRACT
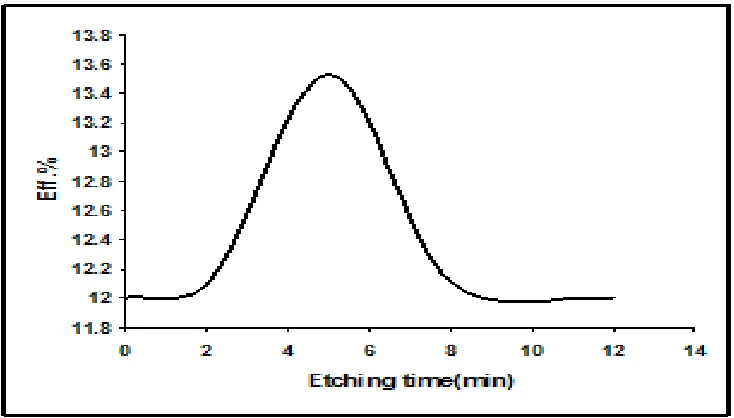
The experimental evidence of the effect of photochemical etching on the efficiency of a silicon photovoltaic solar cell is demonstrated and investigated for different etching times. Porous silicon cell is created with submicron diameter by using laser assisted chemical etching to provide an efficient anti-reflective layer. Optical microscope studies for the solar cell surface were taken before and after the etching process. Optical reflection in the range of (250-800nm) bulk and porous silicon solar cell were investigated to show that the reflectance for cells surface is decreased about 10 times at optimum etching time (5 min) compared with unetched sample (bulk) and the spectrum is shifted to the blue region due to the quantum confinement effect. The results show that the efficiency of the solar cell is enhanced from 12% to 13.5% due to formation of a porous layer which enhances the absorption via radiation trapping..
Keyword: porous silicon, solar cell, photo-chemical etching, laser, and Efficiency
1.
INTRODUCTION
Owing to the wide-ranging of possible technological and applications of porous silicon (PS) in materials science, biosensors, optical interconnection, amplifiers, modulators and switches opto-electronic devices. Research studies and characterizing have been recently increasingly carried out under a wide range of experimental conditions [1-4]. Silicon has been studied intensively since the discovery scoped by Canham that even at room temperature porous silicon formed on silicon wafers using etching, exhibits photo-luminescent and electro-luminescent properties similar to those properties of a semiconductor with a direct energy gap [5]. Since then, a large amount of investigations have been devoted to the PL and absorption measurements of PS [6-11]. In spite of this attention paid to the PS researches, little studies are directed towards the enhancement of the efficiency of silicon solar cells. Yet, several possible methods of using porous silicon to improve the performance of solar cells have been proposed. In fact there are many reasons for the dominance of Si in photovoltaic (PV) such as stable performance, low module manufacturing cost, and mostly non-toxic materials used in the final product, more over it was shown that a porous silicon-etched silicon surface has excellent anti-reflection properties [12,13]. Such facilities encourage the researches to make use of the properties of the PS in the field of PV.
Porous silicon layers can be easily produced on silicon surfaces by photo-chemical or stain etching at very low cost. Usually, the PS samples are produced by etching of Si wafers in hydrofluoric (HF) solution and the pore diameter can be controlled varied from a few nanometers up to several hundred nanometers by adjusting the etching parameters [14,15]. Researchers have been interested in surface texture of solar cells in order to create a tool to improve their conversion energy. Creating porous silicon surface in the solar cells may provide light trapping, a selective emitter and an efficient antireflective layer to the long wavelength also a reduction in the reflected light from the surface is established[16]. PS formation is a self –regulated mechanism, with whole depletion as the limiting agent. The dissolution reaction start at defects on the surface, the pores is formed and their walls are eroded until they are empted of the holes [17]. Here we present our results concerning the enhancement of silicon solar cell by using nonporous silicon formed by a photochemical etching process.
2.
EXPERMENTAL PROCEDURE
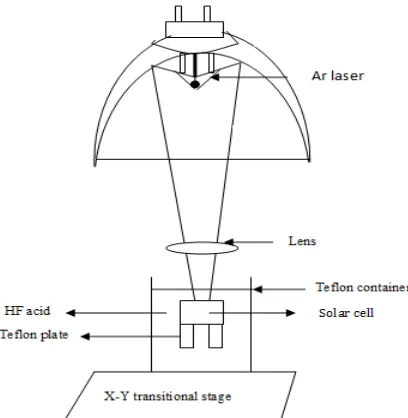
The samples were prepared by etching silicon solar cells. Figure (1) shows a schematic diagram of the experimental set-up for the laser induced etching. A commercially available Si solar cell was immersed in 40% Hydrofluoric acid placed in a Teflon container and was supported on two Teflon plates. Laser etching was done by using an argon–ion laser
with photon energy of 2.54 eV (λ= 488 nm). The beam was focused to a circular spot of 1.5mm diameter with a power
density of 12 W cm−2. Etching time is varied from (2-12min), subsequently the samples were rinsed with ethanol and
dried with filtered N2.
In this work, structures of etched silicon solar cell by photochemical etching were investigated by optical microscope, optical reflectance analyzer and scanning probe image processor. The Isc, Voc, Imax, Vmax cell efficiency of the etched
solar cell were carried out and analyzed in the laboratory using a sun simulator lamp.
Efficiency response of a silicon solar cell to the
photo-chemical etching process
Zaydoon T. Mohammad Noori
Volume 3, Issue 4, April 2014
Page 75
Figure 1: The schematic diagram of the Laser- assisted etching process.
3. RESULTS AND DISCUSION
The efficiency enhancement is achieved by formation of porous silicon in the solar cell by photochemical etching method. Surface morphology is studied before and after etching.
1-study of surface morphology: a- surface morphology before etching:
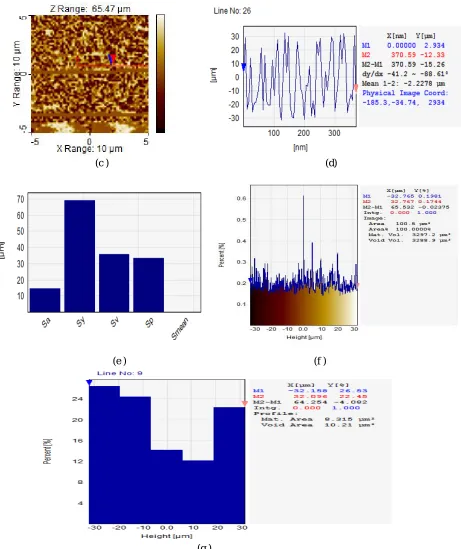
In order to study the effect of etching on the properties of the sample, we made a comparative study between the samples before and after the etching process. Figure (2-a) represents the microscopic photo before etching process and the figure (2-b) represents the three dimensional view of the same sample as detected by scanning probe. While figure (2-c) illustrate the photo of the magnified sample before etching , figure (2-d) shows the height and valley profiles measured along the sample surface. Scale: 88 nm per pixel, figure (2-e) shows a histogram of the surface roughness results for the silicon solar cell before etching, (2-f) illustrates the height percentage of the surface particles, (2- g) demonstrates a histogram of the height percentage of the surface particles . The roughness analysis histogram is detailed in figure (2-e). The results show the followings: roughness average (sa) =14702. nm, peak- peak (Sy) = 68966.3nm, max valley depth (Sv )= 35794.5 nm, max peak height (Sp)= 33171.8nm, mean height (Smean) = -1.25398E-005nm.
More details of the surface morphology are declared in figures (2-f)and figure (2-g ), the former shows the height percentage of the surface particles, and the latter shows same results in a histogram.
Volume 3, Issue 4, April 2014
Page 76
(c ) (d)
(e ) (f )
(g )
Figure (2): the solar cell surface analysis before etching , (a) represents the microscopic photo before etching process, (2-b) represents the three dimensional view of the same sample as detected by scanning probe, (2-c) is a magnified photo of the surface of a silicon solar cell before etching. (2-d) analysis panel showing the height and valley profiles along the sample surface. ,(2-e) shows a histogram of the surface roughness results, (2-f) illustrates the height percentage of the surface particles, (2- g) demonstrates a histogram of the height percentage of the surface particles
b- Surface morphology after etching:
Volume 3, Issue 4, April 2014
Page 77
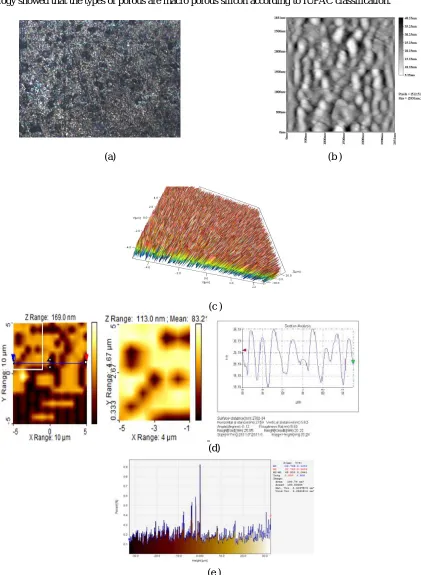
Also the profile analysis provides the given values: roughness average (Sa) =16027 nm, Surface skewness (Ssk) =0.0663, Peak to peak (Sy) = 66413 nm, Max. valley depth (Sv) =33354.9 nm, Max. peak height (Sp)= 33058.3 nm and Mean height (S mean) =1.724enm.Comparing the figures (3) with the figures (2), we can observe a random distribution of submicron ablation traces porous structure are formed at the surface with diameter bout 1 µm for optimum photochemical etching time (5min). The morphology showed that the types of porous are macro porous silicon according to IUPAC classification.
(a) (b )
(c )
(d)
(e )
Figure (3): The surface morphology of PS after etching, (3-a) and (3-b) microscopic photo, (3-c) 3D profile, (3-d) two magnified top- down photos with surface profile analysis of the etched solar cell, (2-e) the percentage of height analysis for the etched solar cell.
Volume 3, Issue 4, April 2014
Page 78
Figure (4) represents the reflectivity chart for both silicon solar cell compared with non- etched cell. The reduction of surface reflectivity via surface etching is obvious. This increment is attributed to the surface roughness.
Figure (4): The reflectance spectrum of the solar cell before etching and after etching (5min).
0 0.2 0.4 0.6 0.8 1 1.2
0 200 400 600 800 1000
wavelength
a
b
s
o
rb
a
n
c
e
Figure (5): The absorbance versus wavelength for the solar cell after etching (5min).
It is clear from figure (5) that the etched cell (which has a band gap 1.77 eV) is more efficient to absorb the visible region of the solar spectrum, without absorbing other regions of the spectrum.
Volume 3, Issue 4, April 2014
Page 79
Figure (6) :The efficiency versus etching time of the solar cell at room temperature.
Table (1): The efficiency response for the solar cell at different etching times.
Figure (7) : I-V characteristics for the solar cell at different etching times.
CONCLUSON
Enhancement of the quantum efficiency of the silicon solar cell is observed by photochemical etching due to formation of a porous silicon layer which acts as a backside reflective layer. The reflection in the active layer traps the scattered light from the cell. Such reflector is created by the formation of porous silicon layer. The results show that the efficiency of the solar cell is enhanced from 12% to 13.5% due to the photochemical etching.
References:
Eff.% Etching time
(min)
12 0
11.957 2
13.525 5
11.989 8
12.111 12
Eff.% Etching time
(min)
12 0
11.957 2
13.525 5
11.989 8
Volume 3, Issue 4, April 2014
Page 80
[1] F. Silva, A. Rosa, R.R.; Roman, L.S.; Veje, E.; Pepe, I. Solid State Commun., Vol. 113, pp. 703, 2000.
[2] A. Rossi, L. Wang, V. Reipa, T. Murphy Biosensor and Bioelectronics 23, pp. 741-745, 2007.
[3] S. Zee A. Lo, A. Rossi, and T. Murphy P hys. Status Solidi A 206, No. 6, pp. 1273–1277, 2009.
[4] P. Apiratikul, A. Rossi and T. Murphy Optics Express Vol. 17, No. 5 pp. 3396-3406, 2009.
[5] L. Canham, Appl. Phys. Lett. Vol. 57, pp. 1046 ,1990.
[6] L. Canham, Leong, W. Beale, M.I.J.; Cox, T.I.; Taylor, L. Appl. Phys. Lett., vol. 61, pp. 2563, 1992.
[7] Lockwood, D. Wang, A.; Bryskiewicz, B. Solid State Commun., vol. 89, pp. 587, 1994.
[8] Lockwood, D.J. Solid State Commun. vol. 92, pp. 101, 1994.
[9] Andersen, O.K.; Veje, E. Phys. Rev., B53, pp. 15643,1996.
[10] Miller, D.A.B. Nature, vol. 384, pp. 307, 1996.
[11] Pavesi, L. Microelectronics Journal, vol. 27, pp. 437, 1996.
[12] Y.S. Tsuo, Y. Xiao, and C.A. Moore, in Porous Silicon, Z.C. Feng and R. Tsu, editors, 347, World Scientific Publishing Co., Singapore, 1994
[13] P. Menna and Y.S. Tsuo in Properties of Porous Silicon, L. Canham, editor, 384, INSPEC, The Institute of Electrical Engineers, London, (1997).).
[14] S.Setzu, G.Lerondl,R. Romestain, J. Appl. Phys. Vol. 84, pp.3129, 1998.
[15] D. Stefano, L. Rendina, I. Moretti, L. Tundo, S. Rossi, Appl. Opt. pp.43, 167–172, 2004 .
[16] Y.S. Tsuo, T.H. Wang, and T.F. Ciszek "Crystalline-Silicon Solar Cells for the 21st Century", Presented at the Electrochemical Society, Annual Meeting, National Renewable Energy Laboratory, Seattle, Washington, May 3, 1999.
[17] S. S. Jan, "Production of Porous Silicon by Laser – Induced Etching", M.Sc. Thesis, School of Applied Sciences, University of Technology, 2006.
[18] 18.B. Marsen, M. Lonfat, P. Scheizer, and K. Sattler, "Energy Gap of Silicon Clusters Studied by Scanning Tunneling Spectroscopy" Physical Review B, Vol.62, No.11, p.p.6892 – 6895, 2000.