in the population sciences published by the Max Planck Institute for Demographic Research Konrad-Zuse Str. 1, D-18057 Rostock · GERMANY www.demographic-research.org
DEMOGRAPHIC RESEARCH
VOLUME 25, ARTICLE 25, PAGES 783-818
PUBLISHED 8 DECEMBER 2011
http://www.demographic-research.org/Volumes/Vol25/25/ DOI: 10.4054/DemRes.2011.25.25
Research Article
Assimilation and emerging health disparities
among new generations of U.S. children
Erin R. Hamilton
Jodi Berger Cardoso
Robert A. Hummer
Yolanda C. Padilla
© 2011 Erin R. Hamilton et al.
This open-access work is published under the terms of the Creative Commons Attribution NonCommercial License 2.0 Germany, which permits use, reproduction & distribution in any medium for non-commercial purposes, provided the original author(s) and source are given credit.
1 Introduction 784
2 Research on the health of children of immigrants 785
2.1 Health assimilation 786
2.2 Explanations for group differences in child health 787
2.2.1 Risk factors 787
2.2.2 Protective factors 788
2.2.3 Risk and protective factors at the neighborhood level 788
3 Data and methods 789
3.1 Data 789
3.2 Measures 790
3.3 Methods 793
4 Results 794
4.1 Descriptive results 794
4.2 Multivariate results 800
5 Discussion 806
5.1 Patterns of health assimilation 806 5.2 Explanations for health assimilation 807
5.3 Conclusions 812
6 Acknowledgements 812
Assimilation and emerging health disparities
among new generations of U.S. children
Erin R. Hamilton1
Jodi Berger Cardoso2
Robert A. Hummer3
Yolanda C. Padilla4
Abstract
This article shows that the prevalence of four common child health conditions increases across generations (from first-generation immigrant children to second-generation U.S.-born children of immigrants to third-and-higher-generation children) within each of four major U.S. racial/ethnic groups. In the third-plus generation, black and Hispanic children have higher rates of nearly all conditions. Health care, socioeconomic status, parents’ health, social support, and neighborhood conditions influence child health and help explain third-and-higher-generation racial/ethnic disparities. However, these factors do not explain the generational pattern. The generational pattern may reflect cohort changes, selective ethnic attrition, unhealthy assimilation, or changing responses to survey questions among immigrant groups.
1 Department of Sociology, University of California, Davis. E-mail: [email protected]. 2 School of Social Work, University of Texas at Austin.
1. Introduction
Children of immigrants currently make up one in four of all children in the United States, and this proportion is expected to increase to one-third by 2050 (Passel and Cohn 2008). Although children of immigrants are an ethnically and socioeconomically diverse group, on average they are more likely than children of natives to live in poverty, experience food insecurity, and live in crowded housing. Additionally, they are less likely than children of natives to receive public assistance or to have health insurance (Capps et al. 2004). Given the context of disadvantage facing this large and growing group, it is important to document and understand how children of immigrants are faring in terms of their health and development in comparison to children of native-born parents (Mendoza 2009).
In this article we provide a comprehensive picture of the health of children of immigrants in comparison to children of natives using recent, nationally representative data. Comparing immigrant generations within four race/ethnic groups, we examine the prevalence of seven common child health conditions and developmental outcomes: asthma, allergies, developmental problems, learning disabilities, ear infections, frequent headaches, and overweight. We distinguish between children of immigrants born abroad (i.e., first-generation children) and children of immigrants born in the United States (i.e., second-generation children) in comparison to born children of U.S.-born parents (i.e., third-plus-generation children). We compare these immigrant generations within each of four major U.S. racial/ethnic groups, thereby building on work that compares Asian and Hispanic children of immigrants to black and white natives (e.g., Hernandez and Charney 1998; Mendoza and Dixon 1999; Padilla, Hamilton, and Hummer 2009). To do this, we use newly available data from the 2007 National Survey of Children’s Health, the only existing national data set with samples large enough to estimate the prevalence of common child health conditions for twelve distinct race/ethnic/immigrant-generation groups: white, black, Hispanic, and Asian children in first, second, and third-plus generations. We also estimate multivariate regression models to test key explanations for group differences in health outcomes.
2. Research on the health of children of immigrants
Despite their socioeconomic disadvantage, it is well documented that children of immigrants are born with better health than the children of their U.S.-born racial/ethnic counterparts. Furthermore, their health is similar to or better than native (third-plus generation) whites. Both patterns are generally observed across major immigrant groups (Frisbie and Song 2003; Guendelman et al. 1990; Hummer et al. 1999; Hummer et al. 2007; Landale, Oropesa, and Gorman 2000; Reichman et al. 2008). Given the socioeconomic disadvantage and limited access to health care of children of immigrants, particularly of groups such as Hispanics, this health advantage has been called an epidemiologic paradox (Markides and Coreil 1986). The epidemiologic paradox of good health at birth despite socioeconomic disadvantage may be due to a process of selective migration of healthy mothers (Palloni and Arias 2004) or to cultural factors that protect immigrant mothers and their infants from the deleterious effects of socioeconomic disadvantage (Scribner 1996).
While the epidemiologic paradox is well documented at birth, there is less research on the health of children of immigrants as they grow and develop (Biehl et al. 2002; Hernandez and Charney 1998; Mendoza 2009). This is in part due to data constraints. Whereas at birth there are two standard summary measures of population health that can be estimated from vital statistics data (the infant mortality rate and the rate of low birth weight), in childhood there is neither a standard measure of health nor a standard source of data. Furthermore, chronic health issues and mortality are rare in childhood, which makes estimating the prevalence of health conditions difficult in survey data sets. This is especially challenging when estimating the prevalence of health conditions for relatively small groups, such as for children of specific immigrant generations within national origin or racial/ethnic sub-groups.
As a result of these constraints, researchers have tended to focus on the health and wellbeing of children in the largest immigrant group in the United States: Mexican Americans. Two studies examining early life trajectories of developmental health and overweight status show that the Mexican American health advantage among children born in the United States is lost by early childhood (Padilla et al. 2002; Hamilton, Teitler, and Reichman 2011). Studies documenting generational differences in child health outcomes among Mexican American children find that the prevalence of many health conditions increases across generations (Mendoza and Dixon 1999; Padilla, Hamilton, and Hummer 2009). These studies suggest a disturbing pattern of worsening health among Mexican American children across time and generations in the United States, a pattern that has been called health assimilation.
diverse backgrounds, arrive with diverse amounts and types of resources, and confront diverse contexts of reception (Bean and Stevens 2003). It is possible, for example, that Asian and other relatively advantaged immigrant groups retain their health advantage at birth through childhood and across generations. In this study, we examine the extent to which the generational pattern observed for Mexican American children is observed for children in other major race/ethnic groups, as well as for Hispanics in general. This pattern might suggest a common process of health assimilation across racial/ethnic groups. We describe the idea of health assimilation in the next section.
2.1 Health assimilation
In the immigration literature the classic theoretical model of assimilation understands assimilation as disappearing differences between groups over time (Alba and Nee 1997). A common assumption in classic assimilation theory is that disappearing differences implies disappearing disadvantage—that, over time, immigrants and their descendants move from marginal social and economic positions into the mainstream through upward mobility. The health assimilation model provides evidence of an opposite pattern. Immigrants tend to have better health than average when they arrive, and health assimilation, or disappearing differences in the health of immigrants and their descendants as compared to natives, implies worsening health over time and across generations.
The study of immigrant generational differences in health and wellbeing across race/ethnic groups provides an indirect test of these models. By examining the health of children across generations in distinct race/ethnic groups, we can assess the extent to which there is a common generational pattern across race/ethnic groups or whether race differentiates outcomes among generational groups, particularly within the third-plus generation.
2.2 Explanations for group differences in child health
In addition to describing the prevalence of common child health and development outcomes across race/ethnic generational groups, we also test key explanations for racial disparities in health, focusing on factors identified as important for explaining the epidemiologic paradox and immigrant health assimilation.
2.2.1 Risk factors
The first two sets of factors that are key to the epidemiologic paradox are access to health care and socioeconomic status. The fact that immigrants have good health despite socioeconomic disadvantage and limited access to care is why their good health is termed a paradox. Social models of racial disparities in health emphasize that racial disparities reflect societal and structural inequality (Hummer 1996; Williams and Sternthal 2010). This inequality is most clearly measured by group differences in socioeconomic status. Socioeconomic status (SES) is consistently associated with health in a graded fashion, meaning that high-SES groups live longer and healthier lives than low-SES groups (Adler et al. 1994).
2.2.2 Protective factors
Scholars have identified several factors that may protect immigrants and their children in the face of socioeconomic disadvantage and limited access to care. First, immigrants may benefit from tight-knit social networks (Guendelman 1998). Social networks are protective because they provide social support, which can serve to reduce stress and improve self-esteem (Umberson and Montez 2010), and instrumental support, including information and financial resources (Radey and Padilla 2009). For example, studies find that social support is associated with better self-reported health and can moderate the effects of discrimination (Finch and Vega 2003). One source of social support that may provide assistance to immigrants is religious institutions. Adults who attend religious services regularly have longer life expectancies than adults who attend irregularly or never attend (Hummer, Rogers, et al. 1999).
A second category of protective factors is parents’ good health and health behaviors, especially among immigrant mothers. Studies have shown that maternal health behaviors are a primary protective factor for the good health of infants born to immigrant women (Reichman et al. 2008). Immigrants, particularly women, are less likely to smoke or drink than natives (Lopez-Gonzalez, Aravena, and Hummer 2005) and changes to these and other health behaviors may be a key pathway through which health assimilation occurs (Akresh 2009; Landale et al. 1999; Kimbro, Lynch, and McLanahan 2008). One central question arising from the literature on the paradox in children is whether the good health behaviors of mothers continue to protect their children past infancy (Guendelman 1998). The overall positive health selection of immigrants (Akresh and Frank 2008) may also influence better than average health among the children of immigrants.
2.2.3 Risk and protective factors at the neighborhood level
In sum, there are clear reasons to expect race/ethnic and immigrant status differences in child health. Moreover, we expect to find that measures of parental socioeconomic status, access to health care, health and health behavior, social support, and neighborhood resources will help to explain both immigrant status differences and race/ethnic differences in child health. We now turn to an explanation of our data and methods and the summary of our study results.
3. Data and methods
3.1 Data
The 2007 National Survey of Children’s Health (NSCH) is a random-digit dial telephone survey designed to produce national and state estimates of the health status of U.S. children (Blumberg et al. 2009; Child and Adolescent Health Management Initiative 2007). The survey, sponsored by the U.S. Department of Health and Human Services’ Maternal and Child Health Bureau and conducted by the National Center for Health Statistics, had a response rate of 46.7%, which is within the typical range for recent telephone surveys (Keeter et al. 2000). One child was randomly selected within each household with children, and respondents were the child’s parent or primary caregiver. The survey was administered in English, Spanish, and four Asian languages to 91,642 respondents.
The NSCH is the only existing data set with a sample large enough to reliably estimate the prevalence of common health conditions in relatively small U.S. sub-populations (e.g., first-generation blacks and whites or third-plus-generation Asians). The NSCH also provides good information about the economic and social characteristics of children’s families and neighborhoods in order to test for major explanations of group differences in child health.
Our analytic sample includes 64,509 Hispanic, Asian, black, and white children between the ages of 3-17 who had full information on all outcome variables.5 We
excluded from the analysis 1,350 children (1.7% of 3-17 year olds) whose race/ethnicity was missing, 53 children (<1%) whose immigrant generation was missing, and 6,164 children (8.7%) who were missing information on one or more of our outcome measures. Results using multiple imputation techniques to impute missing values on
5 We did not analyze 13,600 children ages 0, 1, and 2 because they were asked different health questions and
covariates were not substantially different from results on the sample with full data (n=54,214).
3.2 Measures
Immigrant generation is based on the child’s and their parents’ place of birth. Children born outside of the United States are first generation (i.e., immigrants). Children who were born in the United States to one or two parents born abroad are second generation (i.e., children of immigrants). Children who were born in the United States and whose parents were both born in the United States are third-plus-generation. We were unable to distinguish between third and higher-order generations because grandparents’ place of birth is not reported. Nor do we have information about the documentation, citizenship status, or timing of arrival of the first generation or of the parents of the second generation. The generational status groups were analyzed within each of four major U.S. racial/ethnic groups: Hispanic whites, Hispanic blacks, non-Hispanic Asians, and non-Hispanics of any race.6 The child’s race was reported by the
respondent. More specific national-origin or ethnic groups were not reported in the NSCH.
As we cannot distinguish between higher-order generation groups (i.e., fourth, fifth, sixth, or higher-order descendants of immigrants) within the third-plus generation, it is important to note that third-plus-generation white and black groups are not directly comparable to third-plus-generation Asian and Hispanic groups, as the former contain a much larger proportion of higher-generation children, whereas the latter contain a larger proportion of third-generation children. Disparities between third-plus-generation blacks and whites reflect the historical and contemporary effects of racism and advantage embedded in the U.S. system of racial stratification (Hummer and Chinn 2011; Williams and Sternthal 2010). As such, they represent alternate outcomes for pathways of segmented assimilation.
For confidentiality reasons, the NSCH coded Asian children as “other” race when they lived in states where Asians comprise less than 5% of the sample. These Asian children are therefore indistinguishable from children whose parents in fact report their race as “other” and from American Indian or Alaska Native (AIAN) children who are similarly coded as “other” race in states where AIAN children make up less than 5% of the sample. As a result, the Asian sample included in our analysis is only representative of Asians in the nine states where they comprised more than 5% of the state sample (in California, Hawaii, Maryland, Massachusetts, Nevada, New Jersey, New York,
Virginia, and Washington). The data are representative of white, black, and Hispanic children at the national level.
We analyzed seven common (occurring in more than 1% of children) physical and developmental health measures: asthma, allergies (respiratory, food, or skin) in the past year, three or more ear infections in the past year, frequent or severe headaches in the past year, learning disabilities, developmental problems (including ADD/ADHD, autism, and other unspecified developmental problems or delays), and overweight. All conditions except overweight are based on respondents’ reports of whether a doctor, health care professional, or, in the case of learning disabilities, a teacher or school official ever told the respondent that the child has the given condition. Overweight is based on the respondent’s reports of the child’s height and weight, which were used to construct the child’s body mass index (BMI). Child BMI was compared to the Centers for Disease Control BMI age- and sex-specific distributions with BMIs above the 95th
percentile considered overweight. Overweight was only asked of children age 10 and older because height and weight tend to be misreported in children under age 10 (Akinbami and Ogden 2009). Headaches were only asked of children age five and older because headaches are rare in young children.
Our explanatory variables are measures of the primary factors identified above as important for disparities in health and health assimilation: access to care, socioeconomic status, social support, parents’ health and health behaviors, and neighborhood conditions. We included three measures of access to and use of health care. First, health insurance coverage considers whether the respondent reports that the child has private, public (including Medicaid and S-CHIP), or no health insurance coverage at the time of the survey. Second, we measured the child’s use of preventive care, distinguishing between children who did not see a doctor, nurse, or other health care provider in the past year for preventive care, versus children who saw a health care provider for preventive care one or more times. Third, we measured whether the child had difficulty obtaining health care, based on the respondent’s answer to whether there was any time in the past year when the child needed health care but it was delayed or not received.7
We included four measures of the child’s socioeconomic status and family structure. The first is the household income-to-poverty ratio, distinguishing between households with income less than 100% of the federal poverty line, households whose
7 We tested three other measures of access to and use of health care, including whether the child has a usual
income is between 100-400% of the federal poverty line, and households whose income is greater than 400% of the federal poverty line. In 2007, the federal poverty line for a family of four was $20,650, meaning that families of four in our three categories were earning less than $20,650, between $20,650 and $82,600, and above $82,600 (U.S. Department of Health and Human Services 2011). The second socioeconomic measure is the respondent’s education, distinguishing between less than high school, high school, and greater than high school. We also incorporated a measure of the household/family structure, distinguishing between two-parent married biological or adoptive parents of the child, two-parent married step-family, single parent, and other family types (mostly foster and other non-parental care). Finally, we included the number of residential moves that the child has made in their lifetime as a measure of residential instability.
We included several measures of parents’ health and behaviors. Two measures capture parents’ general health and parents’ mental health, both based on responses to Likert-scale questions; we measured whether the parent has excellent, very good, or good general/mental health, as opposed to fair or poor health. In addition, we measured the number of days the parent exercises per week. For all three of these parent health variables (general health, mental health, and exercise), we used the mother’s reports, and, when missing (as in the case of the child not living with their mother), we substituted fathers’ reports (n=1,412 for parents’ health; n=2,321 for mental health; n=2,300 for exercise). In cases where the child does not live with their mother or father, no report of the caretakers’ health or exercise was obtained. In these cases we imputed the value in order to avoid dropping these cases as missing and thereby losing this important group of children who live in “other” family/household types (n=2,473). A fourth measure is of the home health environment, which was asked for all children (not just those living with their parents) and is assessed as whether or not anyone in the household smokes.
Two indicators of social support available to the parent/caretaker and the child were included. The first is whether the respondent has someone that they turn to for day-to-day emotional help with parenthood or raising of the child. The second is whether the child regularly (weekly), never, or irregularly attends religious services.
a four-point scale between whether the respondent strongly agrees (=4) to strongly disagrees (=1) that people in the neighborhood help each other out, watch out for each other’s children, can count on each other, and are trustworthy to help their child if the child were outside playing and got hurt or scared.
3.3 Methods
We present age-standardized distributions of the prevalence of the seven health conditions by immigrant generation for each of the four racial/ethnic groups. Direct age standardization is used because health conditions vary in their prevalence by age (e.g., the likelihood of ever being diagnosed with asthma increases with age, whereas frequent ear infections (occurring in the past year) are more common in early childhood), and the groups have different age distributions. Distributions of all covariates in the models by immigrant generation within each of the four race/ethnic groups are also presented
4. Results
4.1 Descriptive results
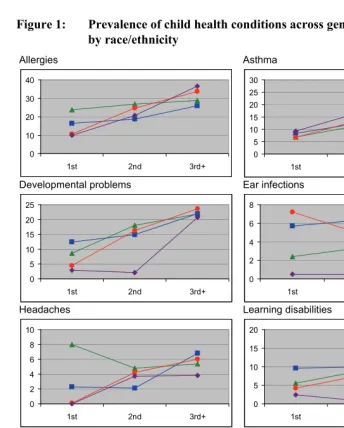
Table 1 shows weighted, age-standardized percent distributions of the seven health conditions for the first, second, and third-plus generations by race/ethnicity. Figure 1 illustrates these patterns. For four common conditions—allergies, asthma, developmental problems, and learning disabilities (affecting 27.5%, 15.3%, 20.4%, and 10.6% of all children, respectively)—the data show a generally graded pattern of higher prevalence of health conditions in the second and third-plus generations. For example, the proportion of children with allergies increases by 21% across the three generation groups for white children, by 58% for Hispanic children, and by more than 300% for black and Asian children. The prevalence of asthma more than doubles from the first to the third-plus generation for all groups. With only two exceptions (developmental problems and learning disabilities among Asians), there is a graded pattern whereby the proportion of children with these conditions increases from the first to the second generation and from the second to the third-plus.8
8 We tested whether there are differences in the prevalence of these conditions among the second generation,
differentiating between children whose parents were both born abroad (in this footnote referred to as the 2nd
generation) versus children who have one parent born abroad and the other born in the United States (in this footnote, referred to as the 2.5 generation). There was no single consistent pattern—in some cases children in the 2nd generation fell between the first generation and the 2.5 generation; in others, the two second generation
groups looked very similar to each other. The most common pattern, which was observed in 6/16 race-outcome combinations, was that 2nd generation children reported the lowest prevalence of the health condition
of all generational groups, even lower than the 1st generation. This might reflect a unique selection pattern for
Table 1: Weighted and age-standardized percent distributions of health conditions for first-, second-, and third-plus-generation children, by race/ethnicity
White Hispanic Black Asian
1st 2nd 3rd+ 1st 2nd 3rd+ 1st 2nd 3rd+ 1st 2nd 3rd+ All
Allergies** 23.8 26.9 28.9 16.4 18.7 26.0 10.6 24.6 33.7 9.9 20.8 36.5 27.5 Asthma** 6.9 11.6 14.0 8.3 12.5 19.3 6.7 13.6 22.6 9.3 16.7 25.3 15.3 Developmental
problems**
8.6 18.1 21.9 12.4 14.9 22.0 4.5 16.2 23.7 2.9 2.1 20.7 20.4
Ear infections** 2.4 3.3 4.8 5.7 6.3 4.9 7.2 5.0 4.5 0.5 0.5 3.2 4.8 Headaches** 8.0 4.8 5.4 2.3 2.1 6.8 0.1 4.2 6.0 0.0 3.7 3.8 5.2 Learning
disabilities**
5.6 8.8 10.2 9.6 10.0 14.4 4.2 7.5 13.5 2.4 0.8 6.6 10.6
Overweight (>95% BMI)**
3.2 16.5 13.0 28.1 20.8 19.8 14.5 15.9 26.6 6.6 11.4 9.3 16.3
Unweighted N 558 2549 45482 937 3439 3654 157 578 6320 122 454 262 64509
*p<.05, **p<.01 for differences across race/ethnicity/generation groups, on the basis of F-tests of equal means.
Source: 2007 National Survey of Children’s Health, Child and Health Measurement Initiative (CAHMI).
A fourth condition, overweight, is prevalent among more than 15% of 10-17 year-olds and shows a graded pattern across the three generations for black children, but not for the other groups. For whites and Asians, the proportion of children who are overweight increases from the first to the second generation, but is lower in the third-plus generation. For Hispanic children, the pattern is reverse: the proportion of children who are overweight is highest in the first generation, lower in the second, and lowest in the third-plus generation. This outlying pattern for overweight among Hispanics is consistent with recent studies showing a higher rate of overweight among first- and second-generation Hispanic children (Buttenheim et al. 2011; Hamilton, Teitler, and Reichman 2011; Van Hook and Baker 2010).
Figure 1: Prevalence of child health conditions across generations by race/ethnicity Allergies Asthma 0 10 20 30 40
1st 2nd 3rd+
0 5 10 15 20 25 30
1st 2nd 3rd+
Developmental problems Ear infections
0 5 10 15 20 25
1st 2nd 3rd+
0 2 4 6 8
1st 2nd 3rd+
Headaches Learning disabilities
0 2 4 6 8 10
1st 2nd 3rd+
0 5 10 15 20
1st 2nd 3rd+
Overweight Legend 0 5 10 15 20 25 30
1st 2nd 3rd+
White Hispanic Black Asian
Table 2 shows weighted percent distributions of all of our covariates for first-, second-, and third-plus-generation children by race/ethnicity. Generational patterns in these characteristics are different across race/ethnic groups, with a general pattern of worsening conditions for white and black children across generations, as opposed to improving conditions for Hispanic and Asian children across generations, thus highlighting why it is important to disaggregate race/ethnicity and immigrant generation. For example, the proportion of white and black children living in poor households (i.e., below 100% of the federal poverty line) and the proportion of parents reporting poor general health or mental health is higher in the third-plus generation than in the first generation whereas the opposite is true for Hispanic and Asian children. The proportion of respondents with a college-level education and the proportion of children with private health insurance decreases across generations for black and white children, but increases across generations for Hispanic and Asian children. The relatively advantaged characteristics of first- and second-generation white and black children, compared to their third-plus-generation counterparts, likely reflects the higher socioeconomic status of the populations of origin (particularly of white immigrants) and a highly select pattern of migration out of origin populations (Akresh and Frank 2008; Feliciano 2005).
For the most part first-generation children are disadvantaged in terms of access to and use of care. Hispanic, black, and Asian first-generation children are less likely than their second- and third-plus-generation counterparts to have any health insurance coverage. Hispanic and black first-generation children are also less likely to have had preventive care in the past year and more likely than their later-generation counterparts to have had difficulty obtaining care in the past year. Because most of the health outcomes we analyze are parent reports of doctor-diagnoses, these patterns of less access to and use of care among first-generation children may suggest that the lower prevalence of health conditions is due to underdiagnoses, a possibility we test below.
native minority group is, indeed, the reason their relatively good health noted here and in previous studies is considered paradoxical.
Table 2: Weighted percent distributions and means of demographic and social characteristics for first-, second-, and third-plus-generation children, by race/ethnicity
White Hispanic Black Asian
1st 2nd 3rd+ 1st 2nd 3rd+ 1st 2nd 3rd+ 1st 2nd 3rd+ All
Age (mean)** 11.6 10.1 10.5 11.6 9.6 10.2 13.2 10.0 10.7 11.8 9.2 10.1 10.4 Female (%) 52.4 44.6 48.2 48.0 48.0 51.4 47.0 49.9 49.5 45.5 54.8 53.8 48.7
Access to and use of health care
Insurance coverage (%)**
Private 86.2 83.5 76.8 19.6 31.6 57.1 40.8 57.6 38.7 61.8 81.9 95.7 64.3 Public 8.4 10.8 17.1 27.9 52.3 33.4 27.1 30.1 53.2 28.2 14.9 3.9 26.8 None 5.4 5.7 6.1 52.5 16.1 9.5 32.1 12.3 8.1 10.0 3.2 0.4 8.9 No preventive care in
past year (%)**
10.2 9.8 13.9 24.5 14.1 14.9 14.1 6.2 10.0 15.2 15.9 13.9 13.5
Difficulty obtaining care in past year (%)**
4.0 5.6 6.1 11.3 7.7 9.2 12.1 10.1 9.1 3.7 1.8 6.4 7.0
Socioeconomic status and family structure
Household income to poverty ratio (%)**
<100 19.8 18.9 24.3 79.8 68.3 40.4 52.1 38.5 59.7 33.7 17.7 5.8 36.0 100-400% 34.5 28.3 37.7 13.6 22.7 34.2 39.3 30.4 26.1 32.4 24.7 40.6 33.1 >400% 45.7 52.8 38.0 6.6 9.0 25.4 8.6 31.1 14.2 33.9 57.6 53.6 30.9 Respondents’
education (%)**
<High school 1.6 2.7 5.8 52.4 45.9 10.9 15.0 7.2 13.0 2.2 6.9 0.1 12.8 High school or equiv 16.7 16.8 23.7 21.7 28.3 29.2 11.7 18.8 35.2 21.2 16.5 2.5 25.4 >High school 81.7 80.5 70.5 25.9 25.8 59.9 73.3 74 51.8 76.6 76.6 97.4 61.8 Family structure (%)**
Two parent bio 81.9 79.7 72.6 68.5 72.3 50.8 43.2 62.1 30.7 78.5 94.2 81.3 65.6 Two parent step 5.6 9.6 8.7 8.3 7.7 11.2 24.9 8.4 10.1 0.9 1.3 1.7 8.9 Single parent 10.9 7.9 13.1 19.4 16.8 28.5 25.6 23.7 45.8 12.2 3.0 14.9 19.1 Other 1.6 2.8 5.6 3.8 3.2 9.5 6.3 5.8 13.4 8.4 1.5 2.1 6.4 Number of residential
moves in child’s life (mean)**
Table 2: (Continued)
White Hispanic Black Asian
1st 2nd 3rd+ 1st 2nd 3rd+ 1st 2nd 3rd+ 1st 2nd 3rd+ All
Parents’ health and behaviors
Parent’s health good/fair/poor**
21.8 23.6 27.8 62.9 57.1 39.2 44.0 37.2 47.0 48.6 31.9 25.4 35.6
Parent’s mental health good/fair/poor**
13.4 22.3 23.9 51.5 44.3 31.7 38.1 25.4 37.4 34.9 28.0 11.5 29.4
Number of days parent exercises per week (mean)**
2.6 2.6 2.9 2.1 2.3 2.9 2.6 2.7 2.7 2.6 2.3 2.2 2.8
Someone in household smokes (%)**
19.8 20.6 27.7 21.8 19.3 29.5 7.5 11.4 30.2 17.7 12.8 4.9 26.1
Social support
Respondent has emotional support (%)**
88.2 91.1 93.8 70.4 73.8 88.6 81.8 84.9 87.7 84.6 73.1 92.2 90.9
Child attends religious services regularly (%)**
51.7 47.8 54.1 56.8 60.4 51.6 75.5 65.2 61.6 53.2 43.0 51.4 55.5
Neighborhood environment
Support scale (mean)** 3.45 3.45 3.56 3.15 3.19 3.33 3.15 3.24 3.14 3.35 3.40 3.45 3.42 Resources scale
(mean)**
0.81 0.82 0.74 0.67 0.73 0.79 0.82 0.87 0.79 0.89 0.86 0.82 0.75
Disorder scale (mean)** 0.07 0.10 0.11 0.16 0.16 0.17 0.09 0.14 0.22 0.11 0.15 0.16 0.14 Unweighted sample
size
558 2549 45482 937 3439 3654 157 578 6320 122 454 262 64509
*p< .05, **p<.01 for differences across race/ethnicity/generation, on the basis of F-tests of equal means or chi-square tests of equal distributions.
4.2 Multivariate results
Turning now to the multivariate regression results, Table 3 shows odds ratios from logistic regression models for asthma, as an illustrative case. Results from regression models for the other six conditions are summarized later in the form of predicted marginal proportions. The models in Table 3 test how the odds of asthma for each race/ethnicity/generational group change when controlling for different sets of covariates. Third-plus-generation whites are the omitted race/ethnic/generation group. The generational gradient is observed when odds ratios are smallest (closest to 0) for the first generation, largest (closest to 1 or greater than 1) for the third-plus generation, and in between for the second generation. We would expect the race/ethnicity/generational odds ratios to lose magnitude—i.e., move closer to 1—when the control variables account for some portion of the race/ethnicity/generational differences.
Model 1 in Table 3 shows race/ethnic/generational differences in the odds of asthma, controlling only for age and sex. The differences in this model are consistent with those in Table 1 and Figure 1 for asthma. First-generation white and Hispanic children have significantly lower odds of asthma, and third-plus-generation Hispanic, black, and Asian children have significantly higher odds of asthma than third-plus-generation white children. The third-plus-generational gradient is observed for each race/ethnic group, as the odds ratios are smallest for the first generation, increase for the second, and are largest for the third-plus generation.
Table 3: Odds ratios from logistic regression models predicting asthma
1 2 3 4 5 6 7
Race/ethnicity/generation (ref=white 3rd+)
White 1st 0.42** 0.43** 0.43** 0.45** 0.42** 0.41** 0.44** White 2nd 0.79 0.80 0.82 0.81 0.79 0.76 0.81 Hispanic 1st 0.44** 0.45** 0.40** 0.39** 0.44** 0.40** 0.42** Hispanic 2nd 0.87 0.79 0.79 0.79 0.86 0.80 0.77* Hispanic 3rd+ 1.57** 1.50** 1.39* 1.49** 1.57** 1.47** 1.33* Black 1st 0.76 0.75 0.68 0.77 0.77 0.69 0.70 Black 2nd 0.98 0.92 0.93 0.98 0.99 0.91 0.87 Black 3rd+ 1.81** 1.61** 1.43** 1.67** 1.81** 1.62** 1.31** Asian 1st 0.53 0.51 0.52 0.49 0.53 0.49 0.47 Asian 2nd 1.34 1.39 1.48 1.35 1.33 1.26 1.42 Asian 3rd+ 3.63* 3.77* 3.93* 3.93* 3.64* 3.48* 3.85*
Access to and use of health care
Health insurance coverage (ref=private)
None 0.84 0.73*
Public 1.31** 1.00
No preventive care in past year 0.69** 0.68** Difficulty obtaining needed care in past year 1.54** 1.35**
Socioeconomic status and family structure
Household income to poverty ratio (ref=>400%)
<100 1.21* 1.11
100-400% 1.07 1.03
Respondents’ education (ref=>High school)
<High school 0.95 0.94
High school or equiv 1.04 1.04 Family structure (ref=two parent bio)
Two parent step 1.10 1.07
Single parent 1.49** 1.41**
Other 1.37* 1.41**
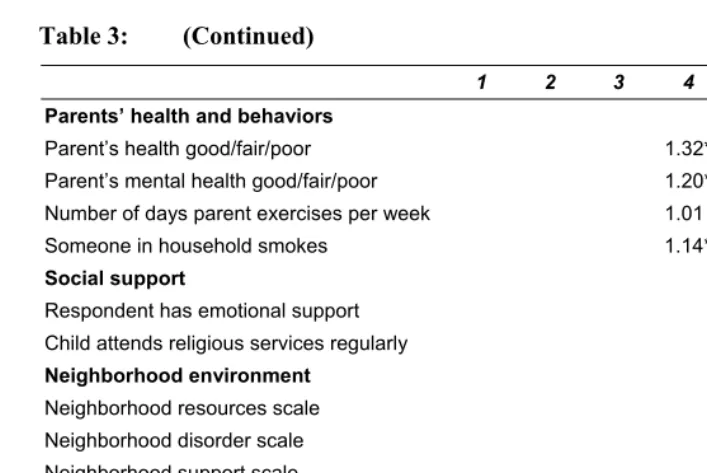
Table 3: (Continued)
1 2 3 4 5 6 7 Parents’ health and behaviors
Parent’s health good/fair/poor 1.32** 1.28** Parent’s mental health good/fair/poor 1.20* 1.12 Number of days parent exercises per week 1.01 1.01 Someone in household smokes 1.14* 1.08
Social support
Respondent has emotional support 0.99 1.12 Child attends religious services regularly 0.97 1.05
Neighborhood environment
Neighborhood resources scale 1.24* 1.27** Neighborhood disorder scale 1.33* 1.20 Neighborhood support scale 0.85** 0.91
Demographic controls
Sex female 0.69** 0.69** 0.68** 0.69** 0.69** 0.69** 0.68** Age in years 1.03** 1.04** 1.03** 1.03** 1.03** 1.03** 1.03** Sample size 64509 64509 64509 64509 64509 64509 64509
*p<.05, **p<.01 (two-tailed tests)
Source: 2007 National Survey of Children’s Health, Child and Health Measurement Initiative (CAHMI).
By contrast, the models do not do a good job explaining the lower odds of asthma for first-generation children, relative to third-plus-generation white children, or the elevated odds of asthma for third-plus-generation Asian children. Across all models, first-generation white and Hispanic children have about 60% lower odds of asthma than third-plus-generation white children. Although not statistically significant in most models, the odds ratios for first-generation Asian children are similar in size and relatively unchanged across models as well. The higher odds of asthma among third-plus-generation Asian children relative to third-third-plus-generation white children are not explained by these models, either.
Model 2 tests the hypothesis that generational differences in the prevalence of health conditions reflects underdiagnosis due to differential access to and use of health care across generations.9 If this were the case, then the odds ratios for first-generation
9 To further investigate this possibility, we also examined generational differences within race/ethnic groups
children would move closer to 1 when controlling for measures of access to and use of care. They do not. The odds of asthma for first-generation white, Hispanic, black, and Asian children barely change from Model 1 to Model 2. Nevertheless, Model 2 does show that access to and use of health care matter for asthma, as should be expected. Children who have public insurance have 31% higher odds of asthma than children with private insurance, an association that disappears when socioeconomic status differentials are controlled for in Model 7 (i.e., the association is capturing a spurious association between public insurance and asthma: low socioeconomic status children are more likely to have asthma and be enrolled in public health insurance). Not having preventive care in the past year is associated with 31% reduced odds of asthma, which might be understood as an under-diagnosis effect to the extent that asthma may be screened for and diagnosed even in well-child care or if preventive care in the past year is serving as a proxy more generally for access to care (children who did not see a doctor for preventive care may also not be seeing a doctor for needed care). Finally, difficulty obtaining needed care in the past year is associated with 54% increased odds of asthma, likely reflecting need (presence of symptoms) combined with an SES effect (difficulty obtaining care because of limited resources, which is associated with increased risk for asthma).10
The remaining covariates are for the most part associated with asthma in the expected directions. In Model 3, measures of disadvantage are associated with increased odds of asthma. In particular, children have increased odds of asthma in single parent and other family types. In Model 4, parents’ poor health and mental health reports are associated with increased odds of asthma, as is household smoking. In Model 5, we see no association between our measures of social support and child asthma. However, parents’ support and religious attendance were both significantly associated with lower odds of learning disabilities and developmental problems. In Model 6, neighborhood disorder is associated with higher odds of asthma whereas neighborhood support is associated with lower odds of asthma. The one result that is inconsistent with our expectation is the above-one odds ratio for neighborhood resources, suggesting that additional resources (such as sidewalks or libraries) are associated with increased odds of asthma. This result may reflect the higher density of sidewalks, libraries, and other neighborhood resources in urban settings where the risk of asthma may also be higher. In the full model, no health insurance, no preventive care, difficulty obtaining care, single parent and “other” families, parents’ poor health
parents/caretakers did not report difficulty obtaining needed care. Overall levels of health conditions are lower for these children, and the generational gradient is less pronounced, but the same general generational pattern (of lower prevalence among the first and second generations compared to the third-plus) was still observed.
10 Difficulty obtaining needed care does not mean that the care was not ultimately obtained (and therefore a
report, and neighborhood resources are significantly associated with higher odds of child asthma.
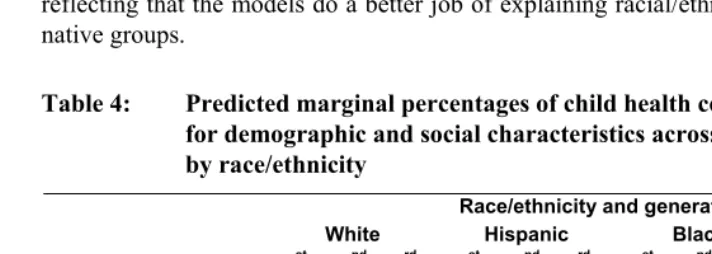
Table 4 presents predicted marginal percentages of each health condition resulting from Model 7, which includes all covariates. Figure 2 illustrates generational patterns in these percentages. If generational and race/ethnic differences in the prevalence of health conditions are due to group differences in social, health, and environmental characteristics, then the percentages reported in Table 4 should be similar across groups. In general, however, they are not, especially for the conditions where a consistent generational gradient of worsening health outcomes is observed. There is still a general pattern of increasing prevalence of allergies, asthma, developmental problems, and learning disabilities across generations in the adjusted percentages. Therefore, we can conclude that the demographic, social, health, and environmental characteristics accounted for in this analysis do not explain the lower prevalence of these four health conditions in the first and second generations, as compared to the third-plus. On the other hand, third-plus-generation racial disparities are generally smaller in the adjusted percentages than they are in the unadjusted percentages, reflecting that the models do a better job of explaining racial/ethnic differences among native groups.
Table 4: Predicted marginal percentages of child health conditions adjusted for demographic and social characteristics across generations by race/ethnicity
Race/ethnicity and generation
White Hispanic Black Asian
Health condition 1st 2nd 3rd+ 1st 2nd 3rd+ 1st 2nd 3rd+ 1st 2nd 3rd+
Allergies 23.5 26.0 29.0 20.8 20.0 26.6 12.8 23.2 33.0 6.3 26.0 28.3 Asthma 7.7 12.8 15.0 7.7 11.9 18.8 13.3 14.1 18.6 6.2 14.7 33.3 Developmental
problems
10.7 21.9 24.2 11.7 14.2 19.9 2.7 17.1 17.8 2.2 2.6 20.9
Ear infections 5.5 2.8 4.3 5.4 4.6 4.4 0.3 4.9 2.9 2.4 0.4 3.5 Headaches 5.9 10.0 5.3 16.0 19.2 6.5 0.1 6.0 4.8 --a 7.0 5.4 Learning disabilities 10.4 11.5 11.5 7.1 7.4 13.3 1.2 8.2 10.4 1.9 1.8 7.3 Overweight 3.3 21.6 14.2 18.3 17.1 18.4 10.9 17.0 21.6 9.1 15.4 4.4
Figure 2: Predicted marginal percentages of child health conditions adjusted for demographic and social characteristics, across generations by race/ethnicity Allergies Asthma 0 5 10 15 20 25 30 35
1st 2nd 3rd+
0 5 10 15 20 25 30 35
1st 2nd 3rd+
Developmental problems Ear infections
0 5 10 15 20 25 30
1st 2nd 3rd+
0 1 2 3 4 5 6
1st 2nd 3rd+
Headaches Learning disabilities
0 5 10 15 20 25
1st 2nd 3rd+
0 2 4 6 8 10 12 14
1st 2nd 3rd+
Overweight Legend 0 5 10 15 20 25
1st 2nd 3rd+
White Hispanic Black Asian
5. Discussion
5.1 Patterns of health assimilation
This analysis extends the work that documents an immigrant health advantage at birth by investigating generational differences in seven health and development outcomes through childhood across four major U.S. racial/ethnic groups. For all groups, we find a generational status gradient in four common measures of child health: asthma, allergies, developmental problems, and learning disabilities. The prevalence of these conditions increases from the first to the second to the third-plus generation. The relative advantage of first-generation and second-generation children for these four outcomes is largely unexplained by differences across groups in access to and use of health care, socioeconomic status, family structure, parents’ health and behaviors, social support, and neighborhood conditions. This advantage is paradoxical given that children of immigrants, particularly Hispanic immigrants, are socioeconomically disadvantaged compared to children of natives. Our results suggest that the epidemiologic paradox, which has been well documented at birth, persists into childhood for the first and second generations for some common measures of child health, but not others.
Indeed, we observed no consistent generational pattern for frequent ear infections, severe headaches, and overweight status. Among Hispanics, the pattern for overweight across generations is the reverse of that observed for allergies, asthma, developmental problems, and learning disabilities. We return to the implications of these inconsistencies below.
The process of health assimilation appears to be segmented, as by the third-plus generation there are significant racial and ethnic disparities in childhood health. As third-plus-generation whites and blacks are largely made up of higher-order generational descendants of immigrants and slaves arriving prior to or during the early 20th century, disparities between these two groups do not reflect the process of recent
assimilation but rather the U.S. racial stratification system, a legacy of historic and contemporary racism. The fact that Hispanic third-plus-generation children have rates similar to black third-plus-generation children, and Asian third-plus-generation children have rates similar to white third-plus-generation children suggests that the process of health assimilation is segmented along racial lines as Asians and Hispanics are sorted into the U.S. racial stratification system. Further differentiation between immigrant groups among the third-plus generation would be helpful, but data sources that collect information about grandparents’ place of birth are rare.
majority of Hispanic children in the United States are first- or second-generation, the relative health disadvantage of the third-plus generation may be obscured in national data on the health of Hispanic children when generational status is not disaggregated.11
Grouping all black children together will lead to the opposite conclusion. Since the majority of black children are third-plus-generation, the health advantages of first- and second-generation black children may be overlooked.
Although our models were unable to explain the first- and second-generation health advantage for asthma, allergies, developmental problems, and learning disabilities, our models did do a good job of explaining race/ethnic variation among the third-plus generation. Racial disparities in child health among native-born children to native-born parents are largely driven by the socioeconomic disadvantage of racial minorities. When we controlled for socioeconomic status and family structure in our multivariate regression models, the elevated odds of poor health outcomes for blacks and Hispanics were substantially reduced, and in some cases reversed, meaning that, given equal distributions of socioeconomic characteristics, these groups would have similar or lower odds of the health condition compared to third-plus-generation white children. The fact that our models explain third-generation differences but not first- and second-generation differences is a key element of the epidemiologic paradox. If the social model of health disparities does not explain the generational pattern, what might?
5.2 Explanations for health assimilation
There are four potential explanations for the pattern of generational differences in health that we documented for asthma, allergies, developmental problems, and learning disabilities. First, the results may suggest that more recently arrived cohorts of immigrants are healthier (or have healthier children) than earlier-arriving immigrants (and their descendants). Testing this explanation would require health information for cohorts arriving at different points in time, ideally observed at the same ages. To our knowledge, such cohort studies of immigrant health do not exist. Some studies of cohort changes have found some limited evidence of declining immigrant selectivity over time, but these studies have not focused on health (e.g., Feliciano 2005). The pattern we uncovered is consistent with findings from the 1994 National Health and
11In our data, for example, there are more first- and second-generation Hispanic children (n=4376) than
Nutritional Examination Survey, but this earlier cohort of children is not old enough to represent parents of the cohort in our data (Mendoza and Dixon 1999).
Second, patterns of health assimilation can be influenced by patterns of racial and ethnic identification across time and generation. Race/ethnicity is a sociocultural construct: individuals (including parents and caregivers who report for children) can and do change their identification patterns over time. One recent study, for example, shows that some Mexican Americans change identity to either “Hispanic” or “white” between censuses, and that such changes depend on factors such as educational attainment, racial/ethnic intermarriage, and generational status (Alba and Islam 2009; see also Trejo 2010). Racial/ethnic fluidity may have important implications for the understanding of children’s health assimilation patterns if, for example, highly educated and high income parents are less likely to identify as Hispanic and more likely to identify as white over time. Such racial/ethnic identity shifts could help partially explain the apparently worse health of third-plus-generation Hispanic children compared to their first- and second-generation counterparts. At present, though, no studies that we are aware of have examined how racial/ethnic identification patterns across time, immigrant generation, and social status impact observed generational patterns in child health.
The third and fourth explanations assume that this cross-sectional comparison tells us something about a health process unfolding over time. There could be deterioration in the relative health standing of children given longer (across-generation) time spent in the United States following immigration. Or, there could be a process of changing response to and reporting of health conditions given longer (across-generation) time spent in the United States following immigration rather than actual health deterioration. We discuss these latter two explanations in turn.
no longer be distinguishable from natives (Jasso et al. 2004). This process of selection and regression to the mean may account for the pattern observed in the NSCH data. Furthermore, if health selection is a process inherent to migration, it would explain why the same generational pattern in health is observed across such diverse groups. On the other hand, it is remarkable that immigrant children have better health than the children of their U.S.-born immigrant counterparts, as both are children of immigrant parents who are presumably subject to the same selection mechanisms. However, it is theoretically possible that there are distinct selection processes for parents who bear children prior to migration and migrate with their children, as compared to those who migrate prior to childbearing.
A different explanation of the paradox, which may also help explain deterioration in health across generations, is the protective culture hypothesis. The protective culture hypothesis proposes that immigrants are protected by a cultural orientation that promotes good health behaviors and strong kin and non-kin social ties (Scribner 1996). Given exposure to deleterious socioeconomic and environmental conditions in the United States over time, this healthy cultural orientation may be undermined, resulting in the deterioration of immigrant (and their descendants’) health. Studies show that diet changes, rates of breastfeeding decline, and smoking and alcohol consumption increase with time spent in the United States among the adult immigrant generation and from the first to the second generations (Akresh 2009; Landale et al. 1999; Lopez-Gonzalez, Aravena, and Hummer 2005; Kimbro, Lynch, and McLanahan 2008).
The protective culture explanation is often invoked to explain the relatively good health of socioeconomically disadvantaged groups, in particular Mexican Americans (Scribner 1996). The fact that we find a generational pattern that is consistent across groups of diverse cultural origins (actually, heterogeneous, pan-ethnic groups) may undermine the argument that there is a protective cultural orientation that is specific to some immigrant groups. The argument is also less relevant to groups who aren’t socioeconomically disadvantaged, such as first-generation whites. The fact that this pattern is observed across heterogeneous groups may argue instead for the common influence of the deleterious U.S. culture (or, in some cases, disadvantaged structural conditions) on the health of immigrants and their descendants. On the other hand, immigrants may be protected by strong co-ethnic communities, and these communities may be undermined by the process of assimilation. The protective role of co-ethnic communities is not necessarily culturally-specific but may be specific to the first generation (i.e., the parents of first- and second-generation children).
the patterns reflect differences across generations in the diagnosis and reporting of child health conditions. We ruled out, to the best of our ability, the possibility that these differences are due to underdiagnosis as a result of differential access to and use of care. That is, controlling for health insurance coverage, use of preventive care, and difficulty in obtaining needed care, the generational gradient persisted. Therefore, assuming that children who present similar symptoms to health care providers are similarly diagnosed (that there is no difference in how health care providers diagnose children of different immigrant generations), the differences may arise in selective processes of who presents those symptoms to health care providers or in selective processes of who reports diagnoses in telephone-based surveys. The interpretations consistent with our findings would be that, in the first case, immigrant parents (of first- and second-generation children) are less likely to seek health care in response to similar symptoms, and, in the second, that immigrant parents are less likely to report diagnoses to telephone surveyors than U.S.-born parents. The difference between first- and second-generation children, who are both children of immigrants, may reflect the fact that parents of the second generation have spent greater time in the United States, resulting in health reporting and response practices that are more similar to parents of the third-plus generation.
It is worth noting that these explanations are not mutually exclusive. It is possible that the generational gradient reflects health deterioration and, at the same time, a process of changing responses to and reporting of health conditions. Both are consistent with a process of assimilation—one to the U.S. health distribution and the other to U.S. norms surrounding health practices. We are unable to test these hypotheses in our data, but both find support in the research literature. Deterioration in the relative health advantage of immigrants has been documented using objectively-measured health conditions. For example, among U.S.-born children, rates of infant mortality increase from the second to the third-plus generation (Hummer, Biegler, et al. 1999). This pattern is consistent with the gradient documented in this analysis, and it could not be due to differential reporting, as infant mortality rates are estimated from linked birth and death certificates with near universal registration. Longitudinal studies of immigrant health also document health deterioration, as in the case of increasing risk of overweight over time among adult immigrants (Antecol and Bedard 2006).
U.S.-born, suggesting that there may be a process of norming to U.S. standards of health assessment (Angel and Guarnaccia 1989). Norming to U.S. standards of health assessment, particularly of increased use of health care in response to conditions as well as increased reporting of health conditions across generations, may be understood in terms of medicalization, which is the process of defining an increasing array of life conditions in medical terms (Conrad 1992). While studies have revealed the social and historical processes underlying medicalization in Western societies, and medicalization is thought to be more advanced in the United States and other Western societies than it is in non-Western societies, there are few studies that examine how medicalized understandings of problems are exported or adopted in non-Western contexts or, as in this case, by immigrant groups (Conrad 1992). The patterns documented in this article are consistent with a process of medicalization among immigrant groups and their descendents, but additional research is required to support it.
It is possible that diverse mechanisms operate for diverse health outcomes. Whereas parents may be largely responsible for responding to asthma and allergies, school teachers and counselors play a greater role in responding to learning disabilities and developmental delays. Thus, differences across groups may also reflect the complex and diverse schooling experiences among children of immigrants and children of diverse racial/ethnic backgrounds.
The outlying patterns observed for overweight, headaches, and ear infections may help elucidate underlying processes. If, for example, headaches and ear infections are more consistently responded to and reported across immigrant generations than other conditions because their symptoms are commonly understood, then the fact that they do not reveal a pattern of worsening health may suggest that worsening health is not occurring for other conditions, such as asthma or allergies, but rather there is a process of health norming. The case of overweight is also suggestive. Overweight status is based on parental/caretaker reports of weight and height, with the problem designation made by the analyst based on the child’s position within a national distribution. It would be interesting to see whether a pattern of worsening health across generations would be observed if parents were asked to evaluate whether their child’s weight status was a problem; some research suggests that, indeed, these kinds of evaluations are different for recent immigrants (Evans et al. 2011). It is also important to note that the generational pattern for overweight among Hispanics may not suggest improvement over time, but instead may reflect the fact that recent cohorts of Hispanic immigrants are heavier than earlier cohorts.12
12Recent research by Buttenheim et al. (2011) suggests that this may be the case for Mexican Americans.
5.3 Conclusions
As this discussion suggests, our analysis draws attention to the fact that measuring health in childhood is not straightforward. The absence of standard measures of population health in childhood demands that analysts inspect a variety of outcomes, which, as in our case, raises the question of whether differences in patterns observed across outcomes are substantive or based on other types of reporting and interpretation issues. Nevertheless, the generational patterns across racial and ethnic groups that we observed indicate that further research is needed to advance our overall understanding of disparities in childhood health.
In conclusion, our article reports generally worse children's health outcomes across generation groups among four major U.S. racial/ethnic groups. Such a pattern is troubling to the extent that it truly measures worsening health across generations. At the same time, it is also troubling to the extent that it measures a process of medicalization, which may detract from underlying social inequalities with real financial costs (Lantz, Lichtenstein, and Pollack 2007). Recognizing and building on the healthy beginnings of new generations of immigrant children should be a priority in the face of threats to health posed by poverty and limited access to healthcare, especially given the cumulative disadvantaged experienced by Hispanics and blacks across subsequent generations. Further work in this area should continue to closely monitor and measure the health of U.S. children in various racial/ethnic and generational status groups to help inform how social and public health policy might best be focused to address the health needs of children and disparities between them.
6. Acknowledgements
References
Adler, N.E., Boyce, T., Chesney, M.A., Cohen, S., Folkman, S., Kahn, R.L., and Syme, S.L. (1994). Socioeconomic status and health: The challenge of the gradient.
American Psychologist 49(1): 15-24. doi:10.1037/0003-066X.49.1.15.
Akinbami, L.J. and Ogden, C.L. (2009). Childhood overweight prevalence in the United States: The impact of parent-reported height and weight. Obesity 17(8): 1574–1580. doi:10.1038/oby.2009.1.
Akresh, I.R. (2009). Dietary assimilation and health among Hispanic immigrants to the United States. Journal of Health and Social Behavior 48(4): 404-417.
doi:10.1177/002214650704800405.
Akresh, I.R. and Frank, R. (2008). Health selection among new immigrants. American
Journal of Public Health 98(11): 2058-2064. doi:10.2105/AJPH.2006.100974.
Alba, R.D. and Islam, T. (2009). The case of the disappearing Mexican Americans: An ethnic-identity mystery. Population Research and Policy Review 28(2):109-121.
doi:10.1007/s11113-008-9081-x.
Alba, R.D. and Nee, V. (1997). Rethinking assimilation theory for a new era of immigration. International Migration Review 31(4): 826-874. doi:10.2307/ 2547416.
Angel, R. and Guarnaccia, P.J. (1989). Mind, body, and culture: Somatization among Hispanics. Social Science and Medicine 28(12): 1229-1238. doi:10.1016/0277-9536(89)90341-9.
Antecol, H. and Bedard, K. (2006). Unhealthy assimilation: Why do immigrants converge to American health status levels? Demography 43(2): 337-360.
doi:10.1353/dem.2006.0011.
Bean, F.D. and Stevens, G. (2003). America’s newcomers and the dynamics of
diversity. New York: Russell Sage Foundation.
Biehl, M., Park, M.J., Brindis, C., Pantell, R., and Irwin, C. (2002). The health of America's middle childhood population. San Francisco, CA: Public Policy Analysis, Education Center for Middle Childhood and Adolescent Health. Blumberg, S.J., Foster, E.B., Frasier, A.M., Satorins, J., Skalland, B.J., Nysse-Carris,
Bond Huie, S.A., Hummer, R.A., and Rogers, R.G. (2002). Individual and contextual risks of death among race and ethnic groups in the United States. Journal of
Health and Social Behavior 43(3): 359-381. doi:10.2307/3090209.
Buttenheim, A.M., Pebley, A., Hsih, K., and Goldman, N. (2011). The shape of things to come: Obesity prevalence among foreign-born and U.S.-born Hispanic
children in California. Paper presented at the Population Association of America
Conference, Washington D.C., March 31-April 2, 2011.
Capps, R., Fix, M., Ost, J., Reardon-Anderson, J., and Passel, J.S. (2004). The health and well-being of young children of immigrants. Washington, DC: The Urban Institute.
Child and Adolescent Health Measurement Initiative (CAHMI) (2007). 2007 National Survey of Children’s Health. Indicator Data Set [electronic resource]. Portland, OR: Data Resource Center for Child and Adolescent Health. http://www.childhealthdata.org.
Conrad, P. (1992). Medicalization and social control. Annual Review of Sociology 18: 209-232. doi:10.1146/annurev.so.18.080192.001233.
Conrad, P. and Barker, K.K. (2010). The social construction of illness: Key insights and policy implications. Journal of Health and Social Behavior 51(1): S67-S79.
doi:10.1177/0022146510383495.
Evans, A., Seth, J.G., Smith, S., Harris, K.K., Loyo, J., Spaulding, C., Van Eck, M., and Gottlieb, N. (2011). Parental feeding practices and concerns related to child underweight, picky eating, and using food to calm differ according to ethnicity/race, acculturation, and income. Maternal and Child Health Journal 15(7): 899-909. doi:10.1007/s10995-009-0526-6.
Feliciano, C. (2005). Educational selectivity in U.S. immigration: How do immigrants
compare to those left behind? Demography 42(1): 131-152.
doi:10.1353/dem.2005.0001.
Finch, B.K., and Vega, W.A. (2003). Acculturation stress, social support, and self-rated health among Latinos in California. Journal of Immigrant Health 5(3): 109-117.
doi:10.1023/A:1023987717921.
Frank, R., Akresh, I.R., and Lu, B. (2010). Latino immigrants and the U.S. racial order: How and where do they fit in? American Sociological Review 75(3): 378-401.
Frisbie, W.P. and Song, S. (2003). Hispanic pregnancy outcomes: Differentials over time and current risk factor effects. The Policy Studies Journal 31(2): 237-252.
doi:10.1111/1541-0072.00013.
Guendelman, S.P. (1998). Health and disease among Hispanics. In: Loue, S. (ed.).
Handbook of Immigrant Health. New York: Plenum Press: 277–301.
Guendelman, S.P., Gould, J.B., Hudes, M., and Eskenazi, B. (1990). Generational differences in perinatal health among the Mexican American population: Findings from HHANES 1982-1984. American Journal of Public Health 80(Suppl): 61-65. doi:10.2105/AJPH.80.Suppl.61.
Hamilton, E.R., Teitler, J.O., and Reichman, N.S. (2011). Mexican American birth weight and child overweight: Unraveling a possible early lifecoursehealth transition. Journal of Health and Social Behavior 52(3): 333–348.
doi:10.1177/0022146511405335.
Hernandez, D.J. and Charney, E. (1998). From generation to generation: The health
and well-being of children in immigrant families. Washington, D.C.: National
Academy Press.
Hernandez, D.J. and Darke, K. (1999). Socioeconomic and demographic risk factors and resources among children in immigrant and native-born families: 1910, 1960, and 1990. In: Hernandez, D.J. (ed.) Children of immigrants: Health,
adjustment, and public assistance. Washington, D.C.: National Academy Press:
19-126.
Hummer, R.A. (1996). Black-white differences in health and mortality: A review and
conceptual model. The Sociological Quarterly 37(1): 105-125.
doi:10.1111/j.1533-8525.1996.tb02333.x.
Hummer, R.A., Biegler, M., De Turk, P.B., Forbes, D., Frisbie, W.P., Hong, Y., and Pullum, S.G. (1999). Race/ethnicity, nativity, and infant mortality in the United States. Social Forces 77(3): 1083-1117. doi:10.2307/3005972.
Hummer, R.A. and Chinn, J.J. (2011). Race/ethnicity and U.S. adult mortality: Progress, prospects, and new analysis. Du Bois Review 8(1): 5-24.
doi:10.1017/S1742058X11000051.
Hummer, R.A., Rogers, R.G., Nam, C.B., and Ellison, C.G. (1999). Religious involvement and U.S. adult mortality. Demography 36(2): 273-285.
doi:10.2307/2648114.
Jasso, G., Massey, D.S., Rosenzweig, M.R., and Smith, J.P. (2004). Immigrant health: Selectivity and acculturation. In: Anderson, N.B., Bulatao, R.A., and Cohen, B. (eds.). Critical perspectives on racial and ethnic differences in health inlate life. Washington, D.C.: The National Academies Press: 227-266.
Keeter, S., Miller, C., Kohut, A., Groves, R.M., and Presser, S. (2000). Consequences of reducing nonresponse in a national telephone survey. Public Opinion
Quarterly 64(2): 125-148. doi:10.1086/317759.
Kimbro, R.T., Brooks-Gunn, J., and McLanahan, S. (2011). Young children in urban areas: Links among neighborhood characteristics, weight status, outdoor play, and television-watching. Social Science and Medicine 72(5): 668-676.
doi:10.1016/j.socscimed.2010.12.015.
Kimbro, R.T., Lynch, S.M., and McLanahan, S. (2008). The influence of acculturation on breastfeeding initiation and duration for Mexican Americans. Population
Research and Policy Review 27(2): 183-199. doi:10.1007/s11113-007-9059-0.
Landale, N.S., Oropesa, R.S., and Gorman, B.K. (2000). Migration and infant death: Assimilation or selective migration among Puerto Ricans? American
Sociological Review 65(6): 888-909. doi:10.2307/2657518.
Landale, N.S., Oropesa, R.S., Llanes, D., and Gorman, B.K. (1999). Does Americanization have adverse effects on health? Stress, health habits, and infant health outcomes among Puerto Ricans. Social Forces 78(2): 613-641.
doi:10.2307/3005569.
Lantz, P.M., Lichtenstein, R.L., and Pollack, H.A. (2007). Health policy approaches to population health: The limits of medicalization. Health Affairs 26(5): 1253– 1257. doi:10.1377/hlthaff.26.5.1253.
Lopez-Gonzalez, L., Aravena, V.C., and Hummer, R.A. (2005). Immigrant acculturation, gender, and health behavior: A research note. Social Forces 84(1): 581-593. doi:10.1353/sof.2005.0112.