Fire-resistant flax - reinforced polypropylene / polylactic acid composites with
optimised fire and mechanical performances
Wiwat Pornwannachai a,b , John Russell Ebdona and Baljinder K. Kandola a*
a Institute for Materials Research and Innovation, University of Bolton, Deane Road, Bolton, BL3 5AB, UK
b SCG Chemicals Co.,Ltd., 1 Siam Cement Rd., Bang Sue, Bangkok 10800, Thailand.
*Corresponding author. Tel: +44 1204 903517; E-mail address:[email protected]
Abstract
Fabrics from commingled natural (flax) –thermoplastic (polypropylene (PP) / poly lactic acid
(PLA) polymeric fibres were fire retarded with an oragnophosphonate flame retardant (FR). The
fire retarded flax/PP and flax/PLA fabrics were melt pressed to prepare respective thermoplastic
composites. The effect of FR concentration on the fire and mechanical properties of composites
were studied and the results analysed in terms of concentration of FR elements in the composites.
While the UL-94 test was used as a benchmark to achieve a V-0 rating, cone calorimetric
parameters were used for in-depth analysis of fire performance. The results show that flax/PP and
flax/PLA composites require a minimum 0.9 and 0.6 % phosphorus (P), respectively to achieve a
V-0 rating in the UL-94 test. Mechanical properties, evaluated in tensile and flexural modes are
however slightly impaired, most probably due to the acidity of the FR solution (pH = 3.2). In
order to improve the mechanical properties, a buffer solution was used to change the pH to 6.0,
which while having a minimal effect on mechanical properties of flax/PP, significantly reduced
those of flax/PLA, and increased flammability of both composites and hence overall showed no
benefit.
Introduction
Flax fibre owing to its widespread growth in Europe and North America, and high stiffness
(27.6-85 GPa) and strength (800-2000 MPa,1 is one of the most widely used lignocellulosic fibres for
composites.1,2 Flax fibre’s most use is in thermoplastic composites, particularly in the automotive
industry3 though its use with thermoset resins such as epoxy and unsaturated polyester has also
been reported2 and is on the increase. From the manufacturing point of view, there is a
considerable pressure from industry to develop easy composite fabrication processing with a
reduced number of steps. In that context NetComposites in the recent past developed commingled,
twistless and aligned flax/polypropylene (flax/PP) and flax/polylactic acid (flax/PLA) yarns, and
woven fabrics from these yarns. Composites from such fabrics can be prepared just by melt
pressing the required number of stacked layers of such fabrics. Commingling is a technique used
to intimately mix different fibres/yarns, typically using compressed air. The alignment gives 50%
better fibre efficiency over conventional twisted yarns.4 Since the two fibre types are in intimate
contact, during melt pressing the fibres wet easily, giving improved fibre/matrix interaction and
better performance of the derived composites. Moreover, these fabrics can be easily impregnated
with fire retardants using a conventional textile processing ‘pad-dry’ technique, which is focus of
this work.
Natural fibres are flammable and hence, add to the flammability of the composites in which the
matrix being organic in nature is also flammable.2,5 Hence, as applications of natural fibre
composites are becoming more widespread, their fire performance is becoming more important.
Most often fire retardants are added to the thermoplastic matrix by melt blending prior to making
composites 6,7,8. Alternative method is to apply fire retardant treatments on the fibres9,10,11 Fire
retardant treatments for natural fibres, typically cellulosic fibres such as cotton, have been well
established for many years. Fire retardants can be simply applied using aqueous solutions of
phosphorus-nitrogen (P-N), sulfur or halogen containing fire retardants.12,13 In principle, whatever
is suitable for cotton, should also be effective on other cellulosic fibres such as flax, jute etc. The
use of different fire retardants on woven fabrics from commingled flax/polypropylene (flax/PP)
and flax/polylactic acid (flax/PLA) prior to melt pressing stacked layers of such fabrics in order to
make fire resistant composites has been previously reported.14 Four commercially available fire
retardant formulations commonly used for cellulosic textiles were: (i) ammonium sulfamate (ii)
guanylurea methyl phosphonate, an organophosphonate. While all of these formulations were
effective in flax/PLA in terms of achieving a V-0 rating in a UL-94 test, only the
organophosphonate FR was capable of imparting a V-0 rating for flax/PP. However all fire
retardants reduced the mechanical properties of composites, and the reduction seemed to be
related to the pH of the fire retardant formulation used, being maximum for the
organophosphonate FR (PH 3.3). The reduction in mechanical properties was more pronounced in
flax/PLA than in flax/PP. The purpose of this work is to establish the factors affecting the
mechanical properties of both flax/PP and flax/PLA composites by using the most effective FR,
the organophosphonate, and to develop composites with optimised FR and mechanical properties,
i.e. achieving V-0 rating, with a minimal effect on mechanical properties.
Experimental
Materials
Fabrics: Woven fabrics from flax and commingled flax/PP and flax/PLA fibres (50/50 wt-%)
were supplied by Composites Evolution (UK). These woven fabrics were of 4x4 plain weave
structure with the following area densities: flax = 467 g/m2, flax/PP = 465 g/m2 and flax/PLA =
493 g/m2.
Fire retardant: A commercially available organophosphonate (guanylurea methylphosphonate)
fire retardant formulation with a pH of 3.3 was used. Due to commercial sensitivity details of the
fire retardant formulation and source have not been identified and the fire retardant is hereinafter
referred to simply as “FR”.
Sodium acetate (NaOAc), 98% purity supplied by Fisher Scientific UK Ltd was used as a
buffering agent to reduce the acidity of the FR solution.
Sample preparation
Flax/PP and flax/PLA fabrics were treated with aqueous FR solutions using a pad-dry technique
to obtain specified fire retardant element concentrations, determined by the formulation used, in
the composites as given in Table 1.
For samples where pH had to be changed, the required amount of sodium acetate (NaOAc) was
solutions of pH 3 to 7. Based on the results flax/PP and flax/PLA fabrics were treated with FR
solutions of pH 3.3 and 6.0.
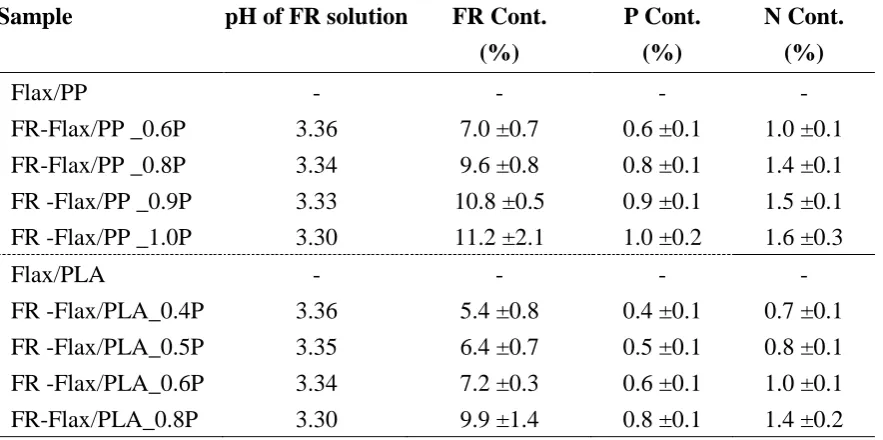
Table 1. The FR contents of fire retarded flax/PP and flax/PLA fabrics.
Sample pH of FR solution FR Cont. P Cont. N Cont.
(%) (%) (%)
Flax/PP - - - -
FR-Flax/PP _0.6P 3.36 7.0 ±0.7 0.6 ±0.1 1.0 ±0.1
FR-Flax/PP _0.8P 3.34 9.6 ±0.8 0.8 ±0.1 1.4 ±0.1
FR -Flax/PP _0.9P 3.33 10.8 ±0.5 0.9 ±0.1 1.5 ±0.1
FR -Flax/PP _1.0P 3.30 11.2 ±2.1 1.0 ±0.2 1.6 ±0.3
Flax/PLA - - - -
FR -Flax/PLA_0.4P 3.36 5.4 ±0.8 0.4 ±0.1 0.7 ±0.1
FR -Flax/PLA_0.5P 3.35 6.4 ±0.7 0.5 ±0.1 0.8 ±0.1
FR -Flax/PLA_0.6P 3.34 7.2 ±0.3 0.6 ±0.1 1.0 ±0.1
FR-Flax/PLA_0.8P 3.30 9.9 ±1.4 0.8 ±0.1 1.4 ±0.2
Composite samples from control and FR treated flax/PP and flax/PLA fabrics were prepared by
melt-pressing eight layers of each fabric at 180oC and 40 kg/cm2 pressure for 3 min, and then
transferring them to a cold press to cool down under pressure (20 kg/cm2) to ambient temperature.
The thickness of each composite was ~3 mm.
Fire performance evaluation
The fire performance of the composites was evaluated using the UL-94 burn test and cone
calorimetry. The UL-94 test was conducted according to ISO 1210 in both horizontal and vertical
orientations, from which the rate of burning for each sample was also recorded. For cone
calorimetry, three specimens of each sample were tested using a Fire Testing Technology Ltd, UK
instrument at 35 kW/m2 according to ISO 5660.
Mechanical performance evaluation
The mechanical performance of composites was evaluated in tensile and flexural modes. Tensile
and flexural tests were conducted using an Instron 3369. Three specimens of 150 mm x 20 mm x
with the crosshead speed at 1 mm/min. The gauge length of each specimen was 100 mm.
Polymeric tabs were bonded at the end of specimens to improve the gripping and to ensure failure
within the gauge region. In flexural mode three point bending tests were carried out using a 100 N
load cell at 0.5 mm/min crosshead speed.
Tensile properties of FR treated flax fabrics were determined using a 100 N load cell with the
crosshead speed at 100 mm/min onfabric strips 50 mm wide. The gauge length was 100 mm.
Results and Discussion
The effect of FR content on fire and mechanical performance of FR flax/PP and flax/PLA
composites
A number of composite samples with different FR contents were prepared (Table 1) in order to
determine the minimum amount of FR element required to achieve an acceptable level of fire
retardancy. The primary FR element in the organophosphonate FR (guanylurea
methylphosphonate) used in this work is phosphorus (P), followed by phosphorus-nitrogen (P-N)
ratio for a synergistic action. The results in the following sections are analysed in terms of
concentration of P in the composites.
a) Fire performance
The results for control and FR treated flax/PP and flax/PLA composites are reported in terms of
UL-94 rating and rates of burning (vertical and horizontal orientations) in Table 2. The UL-94 is a
plastics flammability standard to determine the material’s tendency to either extinguish (V-0
rating when tested in vertical orientation; V-1 or V2 if it burns for <30 s without or with flaming
drips, respectively) or spread the fire once the specimen has been ignited (determined in a
horizontal orientation). In this section the focus is to find the critical P concentration in flax/PP
and flax/PLA samples that could lead to the achievement of a UL-94 V-0 rating.
The control flax/PP composite failed the UL-94 rating test; the specimen completely burnt up to
the sample holder. In horizontal mode also it burnt up to the sample holder with a burning rate of
21.4 mm/min. On addition of fire retardant, the flammability of flax/PP composites was
significantly reduced. As expected, the effectiveness of the FR was greater the higher the FR
composites at 0.6 and 0.8% P contents significantly decreases the burning rates of the composites
by about 40 and 60%, respectively, but still does not change the UL-94 rating of the composites.
When the FR content of flax/PP composites is further increased to at least 0.9% P, the composites
then achieve a V-0 rating.
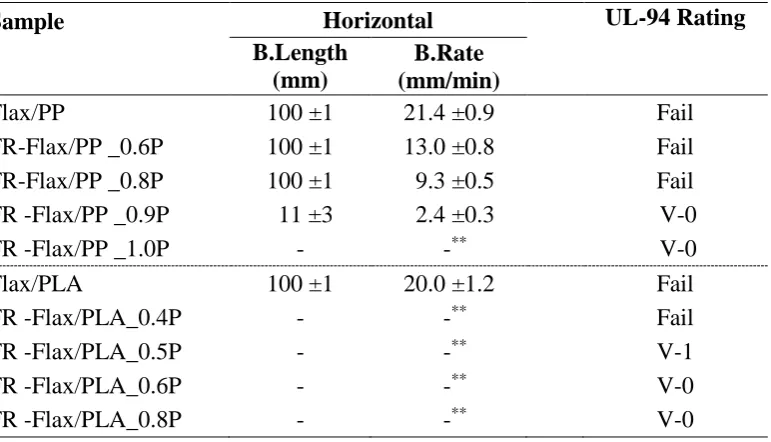
Table 2. UL-94 results of control and FR treated flax/PP and flax/PLA composites
Sample Horizontal UL-94 Rating
B.Length (mm)
B.Rate (mm/min)
Flax/PP 100 ±1 21.4 ±0.9 Fail
FR-Flax/PP _0.6P 100 ±1 13.0 ±0.8 Fail
FR-Flax/PP _0.8P 100 ±1 9.3 ±0.5 Fail
FR -Flax/PP _0.9P 11 ±3 2.4 ±0.3 V-0
FR -Flax/PP _1.0P - -** V-0
Flax/PLA 100 ±1 20.0 ±1.2 Fail
FR -Flax/PLA_0.4P - -** Fail
FR -Flax/PLA_0.5P - -** V-1
FR -Flax/PLA_0.6P - -** V-0
FR -Flax/PLA_0.8P - -** V-0
Note: B.Length = burnt length; B.Rate = burning rate
* The fire went out before reaching the timing mark after removal of the burner
** Sample did not ignite, and hence the burning rate could not be calculated
The control flax/PLA composites have slightly lower flammability compared to the control
flax/PP as shown by the slightly lower burning rate (20.0 mm/min, Table 2), but fail the vertical
rating test and burn completely. The burning rate of flax/PLA composites is significantly reduced
with the addition of FR at 0.4 and 0.5% P contents, in the horizontal test the rates of burning could
not be calculated as the fire went out before reaching the timing mark. Moreover, to achieve V-0
rating, flax/PLA composites require only a FR content of 0.6% P.
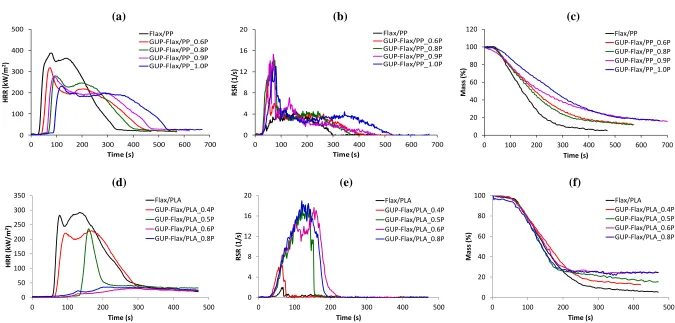
The cone calorimetric results for fire retarded flax/PP and flax/PLA composites with different FR
contents tested at 35 kW/m2 are graphically presented in Figure 1. The derived results from the
curves are given in Table 3. Both flax/PP and flax/PLA ignited and burned showing two peaks of
heat release, PHRR (Figure 1). This behaviour is typical of a cellulosic fibre – composite, where
the ignition of the thermoplastic polymer present on the surface leads to the first peak of heat
release. In the meantime, the flax fibres start charring. When the charred layer is thick enough to
act as a thermal barrier for the underlying polymer, the burning slows down until the charred layer
indicated by the slightly greater time-to-ignition (TTI); lower peak heat release rate (PHRR) and
total heat release (THR); and much lower smoke production (61 L compared to 704 L in flax/PP).
The lower smoke production in flax/PLA may be due to the presence of oxygen in the structure of
PLA (absent in that of polypropylene), which may assist the complete combustion of polyesters at
lower oxygen concentrations than are required for complete combustion of polypropylene.
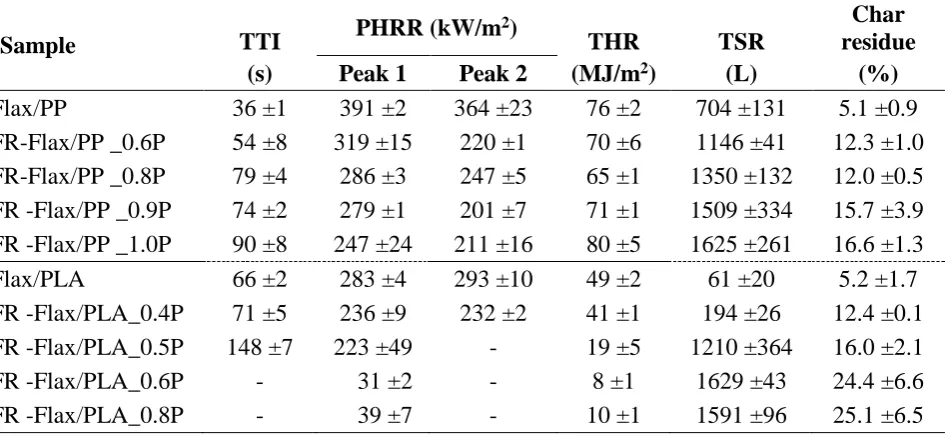
Table 3. Cone calorimetric results of FR containing flax/PP and flax/PLA composites at 35 W/m2.
Sample TTI PHRR (kW/m
2)
THR TSR
Char residue
(s) Peak 1 Peak 2 (MJ/m2) (L) (%)
Flax/PP 36 ±1 391 ±2 364 ±23 76 ±2 704 ±131 5.1 ±0.9
FR-Flax/PP _0.6P 54 ±8 319 ±15 220 ±1 70 ±6 1146 ±41 12.3 ±1.0
FR-Flax/PP _0.8P 79 ±4 286 ±3 247 ±5 65 ±1 1350 ±132 12.0 ±0.5
FR -Flax/PP _0.9P 74 ±2 279 ±1 201 ±7 71 ±1 1509 ±334 15.7 ±3.9
FR -Flax/PP _1.0P 90 ±8 247 ±24 211 ±16 80 ±5 1625 ±261 16.6 ±1.3
Flax/PLA 66 ±2 283 ±4 293 ±10 49 ±2 61 ±20 5.2 ±1.7
FR -Flax/PLA_0.4P 71 ±5 236 ±9 232 ±2 41 ±1 194 ±26 12.4 ±0.1
FR -Flax/PLA_0.5P 148 ±7 223 ±49 - 19 ±5 1210 ±364 16.0 ±2.1
FR -Flax/PLA_0.6P - 31 ±2 - 8 ±1 1629 ±43 24.4 ±6.6
FR -Flax/PLA_0.8P - 39 ±7 - 10 ±1 1591 ±96 25.1 ±6.5
(a) (b) (c) 0 100 200 300 400 500
0 100 200 300 400 500 600 700
H R R (k W /m 2) Time (s) Flax/PP GUP-Flax/PP_0.6P GUP-Flax/PP_0.8P GUP-Flax/PP_0.9P GUP-Flax/PP_1.0P 0 4 8 12 16 20
0 100 200 300 400 500 600 700
R SR (1 /s ) Time (s) Flax/PP GUP-Flax/PP_0.6P GUP-Flax/PP_0.8P GUP-Flax/PP_0.9P GUP-Flax/PP_1.0P 0 20 40 60 80 100 120
0 100 200 300 400 500 600 700
Mass (%) Time (s) Flax/PP GUP-Flax/PP_0.6P GUP-Flax/PP_0.8P GUP-Flax/PP_0.9P GUP-Flax/PP_1.0P
(d) (e) (f)
0 50 100 150 200 250 300 350
0 100 200 300 400 500
HRR (kW/m 2) Time (s) Flax/PLA GUP-Flax/PLA_0.4P GUP-Flax/PLA_0.5P GUP-Flax/PLA_0.6P GUP-Flax/PLA_0.8P 0 4 8 12 16 20
0 100 200 300 400 500
R SR (1/ s) Time (s) Flax/PLA GUP-Flax/PLA_0.4P GUP-Flax/PLA_0.5P GUP-Flax/PLA_0.6P GUP-Flax/PLA_0.8P 0 20 40 60 80 100
0 100 200 300 400 500
Mass (%) Time (s) Flax/PLA GUP-Flax/PLA_0.4P GUP-Flax/PLA_0.5P GUP-Flax/PLA_0.6P GUP-Flax/PLA_0.8P
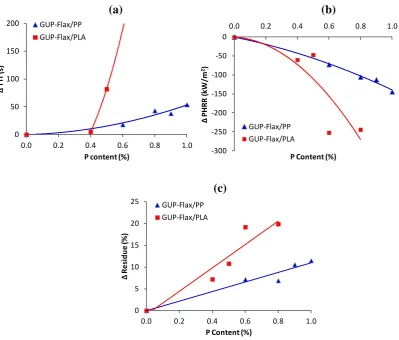
The cone calorimetric results in Table 3 show that at 0.6% P content of FR in flax/PP
composites, the TTI increases from 36 s of the control to 54 s, and the PHRR and THR are
reduced by about 18% and 10% respectively compared to those of the control. With the
increase in amount of FR, the TTI of flax/PP further increases, reaching 90 s in
FR-Flax/PP_1.0P. The change in each parameter as a function of phosphorus content is shown in
Figure 2(a). A similar trend is also seen in the reduction in PHRR and the increase in char
residue, indicating that the higher FR content in the composites is more effective than the
lower ones, Figure 2 (b and c).
(a) (b)
0 50 100 150 200
0.0 0.2 0.4 0.6 0.8 1.0
∆
T
TI
(
s)
P content (%) GUP-Flax/PP GUP-Flax/PLA -300 -250 -200 -150 -100 -50 0
0.0 0.2 0.4 0.6 0.8 1.0
∆ P HR R ( kW /m 2)
P Content (%) GUP-Flax/PP GUP-Flax/PLA (c) 0 5 10 15 20 25
0.0 0.2 0.4 0.6 0.8 1.0
∆ R e si d u e (% )
P Content (%) GUP-Flax/PP
GUP-Flax/PLA
Figure 2. The change in TTI, 1st PHRR, and charred residue of FR treated flax/PP and flax/PLA samples compared to those of the control at 35 kW/m2 as a function of phosphorus
content.
The fire retardant significantly enhances the fire performance of flax/PLA composites, and
the effect is more pronounced than of when used in flax/PP, as seen from Figures 1 and 2.
the TTI of flax/PLA, and decreases PHRR by about 20% in both peaks. On increasing the FR
content to the 0.5% P level, the fire performance of flax/PLA is further enhanced as seen by
the significant increase in TTI (148 s), and also the change in burning behaviour from double
peaks of HRR to a single peak, Figure 1(a), which is due to early formation of increased
amounts of char in FR-Flax/PLA_0.5P (16.0% compared to 5.2% in the control), and which
may more efficiently protect the remaining material from further combustion. With further
increases of FR content to 0.6 and 0.8% P, the efficiency of the FR is enough to prevent
ignition, Figure 1(d).
b) Mechanical performance
The mechanical performances of control and FR treated flax/PP and flax/PLA composites are
reported in tensile and flexural modes in Table 4. The tensile and flexural moduli of these
composites were calculated from the elastic region of the stress-strain curves. Since the
mechanical properties are affected by the FR content of the fabric/composite composites, the
results here are discussed in this context as opposed to in terms of P contents (although they
are related) as in the previous section.
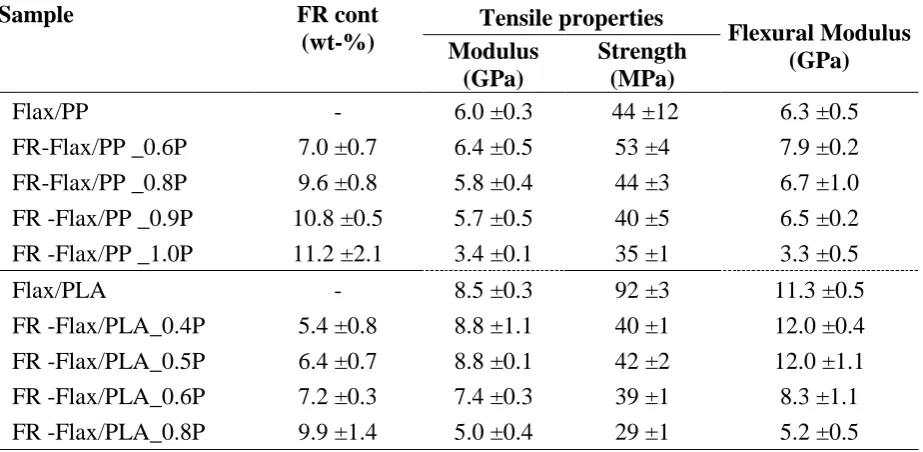
Table 4. Mechanical properties of control and FR containing flax/PP and flax/PLA composites
Sample FR cont
(wt-%)
Tensile properties
Flexural Modulus (GPa)
Modulus (GPa)
Strength (MPa)
Flax/PP - 6.0 ±0.3 44 ±12 6.3 ±0.5
FR-Flax/PP _0.6P 7.0 ±0.7 6.4 ±0.5 53 ±4 7.9 ±0.2
FR-Flax/PP _0.8P 9.6 ±0.8 5.8 ±0.4 44 ±3 6.7 ±1.0
FR -Flax/PP _0.9P 10.8 ±0.5 5.7 ±0.5 40 ±5 6.5 ±0.2
FR -Flax/PP _1.0P 11.2 ±2.1 3.4 ±0.1 35 ±1 3.3 ±0.5
Flax/PLA - 8.5 ±0.3 92 ±3 11.3 ±0.5
FR -Flax/PLA_0.4P 5.4 ±0.8 8.8 ±1.1 40 ±1 12.0 ±0.4
FR -Flax/PLA_0.5P 6.4 ±0.7 8.8 ±0.1 42 ±2 12.0 ±1.1
FR -Flax/PLA_0.6P 7.2 ±0.3 7.4 ±0.3 39 ±1 8.3 ±1.1
FR -Flax/PLA_0.8P 9.9 ±1.4 5.0 ±0.4 29 ±1 5.2 ±0.5
Note: Fibre volume fractions in all flax/PP samples are ~40%, and all flax/PLA are ~60%.
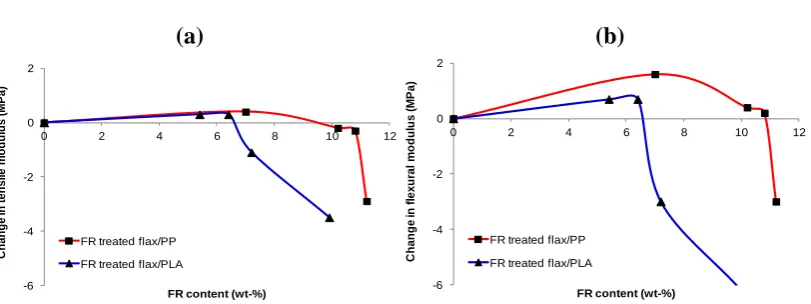
In tensile mode, the control flax/PP composite has a modulus of 6.0 GPa and a tensile
gradually decreases with increasing FR content, Table 4. However, the extent of reduction of
the tensile modulus is not linear with respect to the increase of FR content. In Figure 3(a), it
can be seen that the tensile modulus of flax/PP gradually reduces from 6.0 GPa for the
control to 5.7 GPa in FR-Flax/PP_0.9P with 10.8 wt-% of FR content, and then significantly
drops to 3.4 GPa when the FR content reaches 11.2 wt-% in FR-Flax/PP_1.0P composites.
Addition of the FR also decreases the tensile strength of flax/PP composites, and the
reduction increases further with an increase in the amount of FR in the composites, (See
Table 4). As the tensile properties of composites are reinforcing fibre dependent, the
reduction in tensile properties of flax/PP could be due to a change in flax properties after
treatment with FR solution. Since a strong acid can cause damage to cellulose in flax fibre
and leads to a loss of fibre properties, the pH of FR solutions is an important parameter in
explaining the reduction of tensile properties of FR treated composites.15 As seen from Table
1, the pH values of FR solutions decrease with an increase of FR concentration, indicating
that the solution becomes more acidic. Therefore, at higher concentrations of FR solution, the
damage to flax fibre could be more severe, and hence result in a larger reduction of tensile
properties in the FR treated flax/PP composites.
(a) (b)
-6 -4 -2 0 2
0 2 4 6 8 10 12
C h a n g e in t e n s il e m o d u lu s ( M P a )
FR content (wt-%)
FR treated flax/PP FR treated flax/PLA
-6 -4 -2 0 2
0 2 4 6 8 10 12
C h a n g e in f le x u ra l m o d u lu s ( M P a )
FR content (wt-%)
FR treated flax/PP FR treated flax/PLA
Figure 3. The change in (a) tensile and (b) flexural moduli of FR treated flax/PP and flax/PLA composites at different FR contents compared to the control samples (calculated by E of FR composites – E of control).
The flexural modulus of control flax/PP composites is 6.3 GPa. The addition of FR at 7.0
FR-Flax/PP_0.6P. However, once the FR content is further increased, the flexural modulus of
flax/PP starts to decrease gradually to 6.7 and 6.5 GPa with the presence of FR at 9.6 and
10.8 wt-% respectively, and then when the FR content reaches 11.2 wt-%, the flexural
modulus further decreases significantly to 3.3 GPa. This can be explained by the fact that
although the flexural properties of composites are generally polymer matrix dependent, the
fibre-matrix interfacial adhesion could also affect the properties as the low adhesion can lead
to a delamination failure, and hence cause a reduction in the flexural properties.16,17 Since PP
has high chemical resistance, the reduction in flexural properties of FR treated flax/PP could
be due to a decrease in the fibre/matrix interfacial adhesion of the composites, evidence for
which was seen in the SEM images of the fractured surfaces reported in reference.14
The addition of FR to flax/PLA composites at low content, 5.4 and 6.4 wt-%, has a minimal
effect on the tensile modulus (8.5 – 8.8 GPa), which then gradually decreases to 7.4 and 5.0
GPa when the FR content is increased to 7.2 and 9.9 wt-% respectively. The FR significantly
decreases the tensile strength by more than 50% in all samples. The results in Table 3 also
show that the tensile properties of flax/PLA composites are more severely affected by the
presence of FR compared to those of flax/PP composites, as it can seen that at the same FR
content, the reduction in tensile properties, in particular tensile strength, of FR treated
flax/PLA composites is larger than those of FR treated flax/PP composites. As explained
before, this is due to reaction of the FR with PLA as could be seen in the SEM images
reported in our previous publication.14 In Table 4, the results show that FR also causes a
reduction in flexural properties of FR treated flax/PLA, and that the reduction is more severe
at higher FR content, especially at FR contents above 7.2 wt-% at which the flexural modulus
of flax/PLA was reduced by more than 50%, Figure 3(b).
From these results it can be concluded that for flax/PP, FR contents up to ~10.5 wt-% (0.9%
P) and for flax/PLA, FR contents up to ~6.5 wt-% (0.5% P) are the critical levels below
which mechanical properties remain unaffected. As seen from the flammability results in
Table 2, flax/PP achieves a UL-94 V-0 rating, whereas flax/PLA has a borderline V-1 rating.
The effect of pH of FR solution on fire and mechanical performance of FR flax/PP and
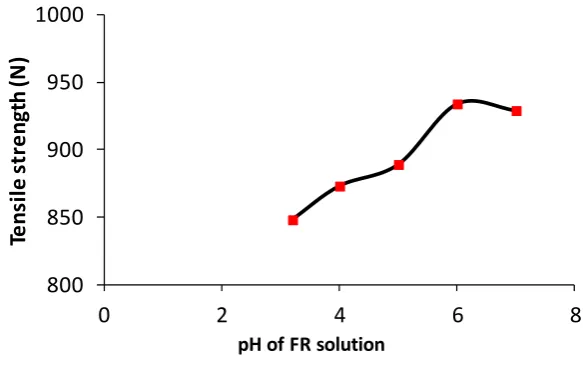
Since the FR solution used in the above section was very acidic (pH 3.2), it is suggested that
one of the reasons for the reduction in mechanical properties of the FR treated flax/PP and
flax/PLA composites is damage to the flax fibres caused by the acidic solution. The first step
to test this hypothesis was to study the effect of pH of FR solution on the tensile strength of
flax fabric. Flax fabric was treated with 20 wt-% FR solution. To adjust the pH of the
solution, sodium acetate (NaOAc) was added to the solution as a buffering agent to reduce
the acidity of the FR solution. The results in Figure 4 show that the tensile strength of FR
treated flax fabric gradually increases with the increase in pH value of the FR solution (i.e.
less acidic), and that this increase then ceases when the pH value increases above 6.0. From
this, the optimal pH of the FR solution capable of maintaining the mechanical properties of
the flax fabric was established as 6.0.
Figure 4. Tensile strength (N) of flax fabrics treated with FR solution at different pH values.
In order to study the effect of pH on the fire and mechanical performance of FR treated
flax/PP and flax/PLA composites, composites were prepared from the fabrics treated with FR
solutions of pH 3.2 (i.e. without pH modification as in the earlier section) and pH 6.0. Based
on the results in Section 3.1, the FR contents of the treated flax/PP and flax/PLA fabrics were
adjusted to give levels of 0.9 and 0.6% P, respectively, as these are the minimum levels of the
FR that are required if the composites are to give a V-0 pass rating in UL-94 tests. The details
of the FR solutions and the actual FR contents of the fabrics are given in Table 5.
800 850 900 950 1000
0 2 4 6 8
Te
n
si
le
s
tr
e
n
gt
h
(N
)
pH of GUP solution
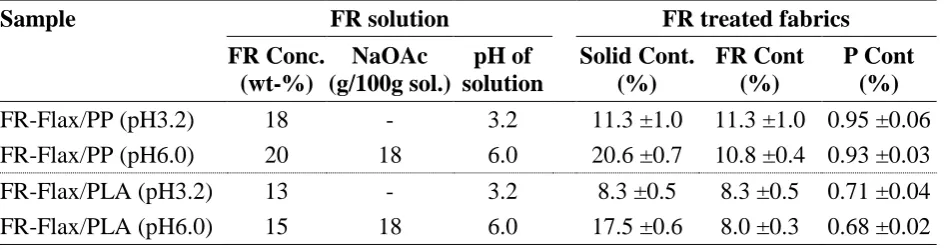
Table 5. Details of flax/PP and flax/PLA fabrics treated with FR solutions at different pH
Sample FR solution FR treated fabrics
FR Conc. (wt-%)
NaOAc (g/100g sol.)
pH of solution
Solid Cont. (%)
FR Cont (%)
P Cont (%)
FR-Flax/PP (pH3.2) 18 - 3.2 11.3 ±1.0 11.3 ±1.0 0.95 ±0.06
FR-Flax/PP (pH6.0) 20 18 6.0 20.6 ±0.7 10.8 ±0.4 0.93 ±0.03
FR-Flax/PLA (pH3.2) 13 - 3.2 8.3 ±0.5 8.3 ±0.5 0.71 ±0.04
FR-Flax/PLA (pH6.0) 15 18 6.0 17.5 ±0.6 8.0 ±0.3 0.68 ±0.02
Composites from these treated fabrics were prepared by melt-pressing eight layers of the
fabrics into 3 mm thick composites, and tested for fire and mechanical properties.
a) Fire performance of FR flax/PP and flax/PLA composites
The UL-94 results in Table 6 show that while the flax/PP sample treated with a FR solution
of pH 3.2 (without the use of buffering agent, sodium acetate) could achieve a V-0 rating, the
one treated with a pH 6.0 solution (with the addition of NaOAc to adjust the pH of the FR
solution), fails the UL-94 test. The cone colorimetric results at 35 kW/m2 in Table 7 show a
similar distinction, although the difference is not as dramatic as in the UL-94 test. With the
addition of NaOAc, FR-Flax/PP (pH 6.0) ignites slightly earlier (46 s as opposed to 60s with
pH 3.2), and while the first PHRR was unaffected, the second increases from 262 to 292
kW/m2 and THR increases from 91 to 112 MJ/m2. This could be due to the phosphoric acid
produced from the FR on heating not only reacting with the composite’s components through
phosphorylation, but also reacting with NaoAc to form sodium phosphate and acetic acid,18,19
hence leading to a reduction in the FR performance of FR in FR-Flax/PP (pH 6.0) compared
to that of FR-Flax/PP (pH 3.2).
In the case of flax/PLA composites, the use of NaOAc in the FR solution results in a similar
trend as that observed in flax/PP samples, namely that the presence of NaOAc increases the
flammability of FR-Flax/PLA from V-0 in FR-Flax/PLA (pH 3.2) to ‘fail’ in FR-Flax/PLA
Table 6. UL-94 results of control and FR treated flax/PP and flax/PLA composites.
Sample Horizontal Rating
B.Length
(mm) B.Time (s)
B.Rate (mm/min)
Flax/PP 100 ±1 258 ±1 24 ±2 Failed
FR-Flax/PP (pH3.2) - - - V-0*
FR-Flax/PP (pH6.0) 100 ±1 503 ±1 12 ±1 Failed
Flax/PLA 100 274 ±5 22 ±2 Failed
FR-Flax/PLA (pH3.2)* - - - V-0
FR-Flax/PLA (pH6.0) -** - - Failed
* The fire went out before reaching the timing mark after removal of the burner
** Sample did not ignite, and hence the burning rate could not be calculated
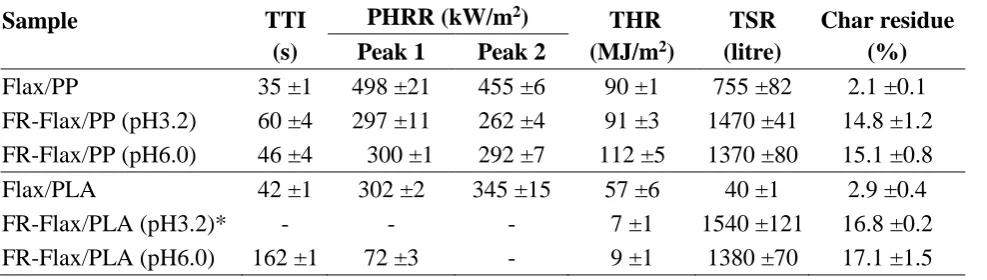
The cone calorimetric results in Figure 5 and Table 7 also show that while at pH 3.2, the FR
helps in prevention of ignition in flax/PLA, with the addition of NaOAc to the FR solution,
FR-Flax/PLA (pH 6.0) ignited at 162 s, and burned with 72 kW/m2 PHRR, producing 9
MJ/m2 THR. This reduction in the fire retardancy can be explained in a similar way to that
proposed for FR-Flax/PP, i.e. that the presence of NaOAc causes a decrease in the reaction
between phosphoric acid, produced from the FR, and the composite components, as
phosphoric acid also reacts with sodium ions from NaOAc through an ion-exchange reaction
to form sodium phosphate.
Table 7. Cone calorimetric results of control and FR treated flax/PP and flax/PLA composites at 35 kW/m2.
Sample TTI PHRR (kW/m2)
THR TSR Char residue
(s) Peak 1 Peak 2 (MJ/m2) (litre) (%)
Flax/PP 35 ±1 498 ±21 455 ±6 90 ±1 755 ±82 2.1 ±0.1
FR-Flax/PP (pH3.2) 60 ±4 297 ±11 262 ±4 91 ±3 1470 ±41 14.8 ±1.2
FR-Flax/PP (pH6.0) 46 ±4 300 ±1 292 ±7 112 ±5 1370 ±80 15.1 ±0.8
Flax/PLA 42 ±1 302 ±2 345 ±15 57 ±6 40 ±1 2.9 ±0.4
FR-Flax/PLA (pH3.2)* - - - 7 ±1 1540 ±121 16.8 ±0.2
FR-Flax/PLA (pH6.0) 162 ±1 72 ±3 - 9 ±1 1380 ±70 17.1 ±1.5
(a) (b) 0 100 200 300 400 500 600
0 200 400 600 800
HRR (kW /m 2) Time (s) Flax/PP GUP-Flax/PP (pH3.2) GUP-Flax/PP (pH6.0) -5 0 5 10 15 20 25
0 200 400 600 800
R SR, ( 1 /s) Time (s) Flax/PP GUP-Flax/PP (pH3.2) GUP-Flax/PP (pH6.0) (c) 0 20 40 60 80 100 120
0 200 400 600 800
Mass (%) Time (s) Flax/PP GUP-Flax/PP (pH3.2) GUP-Flax/PP (pH6.0)
Figure 5. (a) HRR, (b) RSR and (c) mass loss curves of control and FR treated flax/PP composites at 35 kW/m2.
b) Mechanical performance of FR flax/PP and flax/PLA composites
The mechanical properties of composites prepared from the flax/PP and flax/PLA fabrics
treated with FR solutions of pH 3.2 and 6.0, evaluated in tensile and flexural modes are
reported in Table 8. The control sample was also prepared and tested again to eliminate any
differences due to using different batches of raw materials.
Table 8: Mechanical properties of control and FR treated flax/PP and flax/PLA composites
Sample Tensile properties Flexural properties
Modulus (GPa) Strength (MPa) Modulus (GPa) Strength (MPa)
Flax/PP 7.1 ±0.4 79 ±6 7.8 ±0.5 71 ±1
FR-Flax/PP (pH3.2) 5.5 ±0.7 56 ±6 7.8 ±0.5 67 ±1
FR-Flax/PP (pH6.0) 5.8 ±0.1 49 ±3 7.8 ±0.1 77 ±2
Flax/PLA 10.2 ±0.1 141 ±2 14.1 ±0.7 159 ±1
FR-Flax/PLA (pH3.2) 9.7 ±0.1 98 ±5 13.0 ±0.2 132 ±2
FR-Flax/PLA (pH6.0) 9.9 ±0.2 66 ±4 5.4 ±0.3 54 ±2
The results show that the addition of NaOAc to the FR solution to give a pH of 6.0 had only a
minimal effect on the tensile properties of FR-Flax/PP composites prepared from solution
with a pH of 3.2, considering the error range. Within the error range, however there seems to
be slight increase in tensile modulus, but decrease in tensile strength. This is surprising, since
the tensile properties of composites are fibre dependent, and the reduction in the acidity of the
FR solution used for treating flax/PP fabrics should have increased the tensile strength. As
flax fibre can be hydrolysed and lose its mechanical strength under acidic conditions, the
reduction in acidity of the FR+NaOAc solution should have helped to minimise the damage
to the flax fibre, and so to the impairment in the tensile properties of the derived composites,
thus resulting in improved tensile properties of FR-Flax/PP (pH 6.0) compared to those of the
FR-Flax/PP (pH 3.2). In flexural mode, the addition of FR with and without NaOAc did not
affect the properties of flax/PP composites as can be seen from the fact that the control and
FR-Flax/PP samples have similar flexural moduli of 7.8 GPa and flexural strength of ~70
MPa. These similarities arise from the flexural properties of composites being matrix
dependent, and polypropylene being non-reactive towards acids, and therefore not affected by
the change in pH.
In case of flax/PLA composites, the addition of NaOAc to the FR solution to give a pH of
6.0, does not affect the tensile modulus, considering the error range (9.7 GPa with pH 3.2 to
9.9 GPa with pH 6.0). The tensile strength however shows significant decrease from 98 MPa
to 66 MPa in samples made with FR solutions of pH 3.2 and 6.0, respectively. The reduction
in the tensile strength of FR-Flax/PLA (pH6.0) even though the NaOAc helps to reduce the
damage on FR treated flax fibres, may be due to the alkaline NaOAc catalysing hydrolysis of
ester groups (-COO-) in the PLA, hence resulting in the reduction in the mechanical strength
of PLA and its composites. The flexural properties of control and FR treated flax/PLA
composites show that the presence of only FR did not show significant effect on the flexural
properties of flax/PLA as can be seen from the only slight reductions in flexural modulus
(13.0 GPa) and strength (132 MPa) in FR-Flax/PLA (pH 3.2) compared to those of the
control, Table 8. However, with the addition of NaOAc to adjust the pH of the FR solution,
the reduction in flexural properties of Flax/PLA sample becomes significant as
FR-Flax/PLA (pH 6.0) shows much lower flexural modulus (5.4 GPa) and strength (54 MPa)
catalysed hydrolysis of PLA caused by NaOAc, leading to the reduction in mechanical
properties of PLA, and therefore of the matrix dependent flexural properties.
Conclusions
The organophosphonate FR significantly improves the fire performance of flax/PP and
flax/PLA composites and its efficiency is higher in PLA composites, which require a lower
amount of FR than those with a PP matrix to achieve the same level of fire performance. It is
also seen that the efficiency of the FR is not in a linear relationship with the fire performance.
The fire performance of composites improves with increasing FR content up to 0.9% P of FR
content for flax/PP and up to 0.6% P for flax/PLA; further increases in FR content do not
provide any further significant improvement in fire performance. On the other hand, the
increase of FR content causes a significant reduction in mechanical properties of the
composites, especially at high FR contents. Based on these results, the optimum FR contents
for producing fire retardant flax/PP and flax/PLA composites were found to be 0.9% P and
0.6% P respectively.
The flammability and mechanical properties of FR-flax/PP composites prepared from the
flax/PP fabrics treated with FR solution at different pH values (i.e. 3.2 and 6.0), show that the
use of sodium acetate (NaOAc) to reduce the acidity of the FR solution (pH 6.0) helps in
maintaining the mechanical properties of FR treated flax/PP composites, particularly tensile
properties. The effect however was marginal. The addition of NaOAc to the FR solution has a
negative impact on the flammability as NaOAc increased the flammability of FR-Flax/PP
composites, especially in the UL-94 test, where a previous V-0 rating in FR-Flax/PP (pH 3.2)
was reduced to ‘fail’ in FR-Flax/PP (pH 6.0). In the case of FR-Flax/PLA, the results show
that the addition of NaOAc to the FR solution decreases the mechanical properties, especially
in flexural mode. This is due to the NaOAc, an alkali agent, catalysing hydrolysis of PLA,
hence resulting in the reduction in mechanical properties of PLA and of the derived
composites. NaOAc also increases flammability of FR-Flax/PLA similar to that observed in
flax/PP samples, particularly giving rise to a ‘fail’ in a UL94 test compared with the
there is no benefit in using NaOAc to reduce the acidity of the FR solution for preparing FR
treated flax/PP and flax/PLA composites.
Acknowledgements
We thank Innovate UK (formerly Technology Strategy Board) for financial support (TSB
Project No 100982) and the consortium: NetComposites Ltd, IFG Drake Ltd, Tilsatec Ltd,
Sam Weller & Sons Ltd and Exel Composites UK, for providing samples and technical
support.
References
1. Kim NK, Lin RJT, Bhattacharyya D. Flammability and mechanical behaviour of
polypropylene composites filled with cellulose and protein based fibres: A comparative
study. Comp Part A, 2017; 100: 215 – 226.
2. Kandola BK. Flame Retardant Characteristics of Natural Fibre composites. In: John MJ,
Thomas S, editors. Natural Polymers, Volume1: Composites, RSC Publishing,
Cambridge, 2012. p 86 – 117.
3. Huda MS, Drzal LT, Ray D, Mohanty AK, Mishra M, Natural-fibre composites in
automotive sector. In Pickering KL, editor. Properties and performance of natural-fibre
composites.Woodhead Publ Ltd., 2008, Chapter 7, pp 221- 268.
4. Biotex high performance natural composites
http://www.bio-based.eu/iBIB/pdf/2012/39.pdf (accessed August 2018).
5. Chapple S, and R. Anandjiwala, Flammability of natural fiber-reinforced composites and
strategies for fire Retardancy: A review, J. Thermoplastic Comp. Mater., 2010; 23(6):
871-893.
6. Hapuarachchi TD, Peijs T. Multiwalled carbon nanotubes and sepiolite nanoclays as
flame retardants for polylactide and its natural fibre reinforced composites. Compos Part
A Appl Sci., 2010; 41(8): 954 – 963.
7. Schartel B, Braun U, Schwarz U, Reinemann S. Fire retardancy of polypropylene/flax
8. Dorez G, Taguet A, Ferry L, Lopez-Cuesta JM. Thermal and fire behaviour of natural
fibers/PBS biocomposites. Polym Deg Stab., 2013; 98(1): 87-95.
9. Shumao L, Jie R, Hua Y, Tao Y, Weizhong Y. Influence of ammonium polyphosphate on
the flame retardancy and mechanical properties of ramie fiber reinforced poly(lactic acid)
biocomposites. Polym Int., 2009; 59(2):242 – 248.
10. Bocz K, Szolnoki B, Wladyka-Przybylak M, Bujnowicz K, Harak_aly Gy, Bodzay B, et al.
Flame retardancy of biocomposites based on thermoplastic starch. Polimery, 2013; 58(5):
385 - 394.
11. Suardana NPG, Ku MS, Lim JK. Effects of diammonium phosphate on the flammability
and mechanical properties of bio-composites. Mater Des., 2011; 32(4): 1990 - 1999.
12. Kandola BK. Flame Retardancy Design for Textiles. In: Wilkie CA, Morgan AB, editors.
Fire Retardancy of Polymeric Materials, Second Edition, CRC Press, London, 2009. p 725
– 761.
13. Lewin M. Fire retarding of polymers with sulfamates. I. Sulfation of cotton and wool. J
Fire Sci., 1997; 15: 263-276.
14. Pornwannachai W, Ebdon JR, Kandola BK. Fire-resistant natural fibre-reinforced
composites from flame retarded textiles. Polym Deg Stab., 2018; 154: 115-123.
15. Lin JH, Chang YH, Hsu YH. Degradation of cotton cellulose treated with hydrochloric
acid either in water or in ethanol. J. Food Hydrocolloids, 2009; 23: 1548-1553.
16. Wu K, Kandola BK, Kandare E, Hu Y. Fire Retardant Effect of Polyhedral Oligomeric
Silsesquioxane and Triglycidyl Isocyanurate on Glass Fibre-Reinforced Epoxy
Composites. Polym Comp, 2011; 32: 378-389.
17. Kim JK, Mai YW. Engineered Interfaces in Fibre Reinforced Composites, Elsevier
Science Ltd, Amsterdam, 1998.
18. Horrocks AR. An Introduction to the Burning Behaviour of Cellulosic Fibres. J. Soc.
Dyers Color., 1983; 99 (7-8): 191 – 197.
19. Horrocks AR. Fire-retardant Finishing of Textiles. Rev. Prog. Color. Rel. Top., 1986: 16
Captions to Tables
Table 1. The FR contents on fire retarded flax/PP and flax/PLA fabrics.
Table 2. UL-94 results of control and FR treated flax/PP and flax/PLA composites
Table 3. Cone calorimetric results of FR containing flax/PP and flax/PLA composites at 35 kW/m2.
Table 4. Mechanical properties of control and FRs contained flax/PP and flax/PLA composites
Table 5. Details of flax/PP and flax/PLA fabrics treated with FR solutions at different pH
Table 6. UL-94 results of control and FR treated flax/PP and flax/PLA comp
Table 7. Cone calorimetric results of control and FR treated flax/PP and flax/PLA composites at 35 kW/m2.
Table 8: Mechanical properties of control and FR treated flax/PP and flax/PLA composites
Captions to Figures
Figure 1. Cone calorimetric results of control and FR treated (a-c) flax/PP and (d-f) flax/PLA at 35 kW/m2: (a,d) HRR, (b,e) RSR and (c,f) mass loss curves as a function of time.
Figure 2. The change in TTI, 1st PHRR, and charred residue of FR treated flax/PP and
flax/PLA samples compared to those of the control at 35 kW/m2 as a function of phosphorus
content
Figure 3. The change in (a) tensile and (b) flexural moduli of FR treated flax/PP and flax/PLA composites at different FR contents compared to the control samples (calculated by
E of FR composites – E of control).