Transition of the
NSW Public Health Bulletin
to
Public Health Research & Practice
Sarah Thackway
A,Cand Sally Redman
B ACentre for Epidemiology and Evidence, NSW Ministry of Health B
The Sax Institute
CCorresponding author. Email: [email protected]
TheNSW Public Health Bulletinhas achieved much over the
past 24 years1 and there is a great deal to celebrate. To
support an agile, contemporary, public health environment theBulletinis about to enter a new phase in its evolution – one that builds on its proud history and strongly positions
public health for the future. TheBulletinwill be renamed
Public Health Research & Practiceand will strengthen its focus on supporting knowledge-driven policies and the provision of best practice public/population health services and programs in NSW and across Australia. This will be underpinned by original, policy-relevant research and arti-cles on implementing and evaluating innovative NSW policies, services and programs. Editorial management and production will move to the Sax Institute and be
overseen by an Editorial Board (Box 1).
Both the NSW Health and Medical Research Strategic
Review2and the NSW Government Evaluation Framework3
emphasise the potential for research and evaluation to strengthen policy and practice across health. For this poten-tial to be realised, new approaches to designing and conducting research and to sharing our findings will be
required. We intend thatPublic Health Research & Practice
will become a key platform in using research to inform public health policy and practice across NSW and Australia more broadly.
The optimal generation and use of evidence will require many things. For example, strong evaluation embedded into the rollout of policies and programs will make the most
of opportunities to learn what works and under what
condi-tions. The NSW Government Evaluation Framework3
makes this clear saying:
Evaluation is a key tool to support evidence based policy and decision making in government, to help government learn and adapt to changing environments and as a tool for communicating and sharing valuable information. When planned, designed and conducted in accordance with good practice standards, evaluation can provide the necessary evidence to improve ser-vices and guide better resource allocation decisions.
Better tools and methods for the kinds of research that can inform practice will also be required – for example, how
can we best consider factors like scalability4and
reproduci-bility? How do we best estimate likely real world costs and benefits? How can we harness technology to respond to emerging public health threats? And what can be done to provide control or comparison groups when randomised trials are not possible?
Co-creation of research where researchers, policy makers and practitioners work together to design, implement, inter-pret and disseminate research will be crucial to this effort. Each has important expertise to bring to the collaborative effort. Co-creation of research has the potential to result in rigorous tests of strategies in a timely way that could feasibly be implemented at the state or national levels.
Public Health Research & Practice will strengthen the connection between research, policy and practice and support the population health workforce in NSW to find
and use the best available evidence in the time available.5
We will actively seek papers describing research that has used a co-creation approach and is based in a ‘real world’ setting, and will be particularly interested in papers
Vol. 24(4) 2014
ISSN 1034 7674
NSW PUBLIC HEALTH
BULLETIN
CONTENTS – See back page w w w . p u b l i s h . c s i r o . a u / j o u r n a l s / p h b
describing the evaluation of innovative policies and pro-grams in the field. This will instigate a new stream of discussion to drive forward the development of methods that work more effectively to understand the impact of health issues, policies and programs in the field. NSW Health and the Sax Institute are excited about this new phase in the development of the journal and we are looking forward to working with researchers, policy makers and practitioners to further strengthen our investment into evidence-informed policy and practice.
References
1. Thackway S, Goldsworthy KM, Stickney B, Milat AJ. Reflections on 24 years of theNSW Public Health Bulletin. N S W Public Health Bull2014; 24(4): 151–2.
2. Population Health Division, NSW Ministry of Health. NSW Health and Medical Research Strategic Review 2012. Available at: http://www0.health.nsw.gov.au/pubs/2012/pdf/ medical_strategic_review_.pdf (Cited 14 April 2014).
3. Department of Premier and Cabinet. NSW Government. NSW Government Evaluation Framework August 2013. Available at: http://www.dpc.nsw.gov.au/__data/assets/ pdf_file/0009/155844/NSW_Government_Evaluation_ Framework_August_2013.pdf (Cited 14 April 2014).
4. Milat AJ, King L, Bauman AE, Redman S. The concept of scalability: increasing the scale and potential adoption of health promotion interventions into policy and practice.Health Promot Int2013; 28(3): 285–98. doi:10.1093/heapro/dar097
5. Lavis JN, Oxman AD, Lewin S, Fretheim A. SUPPORT Tools for evidence-informed health Policymaking (STP).Health Res Policy Syst2009; 7(Suppl 1): I1. doi:10.1186/1478-4505-7-S1-I1
Box 1. Public Health Research & PracticeEditorial Board
Professor Bruce Armstrong Editorial Board Member
Senior Advisor, Research Assets, The Sax Institute
Professor Adrian Bauman Section Editor – Prevention of Chronic Disease
Sesquicentenary Professor, Sydney School of Public Health, The University of Sydney
Professor Sandra Eades Section Editor – Equity
Head Aboriginal Health Program, Baker IDI Heart and Diabetes Institute
Professor Mark Harris Section Editor – Primary Care
Executive Director, Centre for Primary Health Care and Equity, The University of New South Wales
Professor Bette Liu Scientific Editor
Senior Science Advisor, The Sax Institute
Dr Jeremy McAnulty Section Editor – Communicable Disease
Director, Health Protection NSW
Professor Sally Redman Editor-in-Chief
CEO, The Sax Institute
Professor Wayne Smith Editorial Board Member
Director, Environmental Health, Health Protection NSW
Associate Professor Sarah Thackway Editorial Board Member
Director, Centre for Epidemiology and Evidence, NSW Ministry of Health
Mr Bob Wells Editorial Board Member
Deputy CEO, The Sax Institute
Professor John Wiggers Section Editor – Practice, Policy and Programs
Director, Population Health, Hunter New England Health
Professor Andrew Wilson Editorial Board Member
Director, The Australian Prevention Partnership Centre
Reflections on 24 years of the
NSW Public Health Bulletin
Sarah Thackway
A, Kristy M. Goldsworthy
A,B,D,
Beth Stickney
A,Cand Andrew J. Milat
A,C ACentre for Epidemiology and Evidence, NSW Ministry of Health B
Editorial Manager, NSW Public Health Bulletin C
Editor, NSW Public Health Bulletin
DCorresponding author. Email: [email protected]
The birth of theBulletin
The year 1990 was a landmark for public health in New South Wales (NSW). The Public Health Division at the then NSW Department of Health was in its infancy, having been formed at the end of 1989, and funding for a program to enhance public health in NSW led to the establishment of a network of Public Health Units and the NSW Public
Health Officer Training Program.1TheNSW Public Health
Bulletin was established in May 1990 to disseminate accurate and timely information among this newly formed public health network and to provide regular feedback to practitioners on notifiable conditions. It was hoped that the
Bulletin would assist in ‘‘the development of a vibrant
public health network in NSW’’,2and ‘‘provide a useful
mechanism for exchange of information and ideas on investigations, programs, and evaluations that (may) affect
the health of the citizens of NSW’’.1
From its inception, the aim of theBulletinwas to provide
its readers with population health information and data to inform effective public health action. Early editions were of variable length (although generally short) and consisted of practical information for the public health network: short reports, news and comment, letters to the Editor, summaries of infectious disease notifications, and public health abstracts. Copies were distributed in collab-oration with the new Public Health Units to the then Area Health Services, hospitals, major laboratories, universities, medical practitioners, and other state health departments.
Enhancement of content, rigour, role and recognition
By 1995, the landscape was changing: issues of the
Bulle-tinwere becoming longer and the papers more
academi-cally rigorous. Infectious disease content still featured strongly but a broader range of topics was being covered. Special editions focusing on a specific area of public health significance commenced, with guest editorials authored by experts in the field. Peer review was introduced to maintain standards and ensure rigour and relevance. At the
beginning of 1996, theBulletinbegan to be published in an
online format as well as in print.
The transformation of the Bulletin in its first decade
culminated in the successful application in early 2002 to the Literature Selection Technical Review Committee (LSTRC) of the National Library of Medicine, National Institutes of Health (Maryland, USA) for indexing in Index Medicus and Medline. As the major international source of citation and the gateway to public health and bio-medical journals, the decision by the LSTRC to accept theBulletinfor indexing was to be celebrated. At the time, around 120 journals were reviewed each year by the LSTRC and only 15–20% of those were successful in their applications to be accepted for indexing. Criteria for acceptance related to: scope and coverage (relevance to the biomedical field); quality of content (scientific merit of the papers); quality of the editorial work (including processes such as peer review); production quality (layout, design and graphics); audience (intended for health profes-sionals); and types of content (with statistical compilations
and critical reviews preferred).3A survey of a sample of
theBulletin’s readership in 2005 indicated that the
inclu-sion of theBulletinin Medline was highly valued:
[It] is seen as a measure of the journal’s quality and thereby adds status to the Bulletin; increases the accessibility and international exposure for articles published; and helps showcase public health issues
and endeavours in NSW.4
The 2005 readership review also found substantial support
and respect for theBulletin, along with a strong sense of
‘ownership’ amongst its stakeholders.4 A valued aspect
was the workforce development role of theBulletin: it was
not just another avenue for established authors to publish, but an opportunity for those new to writing for publication to develop their skills in a supportive environment.
Improved reach, processes and promotion
In 2007 theBulletinentered into a publishing partnership
with CSIRO Publishing. This was the next phase in the
Bulletin’s evolution, taking it to a larger, more professional publication with a broader reach. A new design was unveiled, and an enhanced website hosted by CSIRO Publishing was launched. The new website allowed for PDF and HTML versions to be uploaded in advance of the hard copy distribution and for the introduction of a
subscription-based ‘Early Alert’ service to facilitate imme-diate access to each new issue as it was published online. New resources were developed for reviewers, including guidelines designed to foster the development of critical peer review skills and a standard reviewer report form to guide reviewers through the process. Guidelines for authors were also updated to reflect best publishing prac-tice. The partnership with CSIRO Publishing also led to increased exposure and promotion at relevant health con-ferences. Free access, a cornerstone of the publication, was
preserved: work published in theBulletinremained freely
available, without any subscription barriers. This will continue to be the case as the Sax Institute takes over from
CSIRO Publishing as the publisher of the journal.5
Achievements and contributors
Of the past Editors of the Bulletin, three were largely
responsible for its growth and evolution: Professor George Rubin (May 1990–May 1994), Professor Michael From-mer (June 1994–March 1998), and the longest running Editor, Associate Professor Lynne Madden (April 1998– October 2012, with two sabbaticals in this period). While ultimately rewarding, the role of Editor is a challenging one; the past Editors are gratefully acknowledged for their
commitment and contribution to theBulletin. There have
been many editorial support staff during the Bulletin’s
lifetime, the longest serving of these being Dr Michael Giffin (November 1998–January 2005), who played an
integral role in shaping theBulletin, establishing many of
its editorial processes, and securing indexing in Index Medicus and Medline.
At the completion of Volume 24, close to 1500 items have been published and an average of 220 000 papers are downloaded per year. These downloads are from all
volumes, indicating that theBulletin, as a body of work,
is contributing to a culture of evidence-based practice. The
Bulletin’s Scopus SCImago Journal Rank (SJR), which measures citations to a publication and weights them
according to the SJR score of the citing journal, has been
rising since 2008, showing that theBulletinis well
posi-tioned in relation to comparable journals. While the majority of the readership remains local, download and
access statistics show that the Bulletin is read widely:
within Australia, readership from Victoria and Queensland is strong, and internationally, numbers from the USA, Canada and the United Kingdom are consistent.
On behalf of the editorial team we would like to sincerely
thank the many contributors to theBulletinover the past
24 years. The strength of the journal has always been the large investment of time and effort by authors, reviewers, and editors, all of whom have generously contributed their expertise.
The future:Public Health Research & Practice
As we enter the next exciting phase in the journal’s
history,5 we hope that the 24 volumes published under
the title ‘NSW Public Health Bulletin’ leave a lasting
legacy and will continue to be referred to, both as an important historical record of public health in NSW and as sources of evidence for future practice.
References
1. Rubin G. Improved public health.N S W Public Health Bull 1990; 1: 2.
2. Morey S. New Public Health Bulletin for NSW.N S W Public Health Bull1990; 1: 1.
3. Madden D, Giffin M. Index Medicus and Medline recognise NSW Public Health Bulletin. N S W Public Health Bull2002; 13: 1–2. doi:10.1071/NB02001
4. Madden DL. Tailoring the Bulletin to meet readership needs. N S W Public Health Bull2006; 17(11–12): 161–2.
Reporting postpartum haemorrhage
with transfusion: a comparison
of NSW birth and hospital data
Jillian A. Patterson
A,C, Christine L. Roberts
A,
Lee K. Taylor
Band Jane B. Ford
AA
Clinical and Population Perinatal Health, Kolling Institute of Medical Research
B
Centre for Epidemiology and Evidence, NSW Ministry of Health C
Corresponding author. Email: [email protected]
Abstract: Aim: Postpartum haemorrhage rates have been increasing in NSW and internationally, and blood transfusion is required in severe cases. Using routinely collected administrative data provides a convenient method with which to monitor trends in both postpartum haemorrhage and associated transfusion use. In order for this to be feasible however, the reliability of reporting of
the conditions needs to be assessed. Methods:
This study used linked data to compare the reporting of postpartum haemorrhage with trans-fusion as reported in the NSW Admitted Patient Data Collection (hospital data), with the same information obtained from the Perinatal Data Collection (birth data), for births in NSW
from 2007 to 2010. Results: The rate of
post-partum haemorrhage requiring blood transfu-sion was 1.0% based on the hospital data and 1.1% based on the birth data, with a rate of 1.7% if identifying cases from either source. Agree-ment between the two sources improved from fair
to moderate over the time period. Conclusion:
Postpartum haemorrhage requiring transfusion recorded in the birth data shows only moderate agreement with hospital data, so caution is recommended when using this variable for anal-ysis. Linkage of both datasets is recommended to identify birth information from birth data and postpartum haemorrhage with transfusion from hospital data until further validation work has been undertaken.
An important application of population health data is identifying and monitoring trends in adverse outcomes
which may require further investigation or intervention.1–3
In maternal health, one commonly monitored adverse outcome of childbirth is severe postpartum haemorrhage (PPH). Postpartum haemorrhage involves excessive blood loss post-childbirth, and affects about 6% of women in
NSW,4with rates increasing locally and internationally.5
Severity of PPH is commonly defined by quantity of blood
lost, however this can be difficult to estimate,6so blood
product transfusion has become widely used as a marker of severe maternal morbidity associated with childbirth. In combination with routinely collected population data col-lections this marker has been used to monitor changes in morbidity over time, providing a timely and cost-effective
way of monitoring trends.7,8In order for a marker to be a
good indicator of the health of the population it needs to be
reported reliably and in a timely fashion.9–12
Currently, local studies reporting PPH requiring transfu-sion use hospital diagnosis and procedure codes recorded
in hospital separation data.4Ascertainment of both PPH
(sensitivity 73.8%, specificity 98.9%) and transfusion (sensitivity 83.1%, specificity 99.9%) is relatively high, and the sensitivity of PPH in women requiring transfusion
is 92.5% when compared with medical records.13
How-ever, hospital data are not the best source of birth data. Identifying birth admissions from hospital records relies on the presence of a diagnosis code identifying a live or stillbirth, which differs in reliability when there are multi-ple births and according to birth outcome and has been shown to miss some births identified in legislated birth
data.14,15Additionally, hospital data lack detail on parity,
gestation and obstetric history, which are important risk factors for PPH. Use of hospital records requires linkage to birth data to accurately identify hospitalisations related to a pregnancy or birth. This affects the timeliness of the data, with linked birth and hospital data available 12–18 months later than birth data alone. Birth records, collected by midwives at the time of birth, are more timely, available after 12 months, and do not require linkage in order to identify births. Until recently, no data on blood transfusion was collected in these birth records. In 2007, New South Wales (NSW) birth data collections included a new vari-able ‘PPH requiring transfusion’. The reliability of this variable has not yet been assessed. This project compared
the reporting of PPH with blood transfusion in the hospital records to the new variable in the birth data.
Methods
Births were identified from the Perinatal Data Collection (‘birth data’), a statutory collection of all births in NSW of at least 20 weeks gestation or 400 g birthweight. Hospital birth admissions were identified from the Admitted Patient Data Collection (‘hospital data’) which is a census of all public and private hospital separations in NSW, containing infor-mation on procedures and diagnoses, coded according to the 10th revision of the International Classification of Diseases,
Australian Modification (ICD10-AM),16and the Australian
Classification of Health Interventions.17 Probabilistic
record linkage between the birth and hospital data was carried out by the NSW Centre for Health Record Linkage. All women giving birth in NSW hospitals from 1 January 2007 to 31 December 2010, where a corresponding hospital birth record was available, were included in this study.
The birth data, including demographic and medical infor-mation on the mother, as well as inforinfor-mation on the labour, delivery and infant, is collected by the attending midwife or medical practitioner. PPH requiring transfusion is recorded if there was a ‘‘postpartum haemorrhage
requir-ing transfusion of whole blood or packed cells’’.18In the
hospital data, blood transfusion was defined as a record of transfusion of packed cells or whole blood in any of the
first 20 procedure codes in the maternal birth admission. Similarly, PPH according to the hospital data was defined as a diagnosis of PPH in any of the first 20 diagnosis
fields.19Hospitals were categorised by hospital type and
annual number of deliveries (grouped to reflect similarity of practice by hospital size).
As neither hospital nor birth data could be considered a ‘gold standard’ for PPH with transfusion reporting, we assessed agreement based on kappa statistics, and com-pared characteristics of discordant cases. Kappa statistics were classified as follows: near perfect (0.81–1), excellent (0.61–0.80), moderate (0.41–0.60), fair (0.21–0.40), slight
(0.01–0.21) and no agreement (,0.01).20
Results
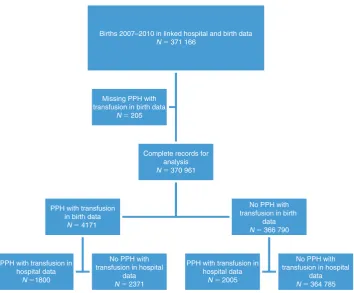
From 2007 to 2010 there were 371 166 births recorded in the linked hospital and birth data: 205 (0.1%) were missing the birth data field for PPH requiring transfusion, leaving 370
961 births for analysis (Figure 1). Based on the hospital data
the rate of PPH was 7.6%, and the rate of transfusion of packed cells was 1.4%. The rate of PPH with blood transfusion was 1.0% based on the hospital data and 1.1%
according to the birth data (Table 1). In the hospital data,
blood transfusion rates increased from 1.4% in 2007 to 1.5%
in 2010 (p¼0.006), PPH rates increased from 7.1% to 7.8%
(p,0.0001) and the combination of PPH with transfusion
increased from 1.0% to 1.1% (p¼0.02). In the birth data,
Births 2007–2010 in linked hospital and birth data N 371 166
Complete records for analysis N 370 961
PPH with transfusion in birth data
N 4171
PPH with transfusion in hospital data
N 1800
No PPH with transfusion in hospital
data
N 2371
No PPH with transfusion in birth
data N 366 790
PPH with transfusion in hospital data
N 2005
No PPH with transfusion in hospital
data N 364 785 Missing PPH with
transfusion in birth data
N 205
Figure 1. Study population for comparison of reporting of postpartum haemorrhage (PPH) with transfusion between birth and hospital data, NSW, 2007–2010.
PPH with transfusion increased from 1.2% to 1.3% (p¼
0.03), despite lower rates in 2008–2009. When considering identification from either source, the rate of PPH with blood transfusion was 1.7%. In hospitals with an average of over 50 births per year, the rates of women experiencing PPH with transfusion as recorded in the birth data ranged between 0.13% and 5.63%, and in the hospital data between 0% and 2.31%. The range of differences between birth
data and hospital data was1.33% and 4.24% (data not
shown). Sensitivity analysis was undertaken to determine if concordance differed between vaginal and caesarean births, however rates were similar (data not shown).
Overall, the PPH with transfusion as ascertained from the hospital and birth data had moderate agreement
(kappa¼0.45) (Table 2). Agreement tended to increase
from 2007 to 2010 (Table 2). Twenty (17%) of the 116
hospitals reported PPH with transfusion with near perfect
agreement. The proportion of hospitals reporting near perfect agreement increased from 15% in 2007 to 31% in 2010, while those reporting fair agreement decreased from 30% in 2007 to 15% in 2010. This increase in agreement was due to increased reporting in the birth data, with the proportion of PPH with transfusion identified in the hospi-tal data alone decreasing from 33.3% in 2007 to 22.3% in 2010, and those reported in both data sources increasing
from 22.9% to 42.5% (Table 3).
PPH with transfusion was more likely to be reported only in the birth data than only in hospital data for primiparae (29.4% vs 24.9%), pre-labour caesarean sections (17.5% vs 11.8%) and for births in regional (47.4% vs 9.7%) or
private (31.5% vs 8.4%) hospitals (Table 3), and less likely
to be reported for multiple births (2.7% vs 4.3%), caesarean section with labour (11.2% vs 14.8%) and births at tertiary obstetric hospitals (13.9% vs 63.3%).
Of the 4171 women reported in the birth data to have had a PPH with transfusion, 68% of women were recorded in the hospital data as having a PPH, and 53% were recorded in the hospital data as having received a blood transfusion. Both PPH and blood transfusion were recorded for 43.2% of these women (concordant cases). Further investigation of hospital data reporting indicated that 236 (10.0%) of the 2371 discordant birth data records indicating a PPH with transfusion may have been for haematomas or antepartum/ intrapartum bleeding. Sixty-eight (2.9%) records identi-fied as PPH with transfusion in the birth data had a record of transfusion of another blood product recorded in the hospital data.
Discussion
We compared the new ‘PPH requiring transfusion’ vari-able reported in the birth data with the previously validated ‘PPH with transfusion’ variable from the hospital data and demonstrated moderate agreement. PPH with transfusion
in the hospital data is known to have sensitivity of 92.5%.13
Assuming this rate of underreporting in the hospital data, having observed 3805 admissions with PPH and transfu-sion, we would expect the true number to be around 4114, resulting in a PPH with transfusion rate of 1.1%. In the birth data we observed a rate of 1.1%. As there is only
Table 1. Concordance of postpartum haemorrhage (PPH) with transfusion cases identified from hospital data and birth data, NSW, 2007]2010
Hospital data PPH with transfusion
recorded
PPH with transfusion not recorded
Total
n(%) n(%) n(%)
Birth data PPH with transfusion recorded 1800 (0.5) 2371 (0.6) 4171 (1.1)
PPH with transfusion not recorded 2005 (0.5) 364 785 (98.3) 366 790 (98.9)
Total 3805 (1.0) 367 156 (99.0) 370 961 (100.0)
Source: New South Wales (NSW) Perinatal Data Collection and NSW Admitted Patient Data Collection, NSW Ministry of Health.
Table 2. Agreement in reporting of postpartum haemorrhage between birth data and hospital data, NSW, 2007]2010
Kappa (95% CI) Agreement
Overall 0.45 (0.43–0.46) Moderate
Mode of delivery
Vaginal 0.44 (0.43–0.46) Moderate
Caesarean 0.45 (0.43–0.47) Moderate
Year
2007 0.37 (0.34–0.39) Fair
2008 0.36 (0.33–0.39) Fair
2009 0.44 (0.41–0.47) Moderate
2010 0.59 (0.57–0.62) Moderate
Hospital type
Tertiary obstetric 0.49 (0.47–0.51) Moderate
Regional 0.47 (0.44–0.49) Moderate
Urban/other 0.36 (0.32–0.40) Fair
Private 0.37 (0.34–0.40) Fair
Annual delivery volume
20–499 0.45 (0.42–0.49) Moderate
500–999 0.46 (0.43–0.50) Moderate
1000þ 0.44 (0.43–0.46) Moderate
Source: New South Wales (NSW) Perinatal Data Collection and NSW Admitted Patient Data Collection, NSW Ministry of Health.
Reporting postpartum haemorrhage with transfusion
moderate agreement observed between the two sources, however, considering identification from either source (1.7%) would lead to a possible 55% overestimation. We also noted an increase in reliability of the birth data in later
years. This was associated with improved reliability in a small number of hospitals, particularly in hospitals with a research interest around postpartum haemorrhage or transfusion.
Table 3. Characteristics of women with postpartum haemorrhage (PPH) with transfusion identified in either the birth data alone, hospital data alone, or both, NSW, 2007]2010
Source of identification of PPH with transfusion
Variable Both
n(%)
Hospital data only
n(%)
Birth data only
n(%)
p-value
Overall 1800 (100.0) 2005 (100.0) 2371 (100.0)
Yeara
2007 376 (20.9, 22.9) 546 (27.2, 33.3) 719 (30.3, 43.8) ,.0001
2008 335 (18.6, 22.7) 556 (27.7, 37.6) 589 (24.8, 39.7)
2009 432 (24.0, 28.6) 559 (27.9, 37.0) 519 (21.9, 34.4)
2010 657 (36.5, 42.5) 344 (17.2, 22.3) 544 (22.9, 35.2)
Age (years)
,20 100 (5.6) 95 (4.7) 124 (5.2) 0.0371
20–24 259 (14.4) 330 (16.5) 335 (14.1)
25–29 460 (25.6) 532 (26.5) 609 (25.7)
30–34 530 (29.4) 573 (28.6) 740 (31.2)
35–39 357 (19.8) 373 (18.6) 480 (20.2)
40þ 94 (5.2) 102 (5.1) 83 (3.5)
Multiple birth
Yes 78 (4.3) 87 (4.3) 63 (2.7) 0.003
No 1722 (95.7) 1918 (95.7) 2308 (97.3)
Primiparae
Yes 468 (26.0) 500 (24.9) 696 (29.4) 0.0026
No 1332 (74.0) 1505 (75.1) 1675 (70.6)
Gestational age
(weeks) 20–32 77 (4.3) 82 (4.1) 67 (2.8) 0.0059
33–36 142 (7.9) 159 (7.9) 149 (6.3)
37þ 1560 (86.7) 1732 (86.4) 2130 (89.8)
Delivery type
Normal vaginal 894 (49.7) 996 (49.7) 1238 (52.2) 0.1512
Caesarean section (CS) (total) 512 (28.4) 533 (26.6) 680 (28.7) 0.2586
CS – No labour 234 (13.0) 237 (11.8) 415 (17.5) ,.0001
CS – Labour 278 (15.4) 296 (14.8) 265 (11.2) ,.0001
Instrumental (total) 404 (22.4) 472 (23.5) 465 (19.6) 0.0048
Forceps 198 (11.0) 222 (11.1) 192 (8.1) 0.0008
Vacuum 206 (11.4) 250 (12.5) 273 (11.5) 0.531
Private patient in public hospital
Yes 172 (9.6) 210 (10.5) 193 (8.1) 0.0275
No 1628 (90.4) 1795 (89.5) 2178 (91.9)
Hospital type
Tertiary obstetric 779 (43.3) 1269 (63.3) 330 (13.9) ,.0001
Regional 594 (33.0) 195 (9.7) 1125 (47.4)
Urban/other 154 (8.6) 373 (18.6) 169 (7.1)
Private 273 (15.2) 168 (8.4) 747 (31.5)
Annual delivery volume
20–499 256 (14.2) 51 (2.5) 551 (23.2) ,.0001
500–999 281 (15.6) 126 (6.3) 521 (22.0)
1000þ 1263 (70.2) 1828 (91.2) 1293 (54.5)
a
Differences in the collection of data may explain some of the variation. Birth data is collected by the midwives and clinicians attending the birth, with the variable ‘PPH requir-ing transfusion’ berequir-ing recorded as a check box on an electronic data entry form. In the hospital data, both transfu-sion and PPH are coded by hospital coders based on notes written in the medical record. PPH can only be coded from the medical record if it is specifically written as such in the notes.
The lower reporting of PPH with transfusion in birth data following more complex birth situations (multiple births, after caesarean section following labour, and at tertiary obstetric facilities) may be related to differences in data recording. Obstetric staff compiling birth data may not have details available of events occurring outside the labour ward, whereas medical coding departments may have additional information from operation reports. Vali-dation studies have demonstrated that birth data more accurately report labour and delivery factors than
subse-quent events,9 and that procedures (e.g. transfusion) are
well ascertained in hospital data.9
Some of the discordant records may relate to misclassifi-cation of transfusion type or timing. A French study compared the reporting of transfusion in a birth database
with records from the blood bank,21treating the blood bank
data as the gold standard, finding sensitivity of 61.4%, and positive predictive value of 82.2%, with kappa 0.7. In their study, birth records misclassified as blood transfusion were typically transfusion of another blood product (other than red cells) or other product for bleeding. This was also the case in our study. In the French study, transfusions not recorded in the birth record were for transfusions outside of the obstetric department (intensive care unit, during trans-fers between hospitals) or were miscoding. Importantly, the birth data imply that a transfusion occurred post-haemorrhage, however the timing of diagnoses and proce-dures recorded in the hospital data cannot be ascertained. It is possible that some of the transfusions recorded in the hospital data occurred for antepartum rather than postpar-tum haemorrhage. An earlier study using NSW hospital data indicated that 75% of obstetric transfusions were for postpartum haemorrhage and a further 8% were for
ante-partum haemorrhage (occurring prior to birth).22
Population health datasets can provide a rich source of data for research, but their usefulness is limited by the quality of
the data they contain.10–13 Previous studies have shown
that accepting diagnoses from more than one data source can increase ascertainment, without increasing false
positives,10,23,24however this is not always the case, and
this study suggests that identifying PPH with transfusion from either birth or hospital data would result in over-ascertainment of around 55%.
This study used one dataset (hospital data) to validate another dataset (birth data). While this allows for an initial
assessment of the reliability of the birth data variable, an ideal assessment would have been to use a ‘gold standard’ such as medical record review for validation. However, such validation studies are resource intensive and difficult to justify for single, relatively rare outcomes. Previous validation studies have shown that PPH and transfusion are
underreported in the hospital data.13
Conclusion
We have shown that the new variable ‘PPH requiring transfusion’ being collected on the birth data shows only moderate agreement with hospital data. We would there-fore recommend that researchers use the birth data variable with caution until further validation has been undertaken. Where possible, birth data linked with hospital data can be used to identify PPH with transfusion. An advantage of this approach is that, although there is some under-ascertain-ment, these data have already been validated. The changes in ascertainment over time in the birth data indicate that early years of data collected on PPH requiring transfusion should be excluded from trend analysis, to prevent improved ascertainment being interpreted as a change in incidence.
Acknowledgments
Jillian Patterson was supported by a National Health and Medical Research Council (NHMRC) Partnership Grant (#1027262). Christine Roberts is supported by a NHMRC Senior Research Fellowship (#1021025). Jane Ford is supported by an Australian Research Council Future Fellowship (#120100069). We thank the NSW Ministry of Health for access to the population health data and the NSW Centre for Health Record Linkage for linking the datasets.
References
1. Callaghan WM, Mackay AP, Berg CJ. Identification of severe maternal morbidity during delivery hospitalizations, United States, 1991-2003.Am J Obstet Gynecol2008; 199(2): 133. doi:10.1016/j.ajog.2007.12.020
2. Joseph KS, Rouleau J, Kramer MS, Young DC, Liston RM, Baskett TF. Investigation of an increase in postpartum haemor-rhage in Canada.BJOG2007; 114(6): 751–9. doi:10.1111/ j.1471-0528.2007.01316.x
3. Kuklina EV, Meikle SF, Jamieson DJ, Whiteman MK, Barfield WD, Hillis SD et al. Severe obstetric morbidity in the United States: 1998-2005.Obstet Gynecol2009; 113: 293–9. doi:10.1097/AOG.0b013e3181954e5b
4. Ford JB, Roberts CL, Simpson JM, Vaughan J, Cameron CA. Increased postpartum hemorrhage rates in Australia.Int J Gynaecol Obstet2007; 98(3): 237–43. doi:10.1016/ j.ijgo.2007.03.011
5. Knight M, Callaghan WM, Berg C, Alexander S, Bouvier-Colle MH, Ford JB et al. Trends in postpartum hemorrhage in high resource countries: a review and recommendations from the International Postpartum Hemorrhage Collaborative Group. BMC Pregnancy Childbirth2009; 9: 55. doi:10.1186/1471-2393-9-55
6. Stafford I, Dildy GA, Clark SL, Belfort MA. Visually estimated and calculated blood loss in vaginal and cesarean
Reporting postpartum haemorrhage with transfusion
delivery.Am J Obstet Gynecol2008; 199(5): 519. doi:10.1016/ j.ajog.2008.04.049
7. Quan H, Parsons GA, Ghali WA. Validity of procedure codes in International Classification of Diseases, 9th revision, clinical modification administrative data.Med Care2004; 42(8): 801–9. doi:10.1097/01.mlr.0000132391.59713.0d
8. Singleton S. Data sources and performance measurement.BMJ 2007; 335(7623): 730. doi:10.1136/bmj.39356.610544.BE
9. Lain SJ, Hadfield RM, Raynes-Greenow CH, Ford JB, Mealing NM, Algert CS et al. Quality of data in perinatal population health databases: a systematic review.Med Care 2012; 50(4): e7–20. doi:10.1097/MLR.0b013e31821d2b1d
10. Lydon-Rochelle MT, Holt VL, Nelson JC, Ca´rdenas V, Gardella C, Easterling TR et al. Accuracy of reporting maternal in-hospital diagnoses and intrapartum procedures in Washington State linked birth records.Paediatr Perinat Epidemiol2005; 19(6): 460–71. doi:10.1111/j.1365-3016.2005.00682.x
11. Schoendorf KC, Branum AM. The use of United States vital statistics in perinatal and obstetric research.Am J Obstet Gynecol 2006; 194(4): 911–5. doi:10.1016/j.ajog.2005.11.020
12. Yasmeen S, Romano PS, Schembri ME, Keyzer JM,
Gilbert WM. Accuracy of obstetric diagnoses and procedures in hospital discharge data.Am J Obstet Gynecol2006; 194(4): 992–1001. doi:10.1016/j.ajog.2005.08.058
13. Lain SJ, Roberts CL, Hadfield RM, Bell JC, Morris JM. How accurate is the reporting of obstetric haemorrhage in hospital discharge data? A validation study.Aust N Z J Obstet Gynaecol 2008; 48(5): 481–4. doi:10.1111/j.1479-828X.2008.00910.x
14. Bentley JP, Ford JB, Taylor LK, Irvine KA, Roberts CL. Investigating linkage rates among probabilistically linked birth and hospitalization records.BMC Med Res Methodol2012; 12: 149. doi:10.1186/1471-2288-12-149
15. Taylor LK, Travis S, Pym M, Olive E, Henderson-Smart DJ. How useful are hospital morbidity data for monitoring condi-tions occurring in the perinatal period?Aust N Z J Obstet
Gynaecol2005; 45(1): 36–41. doi:10.1111/j.1479-828X.2005.00339.x
16. National Centre for Classification in Health. Tabular list of diseases ICD 10 AM. Sydney: National Centre for Classification in Health; 2006.
17. National Centre for Classification in Health. Australian classi-fication of Health Interventions. Sydney: National Centre for Classification in Health; 2006.
18. New South Wales Perinatal Data Collection Manual. 2011 Edition. Available at: http://www0.health.nsw.gov.au/ resources/publichealth/mph/pdc_manual_2011.asp (Cited 23 January 2014).
19. Patterson JA, Roberts CL, Bowen JR, Irving DO, Isbister JP, Morris JM et al. Blood transfusion during pregnancy, birth and the postnatal period.Obstet Gynecol2014; 123(1): 126–33. doi:10.1097/AOG.0000000000000054
20. Landis JR, Koch GG. The measurement of observer agreement for categorical data.Biometrics1977; 33(1): 159–74.
doi:10.2307/2529310
21. Sagot P, Mourtialon P, Benzenine E, Bardou M, Ferdynus C, Morel P et al. Accuracy of blood transfusion in postpartum hemorrhage to assess maternal morbidity.Eur J Obstet Gynecol Reprod Biol2012; 162(2): 160–4. doi:10.1016/j.
ejogrb.2012.02.021
22. Roberts CL, Ford JB, Thompson JF, Morris JM. Population rates of haemorrhage and transfusions among obstetric patients in NSW: a short communication.Aust N Z J Obstet Gynaecol2009; 49(3): 296–8. doi:10.1111/j.1479-828X.2009.00985.x
23. Callaghan WM, Kuklina EV, Berg CJ. Trends in postpartum hemorrhage: United States, 1994-2006.Am J Obstet Gynecol 2010; 202(4): 353. doi:10.1016/j.ajog.2010.01.011
Timeliness of
Salmonella
Typhimurium
notifications after the introduction
of routine MLVA typing in NSW
Cherie Heilbronn
A,B,D, Sally Munnoch
A,
Michelle T. Butler
C, Tony D. Merritt
Cand David N. Durrheim
CA
OzFoodNet, Hunter New England Population Health B
Turning Point, Eastern Health, Victoria C
Hunter New England Population Health D
Corresponding author. Email: [email protected]
Abstract: Salmonella Typhimurium is the most
common bacterial cause of gastrointestinal disease in NSW. Regular review of surveillance proce-dures ensures system objectives are met and informs improvements in system utility and effi-ciency. This paper assesses the timeliness and data
completeness of NSW SalmonellaTyphimurium
surveillance after the routine introduction of mul-tilocus variable repeat analysis (MLVA), a rapid sub-typing technique. MLVA results were avail-able significantly earlier than alternate sub-typing techniques over the 2 years of this review. Accord-ingly, from a timeliness perspective, MLVA offers
a favourableSalmonellaTyphimurium sub-typing
option in NSW. Further opportunities to improve timeliness and data completeness are identified. This paper was produced as part of a review of
SalmonellaTyphimurium surveillance in NSW for the period 2008–2009 by members of OzFoodNet based at Hunter New England Population Health. OzFoodNet is a national network established by the then Commonwealth Department of Health and Ageing in 2000 to enhance foodborne disease surveillance in Australia.
Salmonella Typhimurium (STm) is the most common
Salmonella serotype in New South Wales (NSW); in
2009 STm accounted for 54% of all NSW Salmonella
notifications1 and 77% of Australian foodborne
out-breaks with an identified causative agent.2 STm is a
heterogeneous Salmonella serovar, requiring additional
sub-typing to identify outbreak-specific strains. Research exploring sub-typing techniques proffers multilocus vari-able repeat analysis (MLVA) as a rapid alternative to
phage typing,3,4the sub-typing technique historically used
in Australia. MLVA typing has been shown to successfully differentiate strains within phage types 135a and 170 that
comprise more than half the STm isolates in NSW.5 In
2006 and 2007, routine STm MLVA sub-typing was implemented in Queensland and NSW, respectively.
Regular review of public health surveillance determines the success of system objectives and informs refinement of
system utility and efficiency.6,7 The NSW Salmonella
surveillance system involves a complex network of local and interstate laboratories and notification processes.
Local primary laboratories identify Salmonella species
(spp.), while serovar confirmation and MLVA typing occur at the closest reference laboratory, and phage typing at one of the two national phage typing labora-tories (Institute of Medical and Veterinary Science (IMVS), Adelaide and Medical Diagnostic Unit (MDU),
Melbourne). The NSW Public Health Act 1991 (and its
subsequent revision in 2010) mandates laboratories to
notify all confirmedSalmonellacases. In 2008 and 2009
notifications were entered into the NSW Notifiable Dis-eases Database (NDD) by Public Health Units (PHUs) for data collation, timely outbreak detection and disease
control, key objectives of the NSW surveillance system.8
This paper assesses the timeliness and completeness of NSWSalmonellaTyphimurium surveillance data after the routine introduction of MLVA. Serovar and MLVA noti-fications received in 2008 and 2009 were reviewed to identify opportunities for minimising delays.
Methods
The Centers for Disease Control and Prevention’s Updated Guidelines for Evaluating Public Health Surveillance
Systems6were used as an evaluation framework for this
investigation.
Data sources
STm notifications of NSW residents with a specimen collection date from 1 January 2008 to 31 December 2009 were identified and extracted in August 2010. As a
new data management system (Notifiable Conditions Information Management System (NCIMS)) was institu-ted in May 2010, notifications were entered into the NDD during 2008 and 2009, but data were extracted from NCIMS in 2010. Additional milestone dates were obtained from the Institute for Clinical Pathology and Medical Research (ICPMR) electronic notifications and Queens-land Health Forensic and Scientific Services (QHFSS), the NSW and Queensland reference laboratories, respectively. Other state reference laboratories were excluded as MLVA typing was not routinely conducted during the period of interest. NDD data comprised primary laboratory name
and the date ofSalmonellaspp. receipt at the relevant PHU.
ICPMR data included the following dates: specimen
col-lection,Salmonella spp. identification, isolate receipt at
ICPMR, and the electronic notification of serovar, MLVA and phage typing. The QHFSS dataset provided specimen collection date and the electronic notification dates of serovar and MLVA typing.
Data management and analysis
The relevant ICPMR and QHFSS dates were added to the NDD data extraction using SAS software (version 9.2, SAS Institute, Cary, NC, USA).
Eight milestones of public health importance were used in
the analysis (Figure 1). Completeness and accuracy of
milestones affected the number of cases available for timeliness evaluation; accordingly, a review of data com-pleteness was conducted. Data cleaning verified the accu-racy of extracted data and guided exclusion of duplicate cases and repeat specimens (specimens less than 14 days
apart).8 Additional quality assurance checks involved
scrutiny and possible exclusion of unexpected dates, established by negative time between sequential surveil-lance milestones. Time intervals greater than 365 days were reviewed to determine validity and excluded where appropriate. A total of 2458 cases (94.3% of all STm
notifications) were included in the analysis (Figure 2).
SAS software and Microsoft Excel 2010 were used for quality assurance checks, calculation of time intervals between milestones, and significance testing, using Wilcoxon rank sum test methodology.
Milestone 2
Salmonella spp. identified at primary laboratory
Milestone 1
Specimen collected from NSW resident
Milestone 4
Receipt of specimen at reference laboratory
Milestone 5
Salmonella serovar identified at reference laboratory
Milestone 6
Receipt of serovar result at NSW Health
Milestone 7
Receipt of MLVA result at NSW Health
Milestone 8
Receipt of phage type result at NSW Health
Milestone 3
Receipt of Salmonella spp. result at PHU
Figure 1. Milestones in the NSW Salmonella Typhimurium
surveillance system
MLVA: multilocus variable repeat analysis; PHU: Public Health Unit.
NDD/NCIMS dataset
2606 cases
No reference laboratory identified
63 cases
Study dataset
2543
Excluded in quality assurance check
85 cases
Final study dataset
2458 cases
Figure 2. Timeliness review of the NSWSalmonella Typhimur-ium surveillance system, 2008]2009: dataset derivation and case exclusion
Results
Timeliness
The timeliness of all STm milestones, determined by the median interval in days, with the exception of receipt of phage typing, remained relatively consistent over time (Table 1). MLVA notification occurred 23 days earlier
than phage typing in 2008 (p,0.001) and 44 days earlier
in 2009 (p,0.001). The median time interval for MLVA
notifications decreased significantly from 23 days in 2008
to 21 days in 2009 (2 days’ decrease,p,0.001).
Data completeness
Missing or invalid data were infrequent for most
mile-stones, with a few notable exceptions (Table 2). The
receipt of the initialSalmonellaspp. report at PHU level
was missing in 16.5% of cases and invalid in 1.3% of cases. Serovar identification date was missing in 5.4% of cases.
Sub-typing was not recorded for a small number of STm cases, including 17 serovar, 33 MLVA and 88 phage type results.
Anomalies in sequential notification
Given the consecutive nature of STm typing, milestone notification for MLVA and phage typing are expected to occur after serovar availability. Time interval analysis indicated this was not always the case. Serovar and MLVA typing results were received simultaneously in 1% of cases in 2008 and 6% of cases in 2009.
Discussion
Regular evaluation of public health surveillance is
impor-tant to confirm system utility and efficiency.6 To our
knowledge, this is the first report of MLVA timeliness in
Table 1. Elapsed days from specimen collection toSalmonellaTyphimurium surveillance milestones, NSW residents, 2008]2009
Milestone 2008 2009
Available records (n)
Median days (range)
Available records (n)
Median days (range)
Salmonellaspp. identified at primary laboratory
1047 3 (1–31) 1364 3 (1–13)
Salmonellaspp. result received by PHU 812 7 (3–156) 1168 6a(3–69)
Specimen received by reference laboratory 1036 6 (3–13) 1358 6 (3–39)
Salmonellaserovar identification 1039 8 (4–32) 1274 7a(4–41)
Salmonellaserovar result receivedb 1060c 10 (4–377) 1380c 9 (5–54)
MLVA result receivedb 1047 23 (8–384) 1377 21a(7–376)
Phage type result receivedb 1007 46 (21–786) 1362 65a(20–307)
MLVA: multilocus variable repeat analysis; PHU: Public Health Unit. a
Difference in 2008 and 2009 median (days),p,0.001. b
Reference laboratory results are emailed to NSW Health; subsequent dissemination to the relevant PHU. c
Includes Queensland Health Forensic and Scientific Services (QHFSS) specimens where earlier milestone dates unavailable (QHFSS results notified on serovar identification).
Source: Notifiable Conditions Information Management System (SAPHaRI), NSW Ministry of Health.
Table 2. Missing and invalidSalmonellaTyphimurium surveillance milestones, NSW residents, 2008]2009
Milestone Missing dates Invalid entriesa
n (%) n (%)
Specimen collection date 0 0.0 0 0.0
Salmonellaspp. identified at primary laboratory 41 1.7 6 0.2
Salmonellaspp. result received by PHU 405 16.5 32 1.3
Specimen received by reference laboratory 0 0 17 0.7
Salmonellaserovar identification 133 5.4 12 0.5
Salmonellaserovar result receivedb 17 0.7 1 0.0
MLVA result receivedb 33 1.3 1 0.0
Phage type result receivedb 88 3.6 1 0.0
MLVA: multilocus variable repeat analysis; PHU: Public Health Unit. a
Data determined to be impossible values and excluded from analysis. b
Reference laboratory results are emailed to NSW Health, with subsequent dissemination to the relevant PHU. Source: Notifiable Conditions Information Management System (SAPHaRI), NSW Ministry of Health.
Timeliness ofSalmonellaTyphimurium notifications
the context of a population level STm surveillance system. MLVA results were available significantly earlier than phage typing results over the 2 years of this review. The availability of NSW MLVA results in 2008 (median 23 days) and 2009 (median 21 days) was also fast in compari-son to phage typing in a similar timeliness study conducted
in Ireland (median 25 days).9 Notably, median time to
MLVA availability was shorter in 2009 than in 2008. This reduction during the third year of routine MLVA typing may be driven by increased efficiency as key players become accustomed to the MLVA process.
MLVA and phage typing notification was absent for a small number of cases. It is unclear whether typing was available but not reported or if typing was not conducted. One possible explanation is informed cessation of sub-typing when cases are epidemiologically linked to a known outbreak. How-ever, as NDD data entry capabilities did not include case or outbreak linking during the study period, we cannot assess the impact of outbreak resolution on missing results.
Occasionally, laboratories did not notify sub-typing results at the earliest opportunity, as indicated by simultaneous or non-sequential notification of serovar, MLVA or phage typing results. While electronic notification via email is undoubtedly faster than postal mail, human errors in data collation and transmission between organisations are chal-lenging to eliminate. Missing dates and notification sequence anomalies indicated notification lapses by pri-mary laboratories. These data quality issues impact the day-to-day operational processes of outbreak identifica-tion, investigation and control. However, due to the complex nature of NDD data entry and extraction from NCIMS, further exploration of this issue was not possible.
Resourcing impacts the time interval from specimen col-lection to result availability. Phage typing is particularly affected as two reference laboratories (IMVS and MDU) service all Australian states. Phage type result timeliness may also be impacted by isolate ‘batching’, where isolate dispatch to the reference laboratory is delayed until a sufficient number of isolates are collated. Batching may have become more commonplace in NSW after the intro-duction of routine MLVA and an accompanying reintro-duction in urgency for phage typing results. A previous study
identified Salmonella spp. identification as the ‘bottle
neck’ in the surveillance system,7yet we found that the
majority ofSalmonellaspp. identification occurred within
3 days. Also, the time interval from specimen collection to
Salmonellaspp. PHU notification was similar to a previous
international timeliness study.9Nonetheless, the additional
median 4- (2008) or 3- (2009) day time interval from
Salmonellaspp. identification to PHU receipt provides an opportunity to reduce notification delays.
In 2010, the NDD was replaced with NCIMS, an updated data capture system with enhanced foodborne disease
surveillance capacities. NCIMS capabilities include date stamping (identifying the date and time of data entry), outbreak case linking, and recording MLVA and phage typing results. NCIMS performance enhancements are expected to improve outbreak identification, establish historical sub-typing data banks, and advance future sur-veillance system evaluations through superior data quality. Indeed, capacity for real-time electronic importation of notifications directly into NCIMS (electronic laboratory reporting (ELR)) has been partially realised. In 2013, ELR was implemented by four laboratories conducting a
sub-stantial proportion ofSalmonellaspp. identification. The
elimination of transmission delay and human error inher-ent in multiple data inher-entry points may have already reduced
time fromSalmonellaspp. identification to PHU receipt.
However, an efficient data extraction method, to facilitate future timeliness and data quality evaluations, has not yet been developed.
Further opportunities to improve timeliness and data completeness include:
1. Dissemination of ELR across all laboratories, thereby reducing duplication of data entry and expediting data delivery.
2. Development of NCIMS capability for efficient data extraction and reporting relevant to future data com-pleteness and timeliness evaluations. This would enable evaluation of NCIMS capacity to enhance the NSW STm surveillance system.
Limitations
Interpretation of our findings requires consideration of data limitations, including the use of secondary data collated for operational purposes. NDD data entry and NCIMS data extraction capabilities, surveillance system reliance on manual data entry at multiple laboratories and PHUs, and manual result dispatch from laboratories to health services, impacted data quality. To minimise this bias, staff scrutinised each record to assess data for exclu-sion as necessary.
Conclusion
Given the importance of rapid typing in outbreak res-ponses and the endemic presence of STm in NSW, timely receipt of STm sub-typing is of public health importance. From a timeliness perspective, MLVA offers a favourable STm sub-typing option in NSW. Further, this project identified additional opportunities to enhance the STm surveillance system and improve enteric outbreak detec-tion and control.
Acknowledgments
Health and Ageing to enhance foodborne disease surveillance in Australia. We wish to acknowledge the contribution of Tracey Findlay for her role in data collation and cleaning. We would also like to thank our public health reference laboratory colleagues at ICPMR and QHFSS for their enthusiasm for MLVA typing and the provision of additional milestone data, as well as our colleagues at MDU and IMVS for phage typing.
References
1. Kardamandis K, Heilbronn C, Munnoch S, McWeeny C, Stephens N. NSW 2009 OzFoodNet Annual Report. Available at: http://www.health.nsw.gov.au/Infectious/diseases/Documents/ ofn_annual_report_2009.pdf (Cited 14 April 2014).
2. OzFoodNet Working Group. Monitoring the incidence and causes of diseases potentially transmitted by food in Australia: Annual report of the OzFoodNet Network, 2009.Commun Dis Intell2010; 34: 396–426.
3. Lindstedt BA, Vardund T, Aas L, Kapperud G. Multiple-locus variable-number tandem-repeats analysis ofSalmonellaenterica subsp. enterica serovar Typhimurium using PCR multiplexing and multicolor capillary electrophoresis.J Microbiol Methods 2004; 59: 163–72. doi:10.1016/j.mimet.2004.06.014
4. Wang Q, Chiew R, Howard P, Gilbert G.Salmonellatyping in New South Wales: current methods and application of improved
epidemiological tools.N S W Public Health Bull2008; 19: 24–8. doi:10.1071/NB07036
5. Sintchenko V, Wang Q, Howard P, Ha CW, Kardamanidis K, Musto J et al. Improving resolution of public health surveillance for humanSalmonellaenterica serovar Typhimurium infection: 3 years of prospective multiple-locus variable-number tandem-repeat analysis (MLVA).BMC Infect Dis2012; 12: 78. doi:10.1186/1471-2334-12-78
6. CDC; the Guidelines Working Group. Updated Guidelines for Evaluating Public Health Surveillance Systems.MMWR2001; 50: 1–35.
7. Takahashi T, Koehler J, Swenson P, Duchin J. Evaluation of a public healthSalmonellasurveillance system in King County, Washington.Am J Infect Control2004; 32: 7–11. doi:10.1016/ j.ajic.2003.06.003
8. Communicable Diseases Surveillance and Control Unit. NSW Notifiable Diseases Database Manual. 6th ed. Sydney: NSW Department of Health; 2002.
9. Nicolay N, Garvey P, Delappe N, Cormican M, McKeown P. Completeness and timeliness ofSalmonellanotifications in Ireland in 2008: a cross sectional study.BMC Public Health 2010; 10: 568. doi:10.1186/1471-2458-10-568
Timeliness ofSalmonellaTyphimurium notifications
Public and private dental services in NSW:
a geographic information system analysis
of access to care for 7 million Australians
Jenny Willie-Stephens
A, Estie Kruger
A,Band Marc Tennant
AA
International Research Collaborative – Oral Health And Equity, Department of Anatomy, Physiology and Human Biology, The University of Western Australia
B
Corresponding author. Email: [email protected]
Abstract: Aim:To investigate the distribution of public and private dental practices in NSW in relation to population distribution and
socioeco-nomic status. Methods:Dental practices (public
and private) were mapped and overlayed with Census data on Collection District population and Socio-Economic Indexes for Areas (SEIFA). Results:Overall, there was an uneven geographic distribution of public and private dental practices across NSW. When the geographic distribution was compared to population socioeconomics it was found that in rural NSW, 12% of the most disadvantaged residents lived further than 50 km from a public dental practice, compared to 0% of the least disadvantaged. In Sydney, 9% of the three most disadvantaged groups lived greater than 7.5 km from a public dental practice, compared to 21% of the three least disadvantaged groups. Conclusion:The findings of this study can con-tribute to informing decisions to determine future areas for focus of dental resource development (infrastructure and workforce) and identifying subgroups in the population (who are geographi-cally isolated from accessing care) where public health initiatives focused on amelioration of dis-ease consequences should be a focus.
Access to health care, and the relationship between vari-ables associated with service need and the attributes of the service delivery system, are important because they affect
peoples’ ability to utilise health services when needed.1,2
One key aspect of accessibility is the physical location of
health services relative to the population they serve.3The
spatial dimension of access is a critical issue in health care. Recent studies have used spatial analysis to measure potential accessibility to primary and secondary health services in order to identify geographic inequalities in
health care delivery.4,5Australians are one of the healthiest
populations in the world, however there is evidence of inequalities and inequities in accessing oral health
services.6,7
Universal healthcare coverage in Australia excludes dental care; most dental services (80–90%) are delivered by the private sector on a fee-per-item basis. The public sector exists with varying eligibility criteria, and is mostly directed at children, low-income individuals, pensioners
and defined disadvantaged groups.7Despite the reduction
in dental decay in children and tooth loss in adults, oral diseases and disorders remain prevalent and are a substan-tial burden to the Australian population. Poor oral health is evident in Indigenous communities, and amongst low income earners, rural and remote area dwellers, and the
elderly;8 evidence exists that access to dental care in
Australia has a strong socioeconomic dimension, as well
as a strong rural–urban dimension.7
Against this backdrop, the aim of this study was to investigate the distribution of public and private dental practices in New South Wales (NSW) to test the hypothesis that the distribution of dental practices reflects the geo-graphic, demographic and socioeconomic features of the population and therefore the known gradient of oral disease.
Methods
This study used a cross-sectional study design. All the data were collected from open access web-based sources; no ethics approval was therefore necessary. Microsoft Excel 2003 was used for database storage.
Public dental practice locations
practices and Aboriginal Medical Services. The NSW Government operates an integrated child and adult service predominately through shared site facilities (and continues to extend this position). The small number of practices which remain embedded in schools were not included in the sample.
Private dental practice locations
The address for each private dental practice in NSW was obtained from various sources (e.g. phone books, profes-sional lists, Google maps, web searches) and cross-checked against the Yellow Pages as at June 2011.
Population statistics
Population data were obtained from the Australian Census
of Population and Housing of 2006.9The population data
were divided by Census Collection District (CD), defined by geographic boundaries. The geographic boundaries were also obtained from the Australian Bureau of Statistics (ABS) website.
Socioeconomic status
The Socio-Economic Indexes for Areas (SEIFA) at CD level formed the basis of the measure of socioeconomic disadvantage by geographic areas. SEIFA is a suite of four summary measures that have been created from Census
information.10SEIFA values are ranked into deciles. The
most disadvantaged 10% of areas in Australia are given a decile number of one; the second most disadvantaged 10% of areas are given a decile number of two, and so on up to the least disadvantaged 10% of areas which are given a
decile of 10.11
Outcome measures
The main outcome measures for this study were the distribution of public and private dental practices in NSW, the distance from CD of residence to these services, and the differences in access to these services for groups of different socioeconomic status. Data were analysed for the Sydney metropolitan area and the rest of NSW (henceforth rural) separately. The primary post office (GPO) of NSW (based in Sydney) was used as a central datum point and metropolitan areas were nominally defined as the area within 50 km of the GPO. This 50 km area was chosen as it encompasses most of the densely populated regions of Sydney, but at the same time remains a relatively simple shape for clarity. It also encompasses the various defini-tions of metropolitan areas that are in use (e.g. the
Com-monwealth Government’s definitions of city vs rural).12
Using geographic information system technology, CDs with a centroid outside of 2.5 km, 5 km, and 7.5 km from a public dental practice in the city were identified and further analysed by socioeconomic status. The same was done for private practices in the city, except that CDs with a
centroid of 1.0 km and 2.5 km were identified and further analysed by socioeconomic status. Different distances were used for public and private practices as the number of public practices is much lower than the number of private practices and thus they have to cover populations distributed across far larger geographical areas than the private practices. CDs with a centroid greater than 12.5 km, 25 km and 50 km from a public dental practice for rural NSW were also identified and further analysed by socio-economic status. All distance classifications were cumula-tive and not mutually exclusive. Straight-line distances were used as a proxy measure of access. As discussed by
Phibbs and Luft,13the correlation between travel time and
straight-line distance is high in most cases, lowering for shorter distances and in dense urban areas with high traffic congestion and reliance on surface roads.
No distance or socioeconomic analyses were conducted for the private dental practices in rural NSW as the density of practices was low (out of a total of 3289 private practices, only 683 were distributed across rural NSW). As private practice locations are determined by the market and economic drivers, practices outside of capital metropolitan areas have previously been found to be located in higher
population density, large regional centres.14 In addition,
public dental practices play a strategic role for the wider geographic regions of NSW.
Geocoding
All dental practices were geocoded using Google maps. The geographic boundary data for each CD were obtained from the ABS. These were integrated with the population and socioeconomic data, and the geocoded practices using ArcGIS (version 9, ESRI, Redlands, California, USA). The geographic measures analysis was also completed using ArcGIS.
Results
The total number of public dental practices that were geocoded in NSW was 170 and the total number of private practices was 3289, of which 2606 (80%) were in city areas. NSW had a total of 11 811 CDs, representing 10% of the Australian total land mass, and with a total population of 7.2 million (which represents one-third of Australia’s total population). There was an uneven distribution of public and private dental practices across NSW, with a
high concentration of both in the city (Figure 1). The
majority of public dental practices in the city were located in similar areas as the private dental practices.
Public dental practices
Public dental practices were widely scattered in rural areas (Figure 1). In population terms, in rural NSW, 2.1 million people lived within 50 km of a public dental practice; of
Public and private dental services in NSW
these, 1.4 million people lived within 12.5 km. In metro-politan Sydney the number of people who lived within 7.5 km of a public dental practice was 3.4 million; of these, 1.3 million people lived within 2.5 km.
Twelve percent of the population in the most disadvan-taged SEIFA decile lived greater than 50 km from a public
dental practice in rural NSW (Figure 2). SEIFAs 1–6 had
8–12% of the population living greater than 50 km from a ⫻
⫻
⫻
⫻
⫻ ⫻
⫻
⫻
⫻
⫻ ⫻
⫻ ⫻
⫻ ⫻
⫻
⫻ ⫻
public dental practice. However, the percentage of the population was low for SEIFA deciles 7–9, and no-one in SEIFA 10 lived more than 50 km from a public practice.
In the city the reverse was true; 9% of the three most disadvantaged groups lived greater than 7.5 km from a public dental practice while the three least disadvantaged SEIFA deciles had a higher percentage (21%) who lived greater than 7.5 km from a public dental practice. SEIFAs 1–4 had a lower percentage of the population living greater than 7.5 km from a public practice than
SEIFAs 5–10 (Figure 3).
0 2 4 6 8 10 12 14
1 2 3 4 5 6 7 8 9 10 SEIFA (decile)
Percent
Figure 2. Proportion of people in rural NSW who live greater than 50 km from a public dental practice, by SEIFA decile, 2011
SEIFA: Socio-Economic Indexes for Areas
Decile 1 is the most disadvantaged 10% of the population; decile 10 is the most advantaged 10% of the population.
0 5 10 15 20 25
1 2 3 4 5 6 7 8 9 10 SEIFA (decile)
Percent
Figure 3. Proportion of people in Sydney, NSW, who live greater than 7.5 km from a public dental practice, by SEIFA decile, 2011
SEIFA: Socio-Economic Indexes for Areas
Decile 1 is the most disadvantaged 10% of the population; decile 10 is the most advantaged 10% of the population.
0 1 2 3 4 5 6 7 8
1 2 3 4 5 6 7 8 9 10 SEIFA (decile)
Percent
Figure 5. Proportion of people in Sydney, NSW, who live
greater than 1 km from a private dental practice, by SEIFA decile, 2011
SEIFA: Socio-Economic Indexes for Areas
Decile 1 is the most disadvantaged 10% of the population; decile 10 is the most advantaged 10% of the population.
0 5 10 15 20 25 30
1 2 3 4 5 6 7 8 9 10
SEIFA (decile)
Percent
Figure 4. Proportion of people in Sydney, NSW, who live
greater than 2.5 km from a private dental practice, by SEIFA decile, 2011
SEIFA: Socio-Economic Indexes for Areas
Decile 1 is the most disadvantaged 10% of the population; decile 10 is the most advantaged 10% of the population.
Figure 6. An iso-density map of the number of private
dental practices in Sydney, NSW, and surrounding areas (approximately 50 km), 2011
Areas highlighted in darker shades have the highest densities.
Public and private dental services in NSW
Private practices
There were far fewer private practices in rural NSW; the vast
majority were concentrated in the city (Figure 1). In Sydney,
people in SEIFAs 1 and 5–8 were more likely to live greater
than 2.5 km from a private dental practice (Figure 4). Further
analysis of the distribution by SEIFA found that SEIFAs 1 and 6–8 had the highest proportion of people living greater than 1.0 km from a private dental practice in the city (Figure 5). The density of private dental practices increased
closer to the centre of the city (Figure 1).
Further distributional analyses
Sydney has a high population density and the majority of residents living in the city belonged to the least disadvan-taged groups (SEIFA 8, 9, 10), while the minority were from the most disadvantaged groups (SEIFA 1, 2, 3).
Figure 6 shows the density of private practices across Sydney. There was also a very high density of public
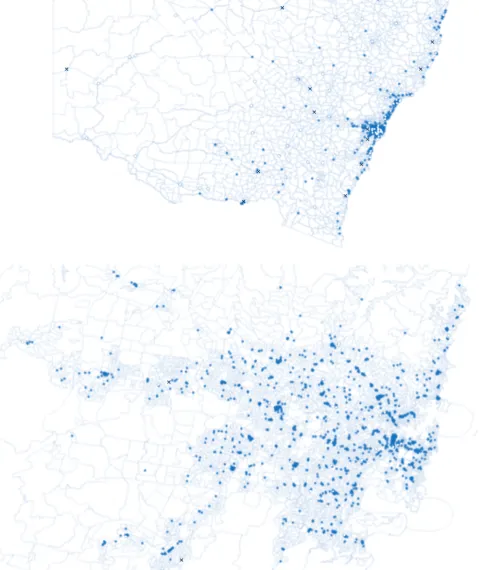
dentists in the city.Figure 7shows the relative density of
public dental practices across NSW. Coverage of metro-politan Sydney by the ‘‘catchment zones’’ is dense and even.
Figure 7. Public dental practices overlaying SEIFA deciles, NSW, 2011
Buffers for rural NSW (top) were 12.5, 25 and 50 km and were 2.5, 5 and 7.5 km for metropolitan Sydney (bottom).
Discussion
Despite the reduction in dental decay in children and tooth loss in adults, oral diseases and disorders remain prevalent
and a substantial burden in the Australian population.8
Accessing health care is not equal across the population15
and this is reflected in accessing oral health care in
Austra
![Table 1.Concordance of postpartum haemorrhage (PPH) with transfusion cases identified from hospital data and birth data,NSW, 2007]2010](https://thumb-us.123doks.com/thumbv2/123dok_us/56824.2007289/7.595.58.295.271.534/table-concordance-postpartum-haemorrhage-transfusion-cases-identified-hospital.webp)
![Table 3.Characteristics of women with postpartum haemorrhage (PPH) with transfusion identified in either the birth data alone,hospital data alone, or both, NSW, 2007]2010](https://thumb-us.123doks.com/thumbv2/123dok_us/56824.2007289/8.595.50.540.109.726/table-characteristics-women-postpartum-haemorrhage-transfusion-identified-hospital.webp)
![Figure 2.Timeliness review of the NSW Salmonella Typhimur-ium surveillance system, 2008]2009: dataset derivation andcase exclusion](https://thumb-us.123doks.com/thumbv2/123dok_us/56824.2007289/12.595.67.267.78.477/figure-timeliness-salmonella-typhimur-surveillance-dataset-derivation-exclusion.webp)
![Table 1.Elapsed days from specimen collection to Salmonella Typhimurium surveillance milestones, NSW residents, 2008]2009](https://thumb-us.123doks.com/thumbv2/123dok_us/56824.2007289/13.595.61.556.361.512/elapsed-specimen-collection-salmonella-typhimurium-surveillance-milestones-residents.webp)


![Table 1.Selected infectious diseases by place of acquisition, NSW, 2010]2011](https://thumb-us.123doks.com/thumbv2/123dok_us/56824.2007289/24.595.42.548.101.189/table-selected-infectious-diseases-place-acquisition-nsw.webp)
![Table 2.Selected infectious diseases acquired outside Australia by likely region of acquisition, NSW, 2010]2011](https://thumb-us.123doks.com/thumbv2/123dok_us/56824.2007289/25.595.64.553.311.491/table-selected-infectious-diseases-acquired-outside-australia-acquisition.webp)
