Ames Laboratory Accepted Manuscripts
Ames Laboratory
8-27-2018
Dependence of the absolute value of the
penetration depth in (Ba1–x Kx) Fe2 As2 on
doping
Avior Almoalem
Technion–Israel Institute of Technology
Alon Yagil
Technion–Israel Institute of Technology
Kyuil Cho
Iowa State University and Ames Laboratory, [email protected]
Serafim Teknowijoyo
Iowa State University and Ames Laboratory
Makariy A. Tanatar
Iowa State University and Ames Laboratory, [email protected]
See next page for additional authors
Follow this and additional works at:
https://lib.dr.iastate.edu/ameslab_manuscripts
Part of the
Condensed Matter Physics Commons
, and the
Materials Science and Engineering
Commons
This Article is brought to you for free and open access by the Ames Laboratory at Iowa State University Digital Repository. It has been accepted for inclusion in Ames Laboratory Accepted Manuscripts by an authorized administrator of Iowa State University Digital Repository. For more information, please [email protected].
Recommended Citation
Almoalem, Avior; Yagil, Alon; Cho, Kyuil; Teknowijoyo, Serafim; Tanatar, Makariy A.; Prozorov, Ruslan; Liu, Yong; Lograsso, Thomas A.; and Auslaender, Ophir M., "Dependence of the absolute value of the penetration depth in (Ba1–x Kx) Fe2 As2 on doping" (2018). Ames Laboratory Accepted Manuscripts. 437.
Dependence of the absolute value of the penetration depth in (Ba1–x Kx)
Fe2 As2 on doping
Abstract
We report magnetic force microscopy (MFM) measurements on the iron-based superconductor
Ba1−xKxFe2As2. By measuring locally the Meissner repulsion with the magnetic MFM tip, we determine the
absolute value of the in-plane magnetic penetration depth (λab) in underdoped, optimally doped, and
overdoped samples. The results suggest an abrupt increase of λab as doping is increased from xopt, which is
potentially related to the presence of a quantum critical point. The response of superconducting vortices to
magnetic forces exerted by the MFM tip for x=0.19 and 0.58 is compatible with previously observed
structural symmetries at those doping levels.
Disciplines
Condensed Matter Physics | Materials Science and Engineering
Authors
Avior Almoalem, Alon Yagil, Kyuil Cho, Serafim Teknowijoyo, Makariy A. Tanatar, Ruslan Prozorov, Yong
Liu, Thomas A. Lograsso, and Ophir M. Auslaender
PHYSICAL REVIEW B
98
, 054516 (2018)
Dependence of the absolute value of the penetration depth in (Ba
1−xK
x)Fe
2As
2on doping
Avior Almoalem,1Alon Yagil,1Kyuil Cho,2,3Serafim Teknowijoyo,2,3Makariy A. Tanatar,2,3Ruslan Prozorov,2,3Yong Liu,2
Thomas A. Lograsso,2,4and Ophir M. Auslaender1,*
1Department of Physics, Technion–Israel Institute of Technology, Haifa 32000, Israel 2Ames Laboratory, Ames, Iowa 50011, USA
3Department of Physics and Astronomy, Iowa State University, Ames, Iowa 50011, USA
4Department of Materials Science and Engineering, Iowa State University, Ames, Iowa 50011, USA
(Received 18 February 2018; revised manuscript received 3 May 2018; published 27 August 2018)
We report magnetic force microscopy (MFM) measurements on the iron-based superconductor Ba1−xKxFe2As2. By measuring locally the Meissner repulsion with the magnetic MFM tip, we determine the absolute value of the in-plane magnetic penetration depth (λab) in underdoped, optimally doped, and overdoped samples. The results suggest an abrupt increase ofλabas doping is increased fromxopt, which is potentially related to the presence of a quantum critical point. The response of superconducting vortices to magnetic forces exerted by the MFM tip forx=0.19 and 0.58 is compatible with previously observed structural symmetries at those doping levels.
DOI:10.1103/PhysRevB.98.054516
I. INTRODUCTION
Many aspects of superconductivity in the iron-based superconductors (FeSCs) are still not well understood. These materials exhibit novel phenomena such as the coexistence of magnetism and superconductivity [1–5], as well as more exotic behavior [4,6,7]. One family with a particularly intriguing phase diagram is BaFe2As2, of which Ba1−xKxFe2As2 is a
member. Here we report spatially resolved local measurements of the superconducting phase itself, and its relation with structural phases through vortex position and motion.
The phase diagram of Ba1−xKxFe2As2 shares many
features with the phase diagrams of other pnictides (e.g., Ba(Fe1−xCox)2As2[8,9], BaFe2(As1−xPx)2[10–14]). The
par-ent compound, BaFe2As2, is a multiband metal that undergoes
magnetic and structural phase transitions atTN ≈TS≈135 K
[2,3]. Upon doping, TN,S are suppressed until they vanish
nearx≈0.28 [3]. The system becomes superconducting at T < TC(x) for x0.15 [2,3]. TC(x) itself rises to a
max-imum at xopt ≈0.34 [3,5] and upon further doping drops
to a value that remains finite all the way to x=1. At low doping, superconductivity coexists with antiferromagnetism and orthorhombicity [2,5,15,16].
Ba1−xKxFe2As2is special among the pnictides in that other
phases have been reported in a narrow sliver of doping nearx ≈ 0.28, separating the coexistence at low doping and the super-conducting phase at higher doping [2,3,17–19]. Just aboveTC
this sliver contains a tetragonal out-of-plane antiferromagnetic phase [3,16,19] which coexists with superconductivity below TC. The superconducting phase in Ba1−xKxFe2As2has its own
unique attributes and affords unique opportunities that are not possible in other FeSCs where different phenomena occur in overlapping doping regimes. For example, in Ba1−xKxFe2As2
the coexistence regime is well below xopt. Moreover, the
superconducting gap itself is nodeless below the highly doped regime, for which multigap superconductivity [17,20], and the formation of gap anisotropy and nodes have been reported [18,20–23].
The effect of doping in Ba1−xKxFe2As2 is qualitatively
different from other members of the BaFe2As2 family [16].
Unlike the dopant Co, K is nonmagnetic [24], and unlike
the nonmagnetic P, isovalent with As [4,6], K adds holes. In addition, it is thought that Ba1−xKxFe2As2 is less disordered
than other pnictides because the Ba sites hosting the K dopants are off the Fe-As planes [16,17,25,26]. All of this has moti-vated much research on superconductivity in Ba1−xKxFe2As2
[16–18,27–29], as well as on the structural [3,30] and elec-tronic [17,31] properties.
Here we report measurements of the absolute value of the penetration depth for currents flowing in the crystal a-b plane (λab) at lowT in high quality Ba1−xKxFe2As2 single
crystals ranging from underdoped to overdoped. Frequently the measurement of λab [32] is restricted to variations with
temperature (T) [18,33,34]. This provides information on the excitation spectrum rather than on the superfluid density itself (ρs ≡1/λ2ab). Using MFM, we can measure the absolute
value of λab and thus determine the superfluid density ρs
directly [1,4,7,32,35]. The variation ofρs(T =0) with doping
is influenced by competition between superconductivity and other phases, as well as by changes in the band structure that can affect properties such as the effective mass [6]. We also report pinning force measurements acquired by the manipulation of superconducting vortices [7,36–38]. Potentially this allows us to explore the impact of the structural and nematic phases at low doping on vortex motion [2,3,15].
Our measurements are local with the imaging resolution limit set by superconductivity itself to be on the order of
λab. This allows us to go beyond sample-wide
measure-ments [16,18,32,35] and provide spatially resolved
informa-tion. For example, by obtaining λab and TC at the same
location we can elucidate the relationship between these two
AVIOR ALMOALEMet al. PHYSICAL REVIEW B98, 054516 (2018)
fundamental quantities regardless of their variation across the sample [4].
II. EXPERIMENT
A. Samples
Our samples are single crystals grown by the
self-flux method [18,31] with Fe-As flux for samples with
x0.55 and K-As flux for higher levels of doping.
The samples all have a surface area on the scale of
≈0.25 mm2and a thickness of dozens of microns. The doping
levels arex =0.58±0.02,0.52±0.01,0.36±0.01,0.34± 0.01,0.32±0.01,0.24±0.01,0.19±0.01, spanning the su-perconducting dome. We determined these values by energy dispersive x-ray spectroscopy (EDS), which collects data from an area of ≈1×1 μm2 at the actual scanned surface. The
values listed above give the mean and the standard deviation from measurements at 10 different points across each sample. In addition tox, EDS gives the atomic composition, which was as expected [As (37.6%–42.5%), Fe (38.1%–41.0%)].
B. Measurement
Prior to a measurement run we cleaved a sample to be scanned unless it already had a smooth a-b surface that showed no obvious signs of contamination. Thus we cleaved all samples except thex=0.34 sample. For the measurement
we used frequency modulated MFM [39] to determine the
interaction between a sharp magnetic tip and a superconducting sample by tracking the frequency shift (f) of the resonant frequency of the cantilever holding the magnetic tip:
f ≈Coffset−
f0 2k
∂Fz
∂z . (1)
Here zis the distance between the bottom of the MFM tip
and the surface,Coffsetis an arbitrary constant offset,f0is the
cantilever resonance frequency in free space, andkis its spring constant [40].Fz, a function ofλabandz, is thezcomponent
of the force between the tip and the sample. Equation (1) is an approximation for small oscillation amplitudes and f f0. Fz also depends on the electric potential of the
tip relative to the sample. When we tune it away from the contact potential difference between the two, the MFM is sensitive to topography. When we tune it to cancel the contact potential difference, the only contribution is from magnetic forces [1,4,7,36–38] for the range of z we use for analysis here.
Most of the results we report are from the Meissner repulsion of the tip from the sample, which we use to determine λab. For this we acquire a touchdown curve: A measurement of f(z) at a single point on the surface (e.g., Fig.1). Before such a measurement we field-cool the sample to control the density of superconducting vortices (nv), which gives the magnetic
field we reportB =0nv, where0=hc/2eis the quantum
of superconducting flux. To make sure that the only contri-bution to a touchdown is from the Meissner repulsion of the magnetic tip we use MFM imaging to locate a point which is at least 4μm from the nearest vortex, and is away from the sample edge or any other obvious defects.
Δ
f
[Hz]
z [µm]
2
h
H
0 2 4 6 8
-1 0 1 2 3
4.5 K 29 K
30 K 31 K
[image:4.590.305.545.62.237.2]32.5 K
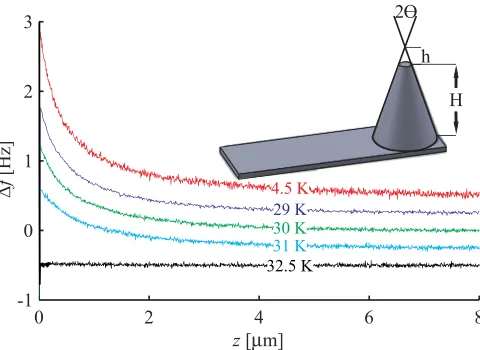
FIG. 1. Touchdown curves as a function of T for a x=0.32 sample showing how the increase ofλabaffects the repulsion of the tip from the surface. This sample was not used for extractingλabbecause it did not cleave well. All the curves here were acquired with the same tip at the same location and are offset by 0.25 Hz for clarity. At T=32.5 Kλabis too large for us to detect any Meissner response. Based on this and additional touchdown curves,TC=32.2±0.2 K. Inset: Schematic of an MFM tip. The truncated cone tip parameters are shown. 2is the cone angle,His the effective magnetic coating height, andhis the truncation height.
Touchdown curves allow us to estimateTC: We defineTC
as the temperature where λab is too large to give detectable
Meissner repulsion. We show an example in Fig. 1. The
disappearance of the Meissner repulsion results from the diver-gence ofλabnearTC[41]. Based on our signal-to-noise ratio,
our model and real tip parameters, we estimate that we can
measure a Meissner response for λab10 μm. Thus, our
procedure gives lower bound onTC.
We extractλabfrom a touchdown curve by a fit that relies
on a model of our tip. This model (the truncated cone model [1,4,42]) contains several parameters (cf. inset to Fig.1). We determined some of them (the cone angle 2and the truncation heighth) by scanning electron microscopy (SEM). Additional tip parameters (the cone effective magnetic heightH and an overall prefactorA) are more difficult to determine as they are affected by the magnetic domain structure of the tip, which we have not measured directly. We determine these last parameters together with λab and Coffset in a fit process, as described
previously [4]. Once we have a value forλab we obtain the
T =0 K value (λ0Kab) by extrapolation using published data on the temperature dependence [18], which changes λab by
50 nm forx =0.19 and10 nm for 0.24x0.58. The values we report in Fig.2forλ0K
ab are an average over several
points in each sample. At each point we average over multiple touchdown curves.
In addition to measuring the Meissner response, we also im-aged and manipulated superconducting vortices. Vortex motion and the mapping of vortex positions can give information on structure and the defect landscape [36–38,43,44]. For this we utilize the interaction between the magnetic MFM tip and the currents circulating the core of a vortex [4,7,36,38,43]. After field-cooling (1G|B|3G), we imaged the magnetic
DEPENDENCE OF THE ABSOLUTE VALUE OF THE … PHYSICAL REVIEW B98, 054516 (2018) [K] TC 0.2 0.3 0.4 0.5 0.6 0.2 0.3 0.4 0.5 0.6 14 18 22 26 30 34
x
0Kλ [μm] ab 0K λab TCFIG. 2. The dependence of λ0K
ab (circles) and TC (squares) on dopingx.λ0K
ab is extrapolated fromT =4.5 K using data from Cho et al.[18]. Stars are published values [16,19] measured at 7 K and extrapolated toT =0 K. The abrupt jump inλ0K
ab is clearly visible in our data atx=0.36, as is the decrease upon approachingxoptfrom the underdoped edge of the superconducting dome. Forx=0.19 we show two values forλ0K
ab andTC, as explained in the text. The error bars forλ0K
ab represent 70% confidence intervals. The error bars for TCrepresent temperature increments. Lines are guides to the eye.
scape with the tip far enough to leave the vortices unperturbed (surveillance scanning). For manipulation we brought the tip close enough to the surface to drag or to push vortices out of their pinning sites [7,36,38,44].
III. RESULTS
A. Local diamagnetic response
Figure2shows our main results: The dependence ofλ0Kab andTC on doping. In all of the samples except at the lowest
doping (x=0.19)λabandTCwere uniform with the scatter for
λabbelow 30 nm. This uniformity is reflected in the touchdown curves themselves. For example, Fig.3shows two touchdown curves taken≈200μm apart on ax =0.34 sample. Clearly the curves are very similar, attesting to the uniformity ofλab
in this sample.
We account for the scatter ofλab andTC atx =0.19 by
showing two separate results for data acquired at different points during the same cool-down (cf. Fig.2). This is likely a consequence of the strong dependence ofλ0Kab andTCon doping
at low x and indicates doping variations across the sample. This matches both our EDS results, where we see variations ofx on the scale of±0.01, and the known tendency of K to be distributed inhomogeneously in Ba1−xKxFe2As2 [45,46].
Similar scatter in very underdoped samples has been observed in underdoped BaFe2(As1−xPx)2 [4]. The scatter shows one
of the advantages of our local probe: Instead of extracting an average value for a whole sample, we can extract different values from different parts of the sample.
The dependence ofTC on x shows the dome typical for
FeSCs [2,3,18,31,35,46]. As expected, TC increases sharply
whenx is increased from the underdoped side towardsxopt,
1 2 3 4 5 6 7 8 9
df [H z] 0 2 4 6 8 Area I Area II
z [ m]μ
10-1 100 101
df [H z] 0 2 4 6 8
z [ m]μ
0
z = λab z = λab
FIG. 3. Touchdown curves taken at points≈200μm apart on a x=0.34 sample during the same cool-down atT =4.6 K. Clearly the curves are very similar. Fitting givesλab=200±30 nm. Vertical line representsz=λab. For fitting we use thez2λab part of the data. Inset: The same touchdowns presented withzon a logarithmic scale showing the similarity forz2λab.
and decreases slowly when x is increased further towards
the overdoped side. TheTC values we obtain are lower than
previously reported in sample-wide measurements on similar materials [3,18,31] and the variation aroundxoptis sharper, as expected from our technique, which gives a lower bound. We have observed similar behavior ofTC(x) in BaFe2(As1−xPx)2
[4], which is reminiscent of the saturation of diamagnetic signal rather than its onset in sample-wide measurements [6].
The overall dependence ofλ0K
ab onx is reminiscent of the
dependence in Ba(Fe1−xCox)2As2[1,35], in which there is a
sharp drop from the underdoped edge of the superconducting
dome followed by a shallow minimum around xopt and a
leveling off for x > xopt. The sharp drop in λab on the
underdoped side has also been reported in BaFe2(As1−xPx)2
[4]. This kind of behavior can be attributed to the competition of superconductivity with a spin-density-wave phase in the coexistence region of phase diagram [1,4,35].
The most surprising behavior we observe in Fig.2 is an abrupt jump of λ0K
ab when x is slightly increased fromxopt.
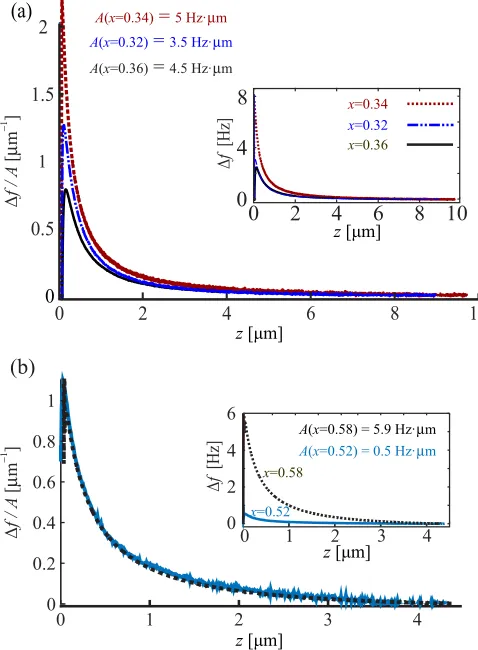
This observation is based on measurements in three samples withx =0.32, 0.34, and 0.36. To help rule out an artifact of using different tips we show full touchdown curves in Fig.4(a). To compare curves that were acquired with different tips we normalized the raw data by the prefactorA, the fit parameter which is proportional to the magnetization of the tip. We show in Fig. 4(b) that the difference between the curves is due primarily to the variation ofλabrather than the tip parameters
by comparing normalized plots acquired with different tips but with the fit procedure yielding similar values ofλab.
B. Imaging and manipulation of vortices
Overall our conclusion from imaging vortex positions is that the disorder level in all samples is low; vortices did not cluster, an indication for the absence of strong pinning sites which overwhelm vortex-vortex interactions when vortices
freeze in place during a cool-down [42]. We also probed
samples by dragging vortices. For example, anisotropic vortex motion can be an indication of the presence of twin
[image:5.590.44.287.60.243.2]AVIOR ALMOALEMet al. PHYSICAL REVIEW B98, 054516 (2018)
A(x=0.58) = 5.9 Hz·µm
x=0.58
x=0.52
A(x=0.52) = 0.5 Hz·µm
0 2 4 6
0 1 2 3 4
0 1 2 3 4
−1
Δ
f /
A
[
µ
m]
0 0.2 0.4 0.6 0.8 1
(b)
z [μm]
Δ
f
[Hz]
z [μm]
−1
Δ
f /
A
[
µ
m]
z [μm]
z [μm]
Δ
f
[Hz]
A(x=0.34) = 5 Hz·µm
A(x=0.32) = 3.5 Hz·µm
A(x=0.36) = 4.5 Hz·µm
x=0.32
x=0.34
x=0.36
2
6
8
2 4 8
0
4
10
0
4
8
1
0.5 1.5
(a)
0 6 10
0 2
FIG. 4. (a) Normalized touchdown curves measured at T = 4.5 K forx=0.34,0.32,0.36.x=0.32,0.36 were measured in the same cool-down with the same tip.x=0.34 was measured with a different tip in a different cool-down. Fitting to the curves givesλab≈ 200±30,260±30,340±50 nm for x=0.34,0.32,0.36. Inset: The same curves before normalization. (b) Normalized touchdown curves for different samples (x=0.58,0.52) acquired with different tips. Both giveλab≈300±35 nm atT =4.5 K. Thex=0.52 curve is offset by 20 nm to emphasize the similarity to thex=0.58 curve. Inset: The same curves before normalization.
aries [4,7,47], nematic order, or other broken symmetries. To achieve controlled vortex motion we cooled samples in a field aligned with the magnetization of the tip. This gives tip-vortex attraction and vortices that appear as dark spots (Figs. 5 and 6). We were able to move vortices in three of the samples (x =0.19, 0.52, 0.58) and studied them in detail in two of the samples where vortex motion was substantial and qualitatively different (x=0.19,0.58). The pinning forces measured for the manipulated samples were much smaller than reported for BaFe2(As1−xPx)2[7] and Ba(Fe1−xCox)2As2
[42]. This is an indication of weak vortex pinning [4,7,36,48]. Figure5 shows both surveillance scans for the x=0.58 sample [(a) and (c)] as well as manipulation scans [(b) and (d)]. Tip-induced motion for different vortices started at 670 z340 nm, which suggests that the range of pinning force in this sample was 1.7Fpin 2.6 pN. For such an estimate we
perform a sequence of surveillance scans, each one closer to the sample. We estimateFpinfor a particular vortex from the
maximum of the lateral force [49] (Fmax
[image:6.590.301.546.62.330.2]lateral) that we apply in
FIG. 5. Imaging and manipulating vortices atx=0.58 forT = 4.3 K withB≈1.8 G. The scans show vortex motion which depends on the scan direction, indicated by arrows (the fast direction, in which we move the tip back-and-forth, is shown by two parallel arrows; the slow direction, in which we increment the tip after one back-and-forth period, is shown by a single long arrow). (a)z=670 nm. (b) z=340 nm. (c)z=960 nm. (d)z=260 nm.
the first scan for which we see it move. The motion of vortices did not show an obvious preferred orientation; they tracked the slow axis of raster pattern in perpendicular scan orientations, as in Figs.5(b)and5(d). The lack of a clear preferred axis is consistent with the tetragonal symmetry (C4) known to exist in overdoped Ba1−xKxFe2As2 [3,31]. The way vortices crept
along the slow axis is reminiscent of the behavior in slightly overdoped YBa2Cu3O7−δ(clean samples with low anisotropy)
[36]. Indeed, as in YBa2Cu3O7−δ, all of the vortices jumped
back towards their original pinning site once the tip was far enough away [cf. Figs.5(a)and5(c)].
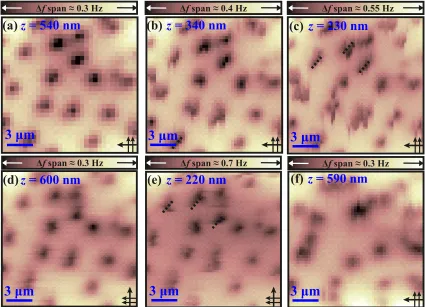
Vortex motion was different in the x =0.19 sample.
Figure6(a)shows unperturbed vortices atz=540 nm. Next is a scan forz=340 nm [Fig. 6(b)] with significant vortex motion. Our estimate ofFmax
lateral[49] suggests that the pinning
force in this sample was 1.6Fpin 2.0 pN. Reducing z further increased the tip-vortex force and allowed us to move vortices even more. This is shown in Figs.6(c)and6(e). Close inspection of these scans suggests a preferred direction for vortex motion (shown by dashed lines), that is independent of the scan orientation. This is consistent with broken C4
symmetry and the existence of orthorhombic domains and the twin boundaries that separate them. Twin boundaries have been observed previously at this doping [3,37]; their presence is an indication that this sample is in the coexistence regime. A scan performed from a higher scan height between these two scans
[image:6.590.40.279.63.388.2]DEPENDENCE OF THE ABSOLUTE VALUE OF THE … PHYSICAL REVIEW B98, 054516 (2018)
FIG. 6. Imaging and manipulating vortices atx=0.19 forT =4.34 K withB≈1.5 G. The scan directions are indicated by arrows as explained in Fig.5. The scans are ordered chronologically. Dashed lines in (c),(e) are guides to the eye and highlight vortex motion. (a) Low resolution scan before manipulating vortices (z=540 nm). (b),(c) Manipulation scans with the slow scan direction pointing left [z=340 nm in (b),z=230 nm in (c)]. (d),(e) Scans with the slow scan direction pointing up [z=600 nm in (d),z=220 nm in (e)]. (f) Scan withz=590 nm after several scans with very lowzand significant vortex motion (not shown).
[Fig.6(d)] shows that in this sample vortices returned to their original positions after mild perturbation.
We subjected the vortices in thex=0.19 sample to even
stronger dragging forces by scanning atz=100 nm, where
the tip exerts a force as large asFlateralmax ≈3 pN [49]. After this strong manipulation we scanned with a largerz(to reduce Fmax
lateral) to determine the ultimate positions of the vortices. As
Fig.6(f)shows,Fmax
lateral≈3 pN was sufficient to pull vortices
far from their original pinning sites. The position changes of vortices under strong perturbation, and the scale of the forces applied, lead us to conclude that if there are sites of strong pinning, they are rare. This further attests to the high quality of the samples.
IV. DISCUSSION
Our values forλab are in agreement with estimates from infrared reflectivity [16,19] (stars in Fig. 2) only for x xopt. Forx > xopt our values are higher, perhaps because in
Ba1−xKxFe2As2 this is a strongly coupled regime [17,50],
where reflectivity provides a lower bound onλab[51,52].
Our most surprising result is the abrupt increase ofλ0K ab
whenxis tuned up fromxopt. The only FeSC where anything
remotely similar has been observed is BaFe2(As1−xPx)2, where
λ0Kab has a peak atxopt[4,6] that coincides with the upper
bound-ary of the coexistence regime. It is possible that the increase
that we see atx =0.36 is part of a peak that therefore also exists in Ba1−xKxFe2As2, but until additional samples are measured,
especially for 0.35x 0.5, it is impossible to be certain. If the sharp increase ofλ0Kab is indeed part of a peak, then this peak exists well beyond the reported coexistence rangex 0.28 [3], and thus may hint at the presence of another phase. But, unless magnetic phases are detected near optimal doping, a micro-emulsion mechanism of the type that was invoked to explain the peak in λ0K
ab in BaFe2(As1−xPx)2 [53] probably
does not play a role. A new phase could be the reason masses renormalize and, through that, the reason forλ0K
ab to increase
[54]. In fact, measurements of the Hall coefficient suggest an increase of the ratio between the hole and electron effective masses [46]. This has been interpreted as a consequence of the creation of a coherent electronic state in which holes interact via bosons. This boson-hole interaction [46] may also influence the coupling of the cooper pairs, as measurements of the specific heat [17] imply. Interestingly, scanning tunneling spectroscopy (STS) experiments have reported bosonic modes that have a relationship with the superconducting order param-eter [50], and are an indication of strong coupling.
A tantalizing explanation for the observed increase inλ0Kab, that may also explain the boson-hole interaction and the mass renormalization reported previously [46], is the existence
of quantum critical point (QCP). The peaked λ0K
ab at xopt
AVIOR ALMOALEMet al. PHYSICAL REVIEW B98, 054516 (2018)
in BaFe2(As1−xPx)2 has been associated with such a QCP
[6,55–58], although this view is not uncontested [53,59]. If our observed increase ofλ0Kab is indeed a result of a QCP, this implies that the nodal gap structure of BaFe2(As1−xPx)2 is
not a consequence of the quantum critical behavior, as the gap in Ba1−xKxFe2As2 is nodeless near xopt [18,58]. That
Ba(Fe1−xCox)2As2, the gap of which is also nodeless near
xopt, does not show this behavior is most likely because it is in the dirty limit [60]. On the other hand, it is believed that magnetic order is crucial for the peaked behavior of λ0K
ab in BaFe2(As1−xPx)2, but this order is absent nearxopt in
Ba1−xKxFe2As2.
ACKNOWLEDGMENTS
We would like to thank A. Chubukov, B. Kalisky, A. Kanigel, I. Kapon, and M. Khodas for discussions, A. Brenner for help with EDS, as well as the Micro Nano Fabrication Unit at Technion. This work was supported by the Israel Science Foundation (Grant No. 1897/14). Work at Ames was supported by the US Department of Energy (DOE), Office of Science, Basic Energy Sciences, Materials Science and Engineering Division. Ames Laboratory is operated for the US DOE by Iowa State University under Contract No. DE-AC02-07CH11358.
[1] L. Luan, T. M. Lippman, C. W. Hicks, J. A. Bert, O. M. Auslaender, J.-H. Chu, J. G. Analytis, I. R. Fisher, and K. A. Moler,Phys. Rev. Lett.106,067001(2011).
[2] S. Avci, O. Chmaissem, E. A. Goremychkin, S. Rosenkranz, J.-P. Castellan, D. Y. Chung, I. S. Todorov, J. A. Schlueter, H. Claus, M. G. Kanatzidis, A. Daoud-Aladine, D. Khalyavin, and R. Osborn,Phys. Rev. B83,172503(2011).
[3] A. E. Böhmer, F. Hardy, L. Wang, T. Wolf, P. Schweiss, and C. Meingast,Nat. Commun.6,7911(2015).
[4] Y. Lamhot, A. Yagil, N. Shapira, S. Kasahara, T. Watashige, T. Shibauchi, Y. Matsuda, and O. M. Auslaender,Phys. Rev. B91,
060504(2015).
[5] J. P. Reid, M. A. Tanatar, X. G. Luo, H. Shakeripour, S. R. de Cotret, A. Juneau-Fecteau, J. Chang, B. Shen, H. H. Wen, H. Kimet al.,Phys. Rev. B93,214519(2016).
[6] K. Hashimoto, K. Cho, T. Shibauchi, S. Kasahara, Y. Mizukami, R. Katsumata, Y. Tsuruhara, T. Terashima, H. Ikeda, M. A. Tanatar, H. Kitano, N. Salovich, R. W. Giannetta, P. Walmsley, A. Carrington, R. Prozorov, and Y. Matsuda,Science336,1554
(2012).
[7] A. Yagil, Y. Lamhot, A. Almoalem, S. Kasahara, T. Watashige, T. Shibauchi, Y. Matsuda, and O. M. Auslaender,Phys. Rev. B
94,064510(2016).
[8] D. K. Pratt, W. Tian, A. Kreyssig, J. L. Zarestky, S. Nandi, N. Ni, S. L. Bud’ko, P. C. Canfield, A. I. Goldman, and R. J. McQueeney,Phys. Rev. Lett.103,087001(2009).
[9] S. Nandi, M. G. Kim, A. Kreyssig, R. M. Fernandes, D. K. Pratt, A. Thaler, N. Ni, S. L. Bud’ko, P. C. Canfield, J. Schmalian, R. J. McQueeney, and A. I. Goldman,Phys. Rev. Lett.104,057006
(2010).
[10] S. Kasahara, H. J. Shi, K. Hashimoto, S. Tonegawa, Y. Mizukami, T. Shibauchi, K. Sugimoto, T. Fukuda, T. Terashima, A. H. Nevidomskyy, and Y. Matsuda,Nature (London)486,382
(2012).
[11] A. E. Böhmer, P. Burger, F. Hardy, T. Wolf, P. Schweiss, R. Fromknecht, H. v. Löhneysen, C. Meingast, H. K. Mak, R. Lortz, S. Kasahara, T. Terashima, T. Shibauchi, and Y. Matsuda,Phys. Rev. B86,094521(2012).
[12] T. Iye, Y. Nakai, S. Kitagawa, K. Ishida, S. Kasahara, T. Shibauchi, Y. Matsuda, and T. Terashima, Phys. Rev. B 85,
184505(2012).
[13] T. Iye, Y. Nakai, S. Kitagawa, K. Ishida, S. Kasahara, T. Shibauchi, Y. Matsuda, and T. Terashima, J. Phys. Soc. Jpn.
81,033701(2012).
[14] D. Hu, X. Lu, W. Zhang, H. Luo, S. Li, P. Wang, G. Chen, F. Han, S. R. Banjara, A. Sapkota, A. Kreyssig, A. I. Goldman, Z. Yamani, C. Niedermayer, M. Skoulatos, R. Georgii, T. Keller, P. Wang, W. Yu, and P. Dai, Phys. Rev. Lett. 114, 157002
(2015).
[15] E. Wiesenmayer, H. Luetkens, G. Pascua, R. Khasanov, A. Amato, H. Potts, B. Banusch, H.-H. Klauss, and D. Johrendt,
Phys. Rev. Lett.107,237001(2011).
[16] B. P. P. Mallett, C. N. Wang, P. Marsik, E. Sheveleva, M. Yazdi-Rizi, J. L. Tallon, P. Adelmann, T. Wolf, and C. Bernhard,
Phys. Rev. B95,054512(2017).
[17] F. Hardy, A. E. Böhmer, L. de’ Medici, M. Capone, G. Giovannetti, R. Eder, L. Wang, M. He, T. Wolf, P. Schweiss et al.,Phys. Rev. B94,205113(2016).
[18] K. Cho, M. Konczykowski, S. Teknowijoyo, M. A. Tanatar, Y. Liu, T. A. Lograsso, W. E. Straszheim, V. Mishra, S. Maiti, P. J. Hirschfeld, and R. Prozorov,Sci. Adv.2,e1600807(2016). [19] B. P. P. Mallett, P. Marsik, M. Yazdi-Rizi, T. Wolf, A. E. Böhmer,
F. Hardy, C. Meingast, D. Munzar, and C. Bernhard,Phys. Rev. Lett.115,027003(2015).
[20] W. Malaeb, T. Shimojima, Y. Ishida, K. Okazaki, Y. Ota, K. Ohgushi, K. Kihou, T. Saito, C. H. Lee, S. Ishida, M. Nakajima, S. Uchida, H. Fukazawa, Y. Kohori, A. Iyo, H. Eisaki, C.-T. Chen, S. Watanabe, H. Ikeda, and S. Shin,Phys. Rev. B86,
165117(2012).
[21] T. Goko, A. A. Aczel, E. Baggio-Saitovitch, S. L. Bud’ko, P. C. Canfield, J. P. Carlo, G. F. Chen, P. Dai, A. C. Hamann, W. Z. Hu, H. Kageyama, G. M. Luke, J. L. Luo, B. Nachumi, N. Ni, D. Reznik, D. R. Sanchez-Candela, A. T. Savici, K. J. Sikes, N. L. Wang, C. R. Wiebe, T. J. Williams, T. Yamamoto, W. Yu, and Y. J. Uemura,Phys. Rev. B80,024508(2009).
[22] G. Mu, H. Luo, Z. Wang, L. Shan, C. Ren, and H. H. Wen,Phys. Rev. B79,174501(2009).
[23] N. Xu, P. Richard, X. Shi, A. van Roekeghem, T. Qian, E. Razzoli, E. Rienks, G. F. Chen, E. Ieki, K. Nakayamaet al.,
Phys. Rev. B88,220508(2013).
[24] A. S. Sefat, R. Jin, M. A. McGuire, B. C. Sales, D. J. Singh, and D. Mandrus,Phys. Rev. Lett.101,117004(2008).
[25] M. Rotter, M. Tegel, and D. Johrendt, Phys. Rev. Lett.101,
107006(2008).
[26] M. Rotter, C. Hieke, and D. Johrendt,Phys. Rev. B82,014513
(2010).
[27] R. Khasanov, D. V. Evtushinsky, A. Amato, H. H. Klauss, H. Luetkens, C. Niedermayer, B. Büchner, G. L. Sun, C. T. Lin,
DEPENDENCE OF THE ABSOLUTE VALUE OF THE … PHYSICAL REVIEW B98, 054516 (2018)
J. T. Park, D. S. Inosov, and V. Hinkov,Phys. Rev. Lett.102,
187005(2009).
[28] K. Ohishi, Y. Ishii, I. Watanabe, H. Fukazawa, T. Saito, Y. Kohori, K. Kihou, C. Lee, H. Kito, A. Iyo, and H. Eisaki, J. Phys. Soc. Jpn.81,SB046(2012).
[29] K. Cho, M. Ko´nczykowski, J. Murphy, H. Kim, M. A. Tanatar, W. E. Straszheim, B. Shen, H. H. Wen, and R. Prozorov,Phys. Rev. B90,104514(2014).
[30] S. N. Khan and D. D. Johnson,Phys. Rev. Lett.112,156401
(2014).
[31] Y. Liu, M. A. Tanatar, W. E. Straszheim, B. Jensen, K. W. Dennis, R. W. McCallum, V. G. Kogan, R. Prozorov, and T. A. Lograsso,
Phys. Rev. B89,134504(2014).
[32] R. Prozorov and R. W. Giannetta,Supercond. Sci. Technol.19,
R41(2006).
[33] C. Martin, R. T. Gordon, M. A. Tanatar, H. Kim, N. Ni, S. L. Bud’ko, P. C. Canfield, H. Luo, H. H. Wen, Z. Wang, A. B. Vorontsov, V. G. Kogan, and R. Prozorov, Phys. Rev. B80,
020501(2009).
[34] H. Kim, M. A. Tanatar, W. E. Straszheim, K. Cho, J. Murphy, N. Spyrison, J.-P. Reid, B. Shen, H.-H. Wen, R. M. Fernandes, and R. Prozorov, Phys. Rev. B 90, 014517
(2014).
[35] R. T. Gordon, H. Kim, N. Salovich, R. W. Giannetta, R. M. Fernandes, V. G. Kogan, T. Prozorov, S. L. Bud’ko, P. C. Canfield, M. A. Tanatar, and R. Prozorov, Phys. Rev. B82,
054507(2010).
[36] O. M. Auslaender, L. Luan, E. W. J. Straver, J. E. Hoffman, N. C. Koshnick, E. Zeldov, D. A. Bonn, R. Liang, W. N. Hardy, and K. A. Moler,Nat. Phys.5,35(2009).
[37] H. Yang, B. Shen, Z. Wang, L. Shan, C. Ren, and H. H. Wen,
Phys. Rev. B85,014524(2012).
[38] N. Shapira, Y. Lamhot, O. Shpielberg, Y. Kafri, B. J. Ramshaw, D. A. Bonn, R. Liang, W. N. Hardy, and O. M. Auslaender,Phys. Rev. B92,100501(2015).
[39] T. R. Albrecht, P. Grütter, D. Horne, and D. Rugar,J. Appl. Phys.
69,668(1991).
[40] We used five cantilevers: Numbers 1, 2, 4, and 5 were by Nano-World and number 3 was by Paramount Sensors. The spring constants were all k=2–3 N/m, and f0≈ 79.5,77.0,93.7,79.2,71.3 kHz for tips 1–5 respectively. [41] M. Tinkham,Introduction to Superconductivity(McGraw-Hill,
New York, 1996).
[42] L. Luan, O. M. Auslaender, T. M. Lippman, C. W. Hicks, B. Kalisky, J. Haw Chu, J. G. Analytis, I. R. Fisher, J. R. Kirtley, and K. A. Moler,Phys. Rev. B81,100501(2010).
[43] E. W. J. Straver, J. E. Hoffman, O. M. Auslaender, D. Rugar, and K. A. Moler,Appl. Phys. Lett.93,172514(2008). [44] J. T. Zhang, J. Kim, M. Huefner, C. Ye, S. Kim, P. C. Canfield,
R. Prozorov, O. M. Auslaender, and J. E. Hoffman,Phys. Rev. B92,134509(2015).
[45] J. T. Park, D. S. Inosov, C. Niedermayer, G. L. Sun, D. Haug, N. B. Christensen, R. Dinnebier, A. V. Boris, A. J. Drew, L. Schulz, T. Shapoval, U. Wolff, V. Neu, X. Yang, C. T. Lin, B. Keimer, and V. Hinkov,Phys. Rev. Lett.102,117006(2009). [46] K. Ohgushi and Y. Kiuchi,Phys. Rev. B85,064522(2012). [47] B. Kalisky, J. R. Kirtley, J. G. Analytis, J.-H. Chu, I. R. Fisher,
and K. A. Moler,Phys. Rev. B83,064511(2011).
[48] In the other samples, where we could not induce vortex motion, the forces we exerted while imaging were much higher and comparable to the forces reported in BaFe2(As1−xPx)2[7]. [49] In order to estimate Fmax
lateral we model the tip as an infinitely sharp truncated cone and integrate the known expression for the interaction energy of a magnet and a superconducting vortex [38].
[50] L. Shan, J. Gong, Y. L. Wang, B. Shen, X. Hou, C. Ren, C. Li, H. Yang, H. H. Wen, S. Li, and P. Dai,Phys. Rev. Lett.108,227002
(2012).
[51] J. Hirsch,Physica C199,305(1992).
[52] V. G. Kogan, C. Martin, and R. Prozorov, Phys. Rev. B80,
014507(2009).
[53] D. Chowdhury, J. Orenstein, S. Sachdev, and T. Senthil,Phys. Rev. B92,081113(2015).
[54] Y. Wang, A. Abanov, B. L. Altshuler, E. A. Yuzbashyan, and A. V. Chubukov,Phys. Rev. Lett.117,157001(2016). [55] A. Levchenko, M. G. Vavilov, M. Khodas, and A. V. Chubukov,
Phys. Rev. Lett.110,177003(2013).
[56] R. M. Fernandes, S. Maiti, P. Wölfle, and A. V. Chubukov,Phys. Rev. Lett.111,057001(2013).
[57] T. Nomoto and H. Ikeda,Phys. Rev. Lett.111,167001(2013). [58] T. Shibauchi, A. Carrington, and Y. Matsuda, Annu. Rev.
Condens. Matter Phys.5,113(2014).
[59] D. Chowdhury, B. Swingle, E. Berg, and S. Sachdev,Phys. Rev. Lett.111,157004(2013).
[60] R. T. Gordon, H. Kim, M. A. Tanatar, R. Prozorov, and V. G. Kogan,Phys. Rev. B81,180501(2010).