M. Namasivayam et al, International Journal of Computer Science and Mobile Applications, Vol.2 Issue. 1, January- 2014, pg. 109-114 ISSN: 2321-8363
©2014, IJCSMA All Rights Reserved, www.ijcsma.com 109
Diagnostic Group Socio Behaviors
Using Dim Extractions
Mr. M. Namasivayam
1, Ms. N. Radhika
21
Pursuing M.Tech CSE-PRIST University, Trichy, Tamilnadu, India
2
Head, Department of CSE, PRIST University, Trichy, Tamilnadu, India
Abstract
Diagnostic group behaviors is to analyze how the individual person behaves in a social media. The social media comprises n number of peoples can connect to others like family members, friends, colleagues online. The given information about some individuals can be identified by some other persons but we cannot identify some persons with in the same network. A key observation is that the users of the same affiliation tend to connect with each other. This approach leads to scalability problem, by using this Socio Dim approach can simplify this issue; however the socio dim network comprises huge collection of individuals and their behaviors. To scale and study the prediction about all the users this socio dim approach can be easily applied and extracted, As a result the behaviours of a group can be collected, based on the result we can predict the performance of a group and the similarities of one or more persons interests in a network.
Index Terms — Social Dimensions, Edge Partition.
I.INTRODUCTION
The amount of web information gathering has increased, now-a-days. How the information can be gathered is a challenging task for the users. Every day more number of users joining and using the Social media. The current web information gathering systems attempts to satisfy the user requirements by capturing their information needs. For this purpose the user profiles are created. The social media provides opportunities to study human interactions and collective behavior on an unprecedented scale. Here we study how networks in social media can help predict some human behaviors and individual preferences. The connections in social network are not homogenous. Different users maintain different connections with their family, and friends. The user may also interest to search various types of information’s from the web or a portal.
M. Namasivayam et al, International Journal of Computer Science and Mobile Applications, Vol.2 Issue. 1, January- 2014, pg. 109-114 ISSN: 2321-8363
©2014, IJCSMA All Rights Reserved, www.ijcsma.com 110
The user belongs to a specific group. In these group behaviours we provide a collective approach to generate the overall performances of a particular group. In a grouped environment the user behaviours are different. We are more likely to connect to others who share certain similarities with us. This has been observed not only in the many processes of a physical world, but also in online systems. To address the heterogeneity present in connections, a framework (SocioDim) has been proposed for collective behavior learning. The main observation is that the users of the same interest are tending to connect with each other. In social media new members are joining and new connections occurring between existing members each day. This dynamic nature of networks entails an efficient update of the model for collective behavior prediction. We attempt to find the behavior correlation presented in a social network in order to predict collective behavior in social media. Given a network with the behavioral information of some users, how can we find out that the behavioral outcome of the remaining users within the same network
II. RELATED WORK
2.1
Project overview
The framework of Socio Dim comprises the following processes. The first step is to extract the social dimensions based on the user and the usage of the web based informations. The second step is to learn the behaviours of various users from the extracted informations. Suppose S social dimensions are extracted from a network with m edges and n nodes. The density (proportion of nonzero entries) of the social dimensions based on edge partition is bounded by the following
Where α > 2 is the exponent of the power law distribution.
2.1.1
Scope of project
The main scope of the project is to find the user similarities
To extract the usage of the various groups
To find the overall usage of the user and groups.
M. Namasivayam et al, International Journal of Computer Science and Mobile Applications, Vol.2 Issue. 1, January- 2014, pg. 109-114 ISSN: 2321-8363
©2014, IJCSMA All Rights Reserved, www.ijcsma.com 111
2.2
Proposed system
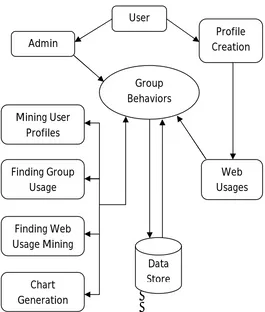
The proposed group behavior model aims to discover the user interactions to various groups and their relationships. Fig.1. illustrates the proposed group behavior model. The group consists of various types of web resources; they can be accessed by the users at any time. From Fig 1 we observed that the following edges are connected.
Fig. 1. User Network Model
Fig 2 Architecture of Group behavior Model
User
Data Store Admin
Profile Creation
Mining User Profiles
Web Usages Group
Behaviors
Finding Group Usage
Finding Web Usage Mining
Chart Generation
1
3 2
B A
C
M. Namasivayam et al, International Journal of Computer Science and Mobile Applications, Vol.2 Issue. 1, January- 2014, pg. 109-114 ISSN: 2321-8363
©2014, IJCSMA All Rights Reserved, www.ijcsma.com 112
Users have to create the profile and they can be accessed by the administrator. Usages of the web resources are monitored and the background information’s are collected. The extracted social dimensions following edge partition are guaranteed to be sparse. This is because the number of one user’s affiliations is no more than that of connections. Given a network with m edges and n nodes, if Ssocial dimensions are extracted, then each node vi has no more than min(di, S) nonzero entries in her social dimensions, where di is the degree of node vi.
The User mining and the overall mining details are collected and will be displayed to the admin. The user mining details includes the details of the user who are using our site and the total time that they spent on each and every page. By using this information we can predict which user is interested in which topic and time that they spent to collect the info. We can also diagnose the various users and their interests.
We can also find the overall time spent by various users in each and every page. By using these values we can predict which pages are frequently used by all the users, and we can also find the overall time spent by the users ie the total usage time of the whole website. These informations will be helpful to improve the performance.
Web Log details has the time information of the pages when the user uses them. We can get login time, log out time, and the in time and out time of each and every page the user visit. It also tracks the overall usage time of the each user logs in. It also maintained for each and every time when the user using this portal. This web log information is helpful for the admin to maintain the user and the web mining details.
Chart can be generated based on the user mining. In chart we can predict the overall usage of the each page that the user visits, and also the similarities of the users and their behaviors. We can also view that the frequent pages visited by the users.
Fig. 3. User interests in various groups.
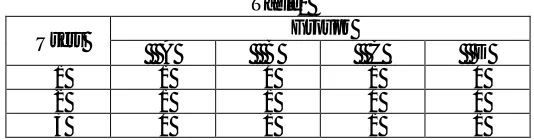
The following table is constructed based on the figure 1. The users and the groups are connected with the edges. The user 1 is connected with the groups A and C, user 2 is connected with the groups A and B, and the user 3 is with B, C and D. We observe that the users 1 and 2 have the same affiliation with group A, users 2 and 3 with the same affiliation with group B, and the users 1 and 3 with Group C. No other user is interested in group D except user 3.
Table1
Users Groups
A B C D
1 1 0 1 0
2 1 1 0 0
M. Namasivayam et al, International Journal of Computer Science and Mobile Applications, Vol.2 Issue. 1, January- 2014, pg. 109-114 ISSN: 2321-8363
©2014, IJCSMA All Rights Reserved, www.ijcsma.com 113
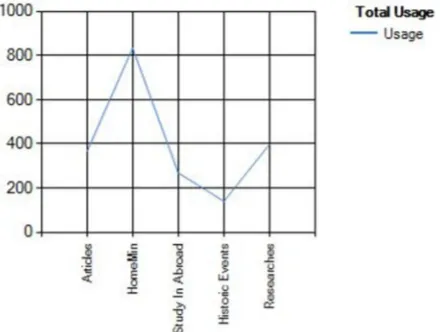
Since the user is interacted with various groups, the interaction usage is also mined in our approach, the usage of various groups is mined by a single user is represented in Fig3. How long each user is using the groups is also captured and based on the result the graph is generated Fig 4 shows the behaviors of the various user and groups. Fig 5 shows that the overall usage of the groups used by various users. If the users and groups may increase at any time so that the affiliations will also increased.
Fig. 4. Behaviors of various users in different groups
Fig. 5. Overall usage of different groups
III. CONCLUSION
M. Namasivayam et al, International Journal of Computer Science and Mobile Applications, Vol.2 Issue. 1, January- 2014, pg. 109-114 ISSN: 2321-8363
©2014, IJCSMA All Rights Reserved, www.ijcsma.com 114
affiliations with groups may change time to time, As a result the similarities of various users are observed with the help of this model.
ACKNOWLEDGEMENT
I feel very happy to thank below mentioned authors (Reference Paper’s) who initiated and motivated us to develop our knowledge. And also we feel very happy to dedicate our work credit to those authors for getting interest to these topics.
REFERENCES
[1] L. Tang and H. Liu, “Toward predicting collective behavior via social dimension extraction,” IEEE Intelligent Systems, vol. 25,pp. 19–25, 2010.
[2] Relational learning via latent social dimensions,” in KDD ’09: Proceedings of the 15th ACM SIGKDD international conference on Knowledge discovery and data mining. New York, NY, USA: ACM, 2009, pp. 817–826
[3] L. Tang and H. Liu, “Scalable learning of collective behavior based on sparse social dimensions,” in CIKM ’09: Proceeding of the 18th ACM conference on Information and knowledge management. New York, NY, USA: ACM, 2009, pp. 1107–1116.
[4] P. Singla and M. Richardson, “Yes, there is a correlation: - from Social networks to personal behavior on the web,” in WWW ’08: Proceeding of the 17th international conference on World WideWeb. New York, NY, USA: ACM, 2008, pp. 655–664.
[5] M. Newman, “Power laws, Pareto distributions and Zipf’s law,” Contemporary physics, vol. 46, no. 5, pp. 323–352, 2005.
[6] S. A. Macskassy and F. Provost, “Classification in networked data: A toolkit and a univariate case study,” J. Mach. Learn.Res., vol. 8, pp. 935–983, 2007.
[7] H. W. Lauw, J. C. Shafer, R. Agrawal, and A. Ntoulas, “Homophily in the digital world: A LiveJournal case study,” IEEE Internet Computing, vol. 14, pp. 15–23, 2010.