http://www.sciencepublishinggroup.com/j/ajwse doi: 10.11648/j.ajwse.20190501.12
ISSN: 2575-1867 (Print); ISSN: 2575-1875 (Online)
Evaluation of Soil Contamination in Mining Areas of
Rwanda
Hubert Hirwa
1, *, François Xavier Nshimiyimana
1, 2, Emmanuel Ngendahayo
2, Beatha Akimpaye
1,
Lamek Nahayo
1, Olivier Militery Ngamata
1, Jean de Dieu Bazimenyera
11
Department of Environmental Economics and Natural Resources Management, Faculty of Environmental Studies, University of Lay Adventists of Kigali (UNILAK), Kigali, Rwanda
2
Water and Sanitation Corporation (WASAC) Limited, Kigali, Rwanda
Email address:
*
Corresponding author
To cite this article:
Hubert Hirwa, François Xavier Nshimiyimana, Emmanuel Ngendahayo, Beatha Akimpaye, Lamek Nahayo, Olivier Militery Ngamata, Jean de Dieu Bazimenyera. Evaluation of Soil Contamination in Mining Areas of Rwanda. American Journal of Water Science and Engineering. Vol. 5, No. 1, 2019, pp. 9-15. doi: 10.11648/j.ajwse.20190501.12
Received: December 28, 2018; Accepted: January 24, 2019; Published: February 19, 2019
Abstract:
Soil serves as a great geochemical reservoir for contaminants as well as a natural buffer for transportation of chemical materials and elements in the atmosphere, hydrosphere and biosphere. This study aimed at evaluating the physical and chemical parameters of soil and understanding the features of the pollution in Gifurwe mining area, Burera District of Rwanda. The soil samples were randomly collected in seven locations of the study area. The soil samples were analyzed for selected physico-chemical parameters: pH values, Arsenic (As), Chromium (Cr) and Lead (Pb) concentrations using standard analytical techniques. The contamination factors and pollution load indices were calculated. The pH values of soil ranged between 4.2 and 8.2. The results showed that the As concentrations increase up to 531 mgkg-1 downstream of the tailings dam (farm fields) which is extremely high above the maximum concentration levels allowed by Canadian Standards (12 mgkg-1) for industrial zones. The results also revealed that the mean concentrations of Cr and Pb in soil samples exceed the recommended level by Germany Soil Regulation (50 mgkg-1 and 25 mgkg-1 respectively). The analysis concluded that the soil at Gifurwe mining site is strongly polluted by Arsenic and moderately polluted by Chromium and Lead. Hence, the downstream farmland of Gifurwe is declared as a contaminated site and prevented from other land use. Therefore, sustainable environmental management and contamination control strategies in Gifurwe mining areas are highly recommended.Keywords:
Burera, Contamination Factor, Gifurwe, Mining Activities, Pollution Load Index1. Introduction
In Rwanda, mining sector is one of the important economic activities which have the potential of contributing to economic development. But the sector is also among key environmental pollutants at the same time [1]. The materials gained in mining activity are among them: wolfram (Tungsten Ore), bauxite, coal, diamonds, iron, precious metals, lead, limestone, nickel, phosphate, rock salt, tin, uranium, molybdenum etc. [2]. Currently, there have been several reviews, studies and research articles providing assessments of various kinds of soil contamination, including urban soil contamination, agricultural soil contamination, and
soil contamination in mining areas [3].
Mining is one of the most important sources of heavy metals in the environment. Mining and milling operations together with grinding, concentrating ores and disposal of tailings, along with mine and mill waste water, provide obvious sources of environmental contamination [4].
are the source of heavy metals, which are washed out by precipitation and can contaminate all environmental components [7, 8].
In Rwanda, the major consequences in mining sector are environmental degradation (soil and water contamination); deforestation and desert formation; flooding, landslides and storms. In these cases, human health is affected by numerous diseases, on-site accidents and fatal injuries (health) and food security [9].
The five stages of mining are: exploration, development, extraction, benefication and metallurgical processing or refining, have damaged the natural environment in different manners, through ecological disturbance, destruction of natural flora and fauna, air pollution, land and water degradation, instability of soil and rock masses, landscape degradation and/or radiation hazards [10, 11].
The large-scale mining of Wolfram and associated minerals in Gifurwe mining sites have resulted in a high degree of degradation of arable land, vegetation and landscape, as well as other environmental problems such as soil contamination [1].
Moreover, previous highest arsenic concentrations detected in soils samples in downstream farm of Gifurwe tailings exceeded the international guideline values. Therefore, the downstream farmland in Cyeru river course is considered as contaminated site, degraded land and prevented from any other land use [12].
In this area, there is a lack of information on soil quality; minimal analysis has been undertaken with the purpose of assessing the impact of mining and prospecting activities on the environment, if any. Therefore, this research intends to evaluate the soil physicochemical parameters and assess soil contamination in mining areas of Wolfram Mining and Processing (WMP) in Gifurwe, Burera District of Rwanda.
2. Materials and Methods
2.1. Site Description
The study was conducted in Burera District, Gifurwe mining areas where Wolfram Mining and Processing (WMP) Ltd is operating. The location is situated at -10.556850 of
latitude and 290.809940 of longitude in central Rwanda. It forms part of the North-West to South-East oriented Bugarama-Gifurwe-Nyakabingo zones also known as the tungsten belt. The tungsten belt comprises silica-clastic rocks with composition ranging from black shales to quartz-phyllites to quartzites, which have undergone green schist metamorphism [13].
2.2. Sampling, Field Works and Analytical Procedure
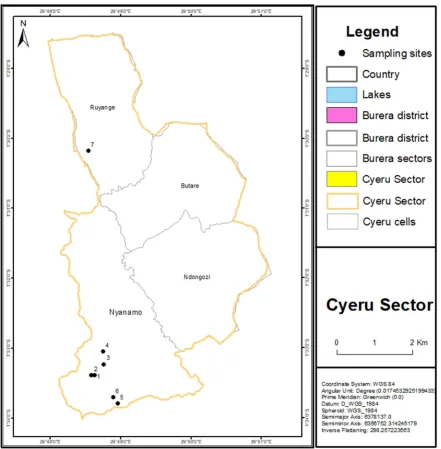
Seven sites were chosen along Gifurwe mining area from upstream to downstream (farm fields). The sampling sites were coded as: E2A, D9 (2), A6_Sup and near Cyeru River. A Global Positioning System, Garmin instrument (GPSMAP 64) was used to locate the soil samples as the experimental materials (Figure 1). A composite soil sample was taken from the top 0-30cm of the soil using an auger. After collection, soil samples were carefully transferred to clean and dry self-sealing polyethylene bags for transport to laboratory. The samples were dried for two weeks, crushed using mortar and pestle then sieved at 2mm. Finally, the soil samples were stored in tightly sealed polyethylene bags until further analysis. The composite soil samples were at the end used for determining the soil pH values and total heavy metals such As, Cr and Pb concentrations. The pH values of soil were measured using potentiometric method (ISO 10523) by glass electrode in the suspension soil-H2O. Electrodes
Figure 1. Key Map of the study area and localization of the soil samples in mine of Gifurwe.
2.3. Contamination Factor (CF) Assessment Method
The CF is the ratio obtained by dividing the concentration of each metal in the soil by the baseline or background value.
The CF was calculated using the formula suggested by Muller [15] through the following formula:
CF = (Concentration of heavy metal) / (Concentration of background) (1)
The contamination levels may be classified based on their intensities on a scale ranging from 1-6 (Table 1).
2.4. Pollution Load Index (PLI) Assessment Method Based on CF
The PLI is the arithmetic mean of CF of analyzed metals. The PLI was proposed by Tomlinson, Rahman and Esshaimi [16] [17] and [4] respectively for detecting pollution which permits a comparison of pollution levels between sites and at different times. The PLI was obtained as a concentration factor of each heavy metal with respect
to the background value in the soil. The PLI has been determined by the calculation of the product of the n CF as developed by Tomlinson [16] as follows:
PLI = (CF1 x CF2 x CF3 x…x CFn)1/2 (2)
the soil. The world average concentrations of the metals studied reported for shale [18] were used as the background for those heavy metals. According to Angula [19], the PLI is able to give an estimate of metal contamination status and the necessary action that should be taken. A PLI value of ≥ 100 indicates an immediate intervention to ameliorate pollution; a PLI value of ≥ 50 indicates a more detailed study is needed to monitor the site, whilst a value of < 50 indicates that drastic rectification measures are not needed [17].
Table 1. Different contamination factor for soil.
CF value CF level
< 1 None
1 None to medium
2 Moderate
3 Moderately to strong
4 Strongly polluted
5 Strong to very strong
6 Very strong
(Source: Muller, 1969).
3. Results and Discussions
3.1. Physico-Chemical Properties of Samples in Gifurwe Mine
The results obtained for pH and total concentration of metals are summarized in Table 2.
The results showed that the soil pH of the study area varies from 4.2 to 8.2. The highest pH values (8.2) was observed in the farm fields whereas the lowest values (4.2) was found in upstream points. With reference to soil pH interpretation norms of Boyer [20] and Pietrowiez [21]; the soil pH of Gifurwe mining sites varies from strongly acid to alkaline.
Moreover, pH is a measure of acidity and alkaline conditions of a solution or water. It is used to express the intensity of acidic or alkalinity of a water sample, which actually indicates the concentration of hydrogen ions present [22]. Low pH increases the solubility processes of heavy metal compounds, which increase contamination in the environment [6]. J. P Anderson [23] found that the degree of solubility determines the toxicity of heavy metals and that they are more toxic at low pH of less than 4.5 because they are more mobile.
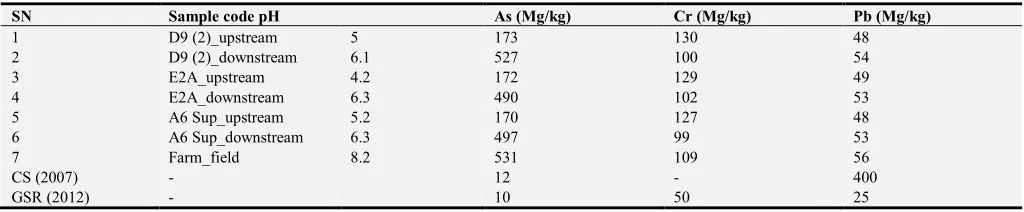
Table 2. Summary of pH and total concentrations of As, Cr and Pb for soil samples taken at Gifurwe mine.
SN Sample code pH As (Mg/kg) Cr (Mg/kg) Pb (Mg/kg)
1 D9 (2)_upstream 5 173 130 48
2 D9 (2)_downstream 6.1 527 100 54
3 E2A_upstream 4.2 172 129 49
4 E2A_downstream 6.3 490 102 53
5 A6 Sup_upstream 5.2 170 127 48
6 A6 Sup_downstream 6.3 497 99 53
7 Farm_field 8.2 531 109 56
CS (2007) - 12 - 400
GSR (2012) - 10 50 25
Note: The values are in mgkg-1 unless specified; -: missing values; CS: Canadian Standards GSR: German Soil Regulation.
The level of As in Gifurwe mining sites varies from 170 to 531mgkg-1 in A6_Sup_upstream and farm fields (near Cyeru River) in downstream zones. The As concentrations increase up to 531mgkg-1 downstream of the tailings dam (agricultural fields). The evidence from the test results (Table. 2) shows that the arsenic levels in the farm field of Gifurwe mining site were extremely high above maximum concentration levels (12 and 10 mgkg-1) allowed by Canadian Standards [24].
The As is an essential microelement for animals, but As is known as a toxic element. [25, 17] As problems in soils is primarily the result of significant anthropogenic activities particularly industrial activities such as metallurgical and chemical sprays. As is a priority toxic element that can cause arsenicosis-related disease and internal cancers, even in trace amounts [17]. The soil chemistry of arsenate (AsO43-)
resembles that of phosphate. Arsenate, however, can be reduced to arsenite (AsO2-). Elemental As, arsine (AsH3), and
As2S3 are stable under strongly reducing conditions, but
whether they form to an appreciable extent in soils is unknown.
Compared to the findings [12], highest concentration was detected in Gifurwe tailing dam and downstream fields; they
are exceeding international guideline values around 50 times. This shows that the mining site is gradually becoming contaminated. Also, Ni, Cu, Zn and As can be possibly toxic concentrations [25]. Though, arsenates occur in trace quantities in soils that they probably exist only as impurities in major soil particles and on particle surfaces rather than as separate minerals. Arsenic problems in soils are primarily the result of anthropogenic activities. Besides, Aluminium in soils is closely connected to soil acidity. The acidity of acid soils is due to the reactions of water with exchangeable Al3+ on the surface of soil particles. The strong Al-water reaction repels H+ from the water molecules into soil solution. This can create soil acidities as low as pH 4.5 [25, 3].
This is in congruent with results [25, 12, 26] argued that the toxic levels of Arsenic and Lead can be found in mining areas like in coal-fueled power plant waste. If these contaminants enter the environment- through dust, leaching into groundwater or from discharges into surface waters; they can contaminate drinking water supplies, rivers, lakes, streams and accumulate in livestock and crops.
compared to that of upstream. High values of Cr at Gifurwe mine can be linked to anthropogenic sources including mining activities. The results of this study were compared to the findings of Rahman [17] who reported that the Cr content of topsoil is known to increase due to pollution from various sources and the main ones are attributable to industrial wastes such as Cr pigment, electroplating sludge and municipal sewage sludge, etc. Cr behavior in soil is controlled by soil pH and redox potential, while long term exposure to Cr can cause liver and kidney damage.
Cr is widely distributed in the Earth’s crust. The amount of Cr decreases from the mantle through the lower to the upper crust and from the oceanic crust to the continental crust. Cr is geochemically close to Fe, Ni, Co, Ti, and Mn and tends to be present in mafic minerals. Common Cr minerals are chromite, chrome mica (fuchsite), and chrome spinel. Cr content decreases rapidly from ultramafic to mafic, acid, and alkaline igneous rocks. Cr is a common constituent in many minerals and is common in abyssal rocks such as kimberlites. Cr’s hydro and bioavailability are low. For the most part, Cr migrates in stream water in its solid phase [27]. The toxicity of Cr depends on its oxidation state. Hexavalent Cr is more toxic than the trivalent form [28].
The results (Table 2) revealed that the concentration of Pb at Gifurwe mining sites varied from 48 to 56 mgkg-1. The highest concentration was found in farm field and it is exceeding the tolerance limit value (25 mgkg-1) provided by GSR [29].
Pb is in the nature found in sulphide minerals (Galena, PbS and anglesite, PbSO4), oxide minerals and carbonate minerals
(cerrusite, PbCO3). The lead-zinc-vanadium deposit is
associated with a dolomite and limestone outcrop [30]. Therefore among heavy metals, Pb is the immobile element
and its content in soil is closely associated with clay minerals, Mn-oxides, Al and Fe hydroxides, and organic material [17].
Liquid effluent released from gold mines can constitute high concentration of heavy metals such as cadmium, arsenic, manganese, lead, antimony and organics such as nitrates, phosphates, and sulphates just to mention a few of the constituents [31]. Pb is a primary pollutant produced by the combustion of leaded petrol [32]. Beryllium, cadmium, copper, cobalt, chromium, mercury, manganese, nickel, lead, vanadium and zinc become more soluble in acidic solution [30].
3.2. Calculation of CF and PLI
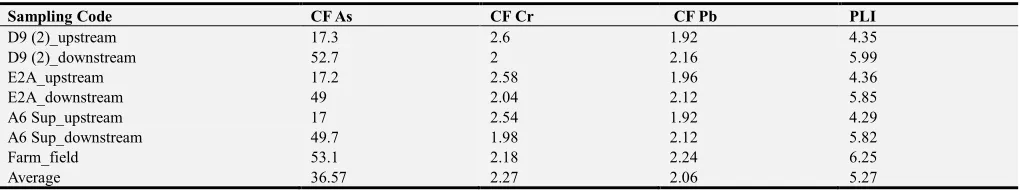
The assessment of the contamination of Gifurwe mine soil samples was based on CF (Equation 1). The soil was classified as very strong contaminated with As. The results (Table 3) revealed very high contamination factor at downstream zones of the mine, moderately contaminated with Cr and Pb in the upstream and downstream areas of Gifurwe mine. In addition, the Pb shifted from medium contamination level to moderately contamination level. The maximum values of contamination factor denoted very strong contamination. However, the PLI of Gifurwe mine calculated from CF shows that soils are moderately to severely contaminated by heavy metals especially in agricultural fields near the mining areas. The PLI values are < 50 which indicate that drastic rectification measures are needed.
Mining and subsequent ore-processing activities are always associated with very high levels of heavy metal contamination of the environment [33, 8]. Barkouch [34] declared that with a value greater than 1, it indicates that the analyzed sample had a metallic contamination caused by human activities (mining activities).
Table 3. Average Contamination Factor (CF) and Pollution Load Index (PLI) for soil samples of Gifurwemine.
Sampling Code CF As CF Cr CF Pb PLI
D9 (2)_upstream 17.3 2.6 1.92 4.35
D9 (2)_downstream 52.7 2 2.16 5.99
E2A_upstream 17.2 2.58 1.96 4.36
E2A_downstream 49 2.04 2.12 5.85
A6 Sup_upstream 17 2.54 1.92 4.29
A6 Sup_downstream 49.7 1.98 2.12 5.82
Farm_field 53.1 2.18 2.24 6.25
Average 36.57 2.27 2.06 5.27
4. Conclusions
The main purpose of this study was to assess the soil physicochemical parameters in order to determine the soil contamination level in mining areas of Gifurwe, Burera district of Northern Rwanda. The pH values of soil at Gifurwe mine vary from acid to alkaline. The results from soil samples showed that high concentrations of heavy metals, especially As (531mgkg-1), Cr (130 mgkg-1) and Pb (56 mgkg-1) exceeded the standards values set by German Soil Regulations (1999) and Canadian Standards (1997) for soils. The variations in heavy metal concentrations in soil are probably due to the influence of mining activities and
inadequate deposition of waste materials in the study area. Moreover, based on the PLI calculated, Gifurwe mining area is classified as very strong contaminated area with As in the downstream zones (agricultural fields) and moderately contaminated with Cr and Pb. Hence, appropriate monitoring and immediate interventions are in need to minimize pollution likelihood at Gifurwe mine.
contaminated fields downstream of mines with the purpose of withdrawing those areas from any further farming for instance plant trees and bushes and (d) conduct a comprehensive study of stream sediments and surface water at all mining sites.
Acknowledgements
We appreciate the support of the University of Lay Adventists of Kigali (UNILAK) through its Faculty of Environmental Studies.
References
[1] REMA. 2011. Mining Sector Working Paper. Appendix B. Done by Smith School of Enterprise and the Environment (SSEE)-University of Oxford in collaboration with Government of Rwanda.
[2] Adjei S., Oladejo N. K. and Adetunde I. A. 2012. The Impact and Effect of Illegal Mining (Galamsey) towards the Socio-economic Development of Mining Communities: A Case Study of Kenyasi in the Brong Ahafo Region. International Journal of Modern Social Sciences. ISBN: 2169-9917. [3] Wu J., Teng YG., Lu SJ., Wang YY., Jiao XD. 2014. Soil and
soil environmental quality monitoring in China: A review. Environ Int 69: 177–199.
[4] Esshaimi Mouhsine, Naaila Ouazzani, Marta Avila, Gustavo Perez, Manuel Valiente and Laila Mandi. 2012. Heavy Metal Contamination of Soils and Water Resources Kettara Abandoned Mine. American Journal of Environmental Sciences 8 (3): 253-261, 2012. ISSN 1553-345X.
[5] U. S. Environmental Protection Agency. 2005. The pollution information site, 129 priority pollutants. Available from: www.scorecard.org/chemical-groups/summary.tcl. [Accessed: 14th August, 2018].
[6] Nkuli G. 2008. Effects of gold mining activities on the water quality of Bulyanhulu River: The case of Bulyanhulu Gold Mine in Shinyanga - Tanzania. A Thesis Submitted in Partial Fulfilment of the Requirements for the Degree of Master of Science Integrated Water Resources Management. University of Zimbabwe. Faculty of Engineering Department of Civil Engineering. June, 2008.
[7] LI Z. Y., Ma Z. W., van der Kuijp T. J., Yuan Z. W., Huang L. 2014. A review of soil heavy metal pollution from mines in China: pollution and health risk assessment. Science of the Total Environment, 468: 843–853.
[8] Demková L., Jezný T., Bobuľská L. 2017. Assessment of soil heavy metal pollution in a former mining area - before and after the end of mining activities. Soil & Water Res. DOI: 10.17221/107/2016-SWR.
[9] MINIRENA. 2010. Mining Policy. Transforming Rwanda’s Mining Industry. Kigali-Rwanda. Pp.3.
[10] Aigbedion, I and Iyayi, S. E. 2007. Environmental effect of mineral exploitation in Nigeria. International Journal of Physical Sciences. Vol. 2 (2), pp. 033-038. Ambrose Alli University, Ekpoma-Nigeria. ISSN 1992-1950.
[11] Ripley, E. A., Redmann, R. E., and Crowder, A. A. 1996.
Environmental effects of mining. Delray Beach, FL: St. Lucie Press.
[12] Alina F. H., Rainer E., and Kayumba F. 2011.Environmental monitoring of small-scale mining areas in Rwanda. Compiled by BundesanstaltfürGeowissenschaften und Rohstoffe (BGR); Geological Survey of Namibia (GSN); Republic of Rwanda Rwanda Geology and Mines Authority (OGMR); Rwanda Environment Management Authority (REMA). Windhoek and Kigali, September 2011.
[13] De Clercq, F., Muchez, P., Dewaele, S., and Boyce, A. 2008. The Tungsten Mineralization at Nyakabingo and Gifurwe (Rwanda): Preliminary Results. Geologica Belgica, 11, 3-4, 251-258.
[14] Okalebo Kenneth J. R. 2002. LAB Method of soil and plant analysis. 8th edition.
[15] Muller, G. 1969. Index of geoaccumulation in sediments of the Rhine River. Geojournal, 2:108-118.
[16] Tomlinson, D. L.; Wilson, J. G.; Harris, C. R.; Jeffrey, D. W. 1980. Problems in the assessment of heavy metal levels in estuaries and the formation of a pollution index. Helgolaender Meeresunter, 33, 566–575.
[17] Rahman Syed Hafizur, Dilara Khanam, Tanveer Mehedi Adyel, Mohammad Shahidul Islam, Mohammad Aminul Ahsan and Mohammad Ahedul Akbor. 2012. Assessment of Heavy Metal Contamination of Agricultural Soil around Dhaka Export Processing Zone (DEPZ), Bangladesh: Implication of Seasonal Variation and Indices. Appl. Sci. 2012, 2, 584-601. ISSN: 2076-3417, doi: 10.3390/app2030584.
[18] Turekian, K. K. and Wedepohl, K. H. 1961. Distribution of the elements in some major units of the earth’s crust. Bull. Geo. Soc. Am.72, 175-192.
[19] Angula, E. 1996. The Tomlinson Pollution Index applied to heavy metal, Mussel-Watch data: A useful index to assess coastal pollution. Sci. Total Environ. 187, 19–56.
[20] Boyer, J. S. 1982. Plant Productivity and Environment.
Science, 218, 443-448.
[21] Pietrowiez P. 1985. Les sols de la région d’action du projet agro-pastoral de Nyabisindu, Rwanda.
[22] Mason, C. F. 1993.Biology of fresh water pollution. Longman Scientific and Technical. London, UK.
[23] Anderson, J. P., Estabrooks, T., McDonnell, J. 2000. Duluth Metropolitan Area Streams Snowmelt Runoff Study. Minnesota Pollution Control Agency, USA.
[24] Canadian Council of Ministers of the Environment. 2007. Canadian soil quality guidelines for the protection of environmental and human health. Available: http://ceqg-rcqe.ccme.ca/en/index.html. [Accessed: 14th August, 2018]. [25] Hinrich L. Bohn, Brian L. McNeal and George O’Connor A.
2001. Soil Chemistry. 3rd Edition. John Wiley&Sons, Inc. New York City. ISBN 0-471-36339-1. Pp.26-36.
[27] UNEP. 2013. Environmental Risks and Challenges of Anthropogenic Metals Flows and Cycles. A Report of the Working Group on the Global Metal Flows to the International Resource Panel. van der Voet, E.; Salminen, R.; Eckelman, M.; Mudd, G.; Norgate, T.; Hischier, R.
[28] Udiba U. U., Gauje Balli, Ashade N. O., Ade-Ajayi F. A., Okezie V. C., Aji B. M. and Agboun T. D. T. 2014. An assessment of the heavy metal status of River Galma around Dakace industrial layout, Zaria, Nigeria. Merit Research Journal of Environmental Science and Toxicology. Vol. 2 (8) pp. 176-184, November, 2014. ISSN: 2350-2266.
[29] Desaules A. (2012) Critical evaluation of soil contamination assessment methods for trace metals. Sci Total Environ 426: 120-131.
[30] Ashton, P. J., D. Love, H. Mahachi, P. H. G. M. Dirks (2001).
An Overview of the Impact of Mining and Mineral Processing Operations on Water Resources and Water Quality in the Zambezi, Limpopo and Olifants Catchments in Southern Africa. Contract Report to the Mining, Minerals and Sustainable Development (Southern Africa) Project, by CSIR
Environmentek, Pretoria, South Africa and Geology Department, University of Zimbabwe, Harare, Zimbabwe. Report No. ENV-P-C 2001-042. Pp 28.
[31] Marcello, M., Neel, J. K., (2000). Mercury Emission and Stability in Amazon, University of Perth, Australia.
[32] Ramakrishnaiah H and Somashekar, R. K., (2002). Heavy Metal Contamination in Roadside Soil and Their Mobility in Relations to pH and Organic Carbon. Soil and Sediment Contamination, 11 (5):643-654 (2002).
[33] Ma L., Sun J., Yang Z., Wang L. (2015): Heavy metal contamination of agricultural soils affected by mining activities around the Gabxi River in Chenzhou Southern China. Environmental Monitoring and Assessment, 187: 731-740.