V.Mary Sumalatha
et al
, International Journal of Computer Science and Mobile Applications,
Vol.2 Issue. 11, November- 2014, pg. 131-142
ISSN: 2321-8363
Model Based Test Case Optimization of UML
Activity Diagrams using Evolutionary Algorithms
V.Mary Sumalatha
Research ScholarGitam University, Visakhapatnam Andhra Pradesh, India
Dr. G.S.V.P.Raju
ProfessorAndhra University, Visakhapatnam Andhra Pradesh, India
Abstract
Software testing is the most challenging and dominating activity used by industry, therefore, improvement in its effectiveness, both with respect to the time and resources, is taken as a major factor by many researchers. The new paradigm to develop the software is to use a Model driven approach. Among the advantages behind it is the increasing efficiency with its support in many domains like solution, development, and business problems. In the development of the model driven software, Unified Modeling Language has become the industry standard for object oriented software development; also UML diagrams are effective enough to hold most of functioning phase. One of the important challenges in software testing is the test case generation. It is especially complicated when a system contains simultaneously executing participants. Since a system like that can show different responses depending on the simultaneous occurrence conditions. A UML diagram is a suitable modeling language for describing interactions between system objects given that an activity diagram can be conveniently used to capture business processes, workflows and interaction scenarios. This research will focus on test case generation, minimization, and prioritization using UML activity diagram by applying Evolutionary and Greedy Heuristic algorithms. The activity path is a method to calculate all the possible paths from the activity diagrams.
Keywords- UML, Activity diagrams, Activity Graph, Ambiguities, Evolutionary Algorithms, Software Testing, Test case Generation, Greedy Heuristic.
I.
Introduction to Software Testing
Testing, like in other manufacturing and engineering processes, is an integral part of the software development process. Generally, it consumes thirty to fifty percent of the software development budget, resources and time. Furthermore, in case of life and safety critical systems, it accounts for an even significantly higher percentage. Although testing is critical for controlling software quality, it is often largely neglected or is performed inefficiently. As software is getting ubiquitous, there is an increased dependence upon the features and services provided by software. Ironically, software systems are far too often failing due to anomalies and defects, thereby causing severe problems and damages, costing lives, reputations and fortunes. In 2005, Toyota had to recall 160,000 of its hybrid Prius cars due to faults in its embedded software. In another incident, the lack of a robust testing procedure contributed to the death of five patients and injuries to others by a radiation therapy device. A 2002 study conducted by the National Institute of Standards and Technology reported that software bugs cost the USA’s economy around $59.5 billion annually and, more than a third of that cost - about $22.2 billion, was caused by ineffective testing. The report further concluded that the lack of rigorous and robust testing during and after software development usually contributed to its failure. The problem is universally persistent in software projects irrespective of its geographical location, scale and type of software and developing organization. Software projects often running under pressure of limited time and budget are prone to compromises in the testing effort and program quality. Furthermore, poor program quality can generally be ascribed to inadequate and ineffective testing owing to a broad reluctance to accept robust techniques that may be highly expensive and lacking direct and obvious value for the project.
V.Mary Sumalatha
et al
, International Journal of Computer Science and Mobile Applications,
Vol.2 Issue. 11, November- 2014, pg. 131-142
ISSN: 2321-8363
other hand, premature software release with inadequate testing to meet deadlines, or to cut costs and minimize effort, may lead to accidents, injuries, and loss of time or data due to undetected faults. Software organizations, similar to the challenges faced in other industries, face an ongoing struggle between the aim for higher quality production and the desire to reduce both costs and time-to-market release cycle. Testing always needs a significant investment in terms of both time and effort. To remain competitive in the software business, organizations need to improve their testing activities resulting in higher productivity (performance) and better value.II.
Related Work
a. Pakinam N. Boghdady, Nagwa L. Badr, Mohamed Hashem and Mohamed F.Tolba 2011.
The technique developed by Pakinam et al is based on Basis path testing and Cyclomatic complexity. Proposed approach uses behavioral models to generate test cases. The proposed model studies the activity diagrams as a building block in launching the automated algorithm of generating test cases. The approach proposed can generate efficient test cases saving time, effort and increasing the quality of the test cases generated. Proposed method uses activity diagram as input and reads its content and stores the data in Activity Dependency table. ADT gathers information regarding all activities in the activity diagram including decisions, loops and synchronization, their names, controlling entities, their dependent nodes, input and the expected output. Using ADT a directed graph is constructed and is called as Activity Dependency Graph. To generate the activity graph the ADT is traversed and every symbol in the table is represented as a node and transition between activities is represented as an edge checking the dependency column. The graph is traversed using Depth first search to obtain the test paths. The generated test paths cover all branches, conditions, and basis paths in which loops are covered for zero or one time. Validation of the test cases is done using cyclomatic complexity technique. Cyclomatic activity table contains the activities involved, their names, and their dependencies. From the cyclomatic activity table, cyclomatic activity graph is generated. From the cyclomatic activity graph the number of minimum number of test cases to be covered are calculated and a lower bound and upper bound values are calculated. The generated test cases apply the branch coverage criteria, and the Cyclomatic complexity coverage. Proposed method fulfills full path coverage in some cases when the generated test cases exceed the Cyclomatic complexity. Thus, the proposed model applies the hybrid coverage criterion.
b. Debasish Kundu and Debasis Samanta 2008.
Proposed method gathers necessary test information from the activity diagram, uses the information to convert the activity diagram to activity graph and to generate test cases from the activity graph. Details of each activity such as what are actions encapsulated in an activity and what are the inputs, output parameters of each action are gathered. Ten types of activities S(start node), E(flow final/activity final), A(activity), O(object), OS(object state), M(merge), F(fork ), J(join), D(decision), C(condition) are considered in this approach. A set of 12 rules are defined for mapping activity diagram to activity graph. From the activity graph test cases are generated using a combination of Depth first search and breadth first search algorithms. For this purpose the graph is divided into concurrent and no concurrent sub graphs. Depth first search is applied on non concurrent sub graphs and breadth first search on concurrent sub graphs. Three types of coverage criteria, Basis path coverage, simple path coverage and Activity path coverage are proposed in the approach. An algorithm is proposed to generate the test cases. The reason for choosing Activity diagram has been specified in the approach. “Reasons are attributed as follows: (a) activity diagram presents concepts at a higher abstraction level compared to other diagrams like sequence diagrams, class diagrams and hence, activity diagram contains less information compared to others, (b) presence of loop and concurrent activities in the activity diagram results in path explosion, and practically, it is not feasible to consider all execution paths for testing.”
c. Santosh Kumar Swain Durga Prasad Mohapatra Rajib Mall 2010.
V.Mary Sumalatha
et al
, International Journal of Computer Science and Mobile Applications,
Vol.2 Issue. 11, November- 2014, pg. 131-142
ISSN: 2321-8363
denotes the state of an object during execution. And-or nodes are further subdivided into 3 types and nodes, or nodes and or-join nodes. In and-or node for and nodes all outgoing edges are activated simultaneously an activation of all the incoming edges. In or nodes only one outgoing edge is activated depending upon the guard condition. If there are one incoming and multiple outgoing edges the node is called or-join node. Edges connect every nodes in the diagram with a Boolean guard condition associated to it. Test coverage includes state-activity coverage, transition coverage and activity path coverage. After generating the test cases the approach evaluates the test cases using a fault injection technique called mutation analysis. Mutation operators applied in this approach are change parameter, wrong initial state, remove function call, missing condition, alter condition operator, violated guard condition, missing called functions, conflicting state, missing interaction, loop fault, and synchronization fault.III.
Model Based Testing.
Traditionally the testing process is based on manual work. Manual testing is a process carried out to find the defects. In this method that tester plays the lead role and end user verifies all features of the application. It is a basic type of testing which helps to find bugs in the software. It is preliminary testing needs to be carried out prior to start automating the test cases. For manual testing it is not necessary to have knowledge any testing tools. But according to software testing fundamentals complete automation is not possible. Automation in testing has evolved due to the limitations of manual testing. Running the test cases repeatedly is not possible in manual testing where as it is easy in automated testing. Manual testing is not suitable for changing environments where as automation in testing is very useful when the code frequently changes. The role of tester is more in manual testing and less in automated testing. Manual testing is slower in nature and automation is runs test cases significantly faster than human resources. For successful testing of new features as well as for performing regression testing, the testing tool chain must be able to store and re-execute previously tested test cases which is difficult in manual testing. One solution to this is to write test scripts. These tests can be quickly executed and evaluated before every release. However, as projects evolve, branches might be taken and features may change, requiring modification in all tests. Maintaining an up to date test suite becomes more difficult as the software evolves. Also as the tests become more complex, the testing team might have to spend more time doing repetitive work, although the test scripts might have common parts. Test automation speeds up the testing process and is usable for regression testing to ensure consistency in the software. One solution of generating tests useful for test automation is model based testing. MBT is a testing technique, which draws the benefits from abstract representations of the system to generate automated test cases. By using models for generating test scenarios instead of code or scripts, the regression test suite will always stay up to date since the test suite can be automatically updated with the latest modifications from the model by the test generation algorithm.
V.Mary Sumalatha
et al
, International Journal of Computer Science and Mobile Applications,
Vol.2 Issue. 11, November- 2014, pg. 131-142
ISSN: 2321-8363
software testing approach with UML. MBT is a general term denoting that software testing is based on software models. They derive test cases from models not from code as models describe software requirements and functional specifications. The main reason why usage of MBT has increased is that it can be used before and after developing of the software system.IV.
UML Diagrams
A model is a simplification of reality. It provides general as well as detailed plan of the system. Models are build for better understanding of the system. Modeling aims at visualizing the system, permits to specify the structure and behavior of the system, to provide with templates that guide in constructing the system and allows to document the details of the system. Main problem with modeling is choosing of right model for the right problem. The suitable is the model the relevant are the issues solved. UML is a standard language for writing blueprints. They are used to visualize, construct, and document the details of a system. The Unified Modeling Language (UML) as the name suggests is a unification of transition based, history based and operational based modeling languages.UML [OMG 2007] is widely established as a standard graphical notation for specifying the structure and behavior of object-oriented systems. It consists of a set of constructs common to most object-oriented languages. Object Management Group (OMG) was responsible for the standardizing of the UML as a notation. UML is mainly used in decomposing complex problems and presenting abstract visual perspectives of the models. The use of the UML benefits visualization of the models, providing higher-level structural views of the system, while the formal notations can fill in the processing details with their precise and unambiguous syntax. In recent years, the researchers have realized the potential of UML in software testing. Many of the UML design artifacts have been used in different ways to perform different kinds of testing.
The main objective of UML is to provide system architects, software engineers, and software developers with tools for analysis, design, and implementation of software based systems for modeling business and similar process [OMG 2007]. Modeling concepts in UML are represented using language units, where a language unit consists of a collection of tightly coupled modeling concepts that provides users to represent aspects of the system under study in a better way. These modeling languages are partitioned into horizontal layers with increasing capabilities and are called as compliance levels. Four compliance levels are defined in UML.
1. Level 0 (L0). This level has a single language unit, class based structures, which provide entry level capability of a model.
2. Level 1 (L1). This level extends the capabilities of level 0. It adds language units for modeling use cases, interactions, structures, actions and activities.
3. Level 2 (L2). This level extends the capabilities of level 1. It adds language units for modeling deployment, state machine and profiles.
4. Level 3 (L3). This level extends the capabilities of level 2 and represents complete UML. It adds language units for modeling information flows, templates and packages.
Structural diagrams define the static, structural constructs used in various structural. Structural concepts include classes, objects, components, nodes, and artifacts. There are seven structural diagrams, package diagrams, class diagrams, object diagrams, composite structure diagrams, component diagrams, deployment diagrams, and profile diagrams. Behavioral diagrams define the dynamic and behavioral constructs used in various behavioral diagrams. Behavioral constructs include activities, states, timelines, messages between objects, and interactions. There are seven behavioral diagrams: use case diagrams, activity diagrams, state machine diagrams, communication diagrams, sequence diagrams, timing diagrams, and interaction overview diagrams.
V.
Optimization Techniques
V.Mary Sumalatha
et al
, International Journal of Computer Science and Mobile Applications,
Vol.2 Issue. 11, November- 2014, pg. 131-142
ISSN: 2321-8363
find optimal solutions for mathematical problems using computers. Optimization became an essential in Mathematics, Engineering especially in computer science, economics, bioinformatics, telecommunication, networking, and management sciences.1. Test Case Minimization.
After generating the test suite the quality of the model is assessed by executing the test suite. To measure the quality of the test suite which contain important and unimportant test cases which need to be reduced by using some systematic procedure? Test cases generates need to be effective in terms of both resources and time. It is not guaranteed that the test cases generated are efficient in nature. The possibility of redundant test cases in the test suite needs to be detected and reduced. Redundant test cases occur when changes are done to the model or the generated test cases are not compatible with the model. This leads to the process of test case reduction. Test cases reduction is also called as test case minimization. The main goal of test suite minimization is to limit the size of the test suite using criteria or a method or a technique. Reduction procedure is applied to increase fault detection rate, maximize coverage, minimize running time, and decrease computational complexity. Research is done to generate a subset of the test suite with same coverage as the original test suite. This research addresses the test suite minimization problem with the advantage of producing test cases that are optimal with respect to coverage criteria i.e the coverage criteria is maximized. Since the test cases to be executed are limited the efficiency of software testing increases and time for testing decreases.
Let M be the model under test and T be the test suite generated then we have to find a subset of T called as T` which has the same requirement coverage or maximized requirement coverage. The requirement coverage is defined as a set of requirements covered by the test suite. Every test case has its own requirement coverage; the total coverage of the test suite is named as R. Every test case generated needs to meet a requirement criterion, where the requirement criterion may deal either with the code or the specification. The test case may the run to find if a certain statement, decision, branch, loop or an entity in the code or specification has met or not. Since this thesis deals with Activity Diagram converted to a graph, the requirement criterion may include the number of nodes, edges, edge pairs, decisions, fork join pairs covered. The main idea behind test suite minimization is to include only non redundant test cases in the test suite removing the redundant test cases. The new test suite generated need to meet the requirement coverage defined.
Definition of test suite minimization by harrold et al.,.
Let T be a test suite with a set of test cases {t1, t2, …., tn} with each test case ti satisfying a requirement criterion ri. The set of requirement criterion for the test suite is R = {r1 U r2 U r3…rn}. T` is a subset of T satisfying a requirement criterion R` where R` = {r1` U r2` U…rn`}.
2. Test Case Prioritization.
V.Mary Sumalatha
et al
, International Journal of Computer Science and Mobile Applications,
Vol.2 Issue. 11, November- 2014, pg. 131-142
ISSN: 2321-8363
required because regression testing consumes lot of time, cost, and resources. He proposed many techniques to prioritize test cases and to reduce the test suite and decide which test case to execute first.Definition By Gregg Rohermel.
Given: T, a Test Suite, PT, the set of possible ordering of T, and f, a function from PT to the real numbers. Problem: Find T` Є PT such that (for all T``) (T`` Є PT)(T`` Not equal to T`)[f(T`)≥f(T``)].
In the definition T represents the test suite that contains the set of test cases, PT represents the possible ordering of the test suite, and when a function f is applied to the ordering generates a priority value to every test case.
VI.
Evolutionary and Greedy Heuristic Algorithms
Evolutionary Algorithms are used in computer based problem solving systems. Many evolutionary algorithms like Genetic algorithms, evolutionary programming, evolution strategies, classifier systems and genetic programming are proposed in theory. All algorithms proposed share a common characteristic of simulating the evolution process including selection, reproduction, and mutation. Evolutionary Algorithms involves researchers from various disciplines including computer scientists, engineers, robotic scientists, cognitive scientists, physicists, biologists and philosophers. Various forms of evolutionary algorithms are defined in theory but all of them share a common technique. The basic idea behind evolutionary algorithms is that for a given population the individuals with better fitness survive. Better individuals are selected for next generation and operators like recombination and mutation are applied on the individuals to generate new individuals. Entire process is repeated until a solution is found or the computational limit is reached. Many forms of evolutionary programming techniques are defined in theory. The representation of the individuals is used to characterize various forms. Individuals are represented as binary strings in Genetic Algorithms. Real valued vectors are used in Evolutionary Strategies. Finite state machines are used in Evolutionary programming. Trees are used in Genetic Programming.
1. Genetic Algorithm
Genetic algorithm is a machine learning model which is based on the process of Evolution of nature. The process of evolution is not a direct process and is not guaranteed to support that the evolution process compulsorily generates mankind. It completely depends on the betterment of the individuals that take part in the process. In the process of evolution offspring generated may be identical to the parent or they may differ from the parent. Asexual reproduction leads to offspring identical to parents and sexual reproduction leads to radically different offspring. To generate identical or different offspring, individuals exchange some parts of genetic information called as recombination operation and is referred as Crossover in Genetic Algorithm. Crossover occurs between two or more individuals and these individuals are selected from the population by applying a Fitness function. Mutation operator plays a dominant role in Genetic Algorithm.
2. Evolutionary Strategy
Evolution strategy was developed by three students [Ingo Rechenberg, Hans-Paul Schwefel and Peter Bienert] of Technical University of Berlin while experimenting with random strategies for a wind tunnel. Early they are used to solve technical optimization problems. Evolutionary strategies use selection, recombination, and mutation. They start with an initial population which can be recombined with random mating, mutation, and selection. Two types of selection methods are proposed namely PLUS selection and COMMA selection. In plus selection the parents are used in selection and in comma selection offspring undergoes selection.
3. Steady State genetic Algorithm
V.Mary Sumalatha
et al
, International Journal of Computer Science and Mobile Applications,
Vol.2 Issue. 11, November- 2014, pg. 131-142
ISSN: 2321-8363
4. Struggle Genetic Algorithm
STGA was developed by Gruninger in 1996 to maintain diversity among solutions. STGA differs from SSGA in replacing of individuals in the population. Replace worst is the strategy used in SSGA where as in STGA similar individuals are replaced. Two individuals are selected from the population and off springs are generated by applying crossover and mutation. The children produced are compared with every individual in the population. The individual that is similar to the child is found in the population and is replaced with the child if the child has a lower rank or if the child dominates over it. The rank of the population is again calculated if the child gets replaced. The only important issue in this STGA lies in finding a similar element in the population. Measure of similarity is done in terms of distance function (like cosine distance, Euclidean distance, hamming distance), fitness function, genotype, or phenotype of the individual. The disadvantage of STGA is that the computational cost increases if the population size is large.
5. Evolutionary Programming
Evolutionary programming, are stochastic optimization strategies developed by Lawrence J. Fogel in 1960. They are similar to genetic algorithms but they concentrate on the behavioral linkage between parents and the generated off springs. Evolutionary programming uses fitness function in terms of variables to find an optimal solution in terms of the variables used. Evolutionary algorithm consists of: choose a set of random solutions as initial population. Each solution replicates a new population and mutation operation is applied on these solutions. Fitness function defined in terms of the variables is applied on these solutions. Evolutionary Programming uses mutation operator to create new individuals. Crossover is not used in evolutionary algorithm.
6. Greedy Heuristic
The proposed approach is based on the Greedy-Activity-Selector algorithm which is an iterative procedure of Recursive-Activity-Selector algorithm proposed by Cormen. Activity selection problem schedules several competing activities that require exclusive use of a common resource with a goal of selecting a maximum-size set of mutually compatible activities. Test suite minimization is similar to the activity selector problem where a set of test cases need to satisfy a set of test requirements. In activity selector problem a maximum size subset of mutually compatible activities is generated within the given start and finish time to solve the problem and in test suite minimization a minimum size subset of test cases need to be generated that satisfy the test requirement.
VII.
Proposed Methodology
Activity diagram graph constructed from an Activity diagram consists of two types of elements: nodes and edges. Nodes are connected using edges. Generally nodes have a single outgoing edge pointing to another node but some nodes have more than one outgoing edges. These edges are called as branches. These nodes, edges, and branches form the coverage criteria for the Acticity diagram graph. Coverage criteria are calculated as the number of elements covered in the test case. The number of test cases generated need to be reduced as the size of the test suite is large. In the proposed method a test case is considered to be redundant if it does not contain at least one node that becomes part of the reduced test suite. A simple node coverage criterion is applied to reduce the size of the test suite. Every test case generated traverses a test path that contains a set of nodes that is subset of the original node set. The set of test cases that constitute the original node set is found and the rest of the test cases are discarded. If a test case has at least new node that is not present in traversed node set and present in the original node set that test case is added to the reduced test suite. It is guaranteed that the reduced test set covers all nodes and edges but does not guarantee path coverage.
VIII.
Case Study
V.Mary Sumalatha
et al
, International Journal of Computer Science and Mobile Applications,
Vol.2 Issue. 11, November- 2014, pg. 131-142
ISSN: 2321-8363
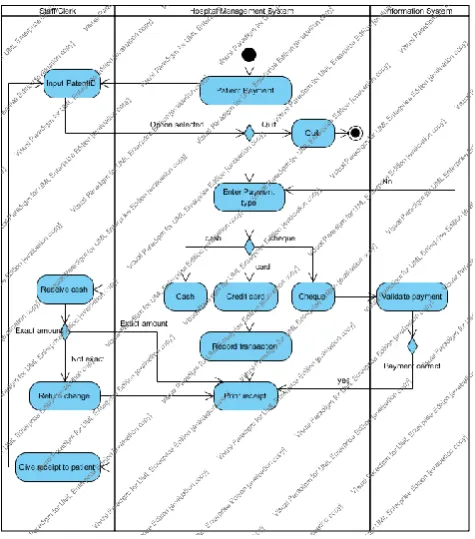
A. The activity diagram for the above case study isFigure 1. The Activity Diagram for the Patient Payment usecase
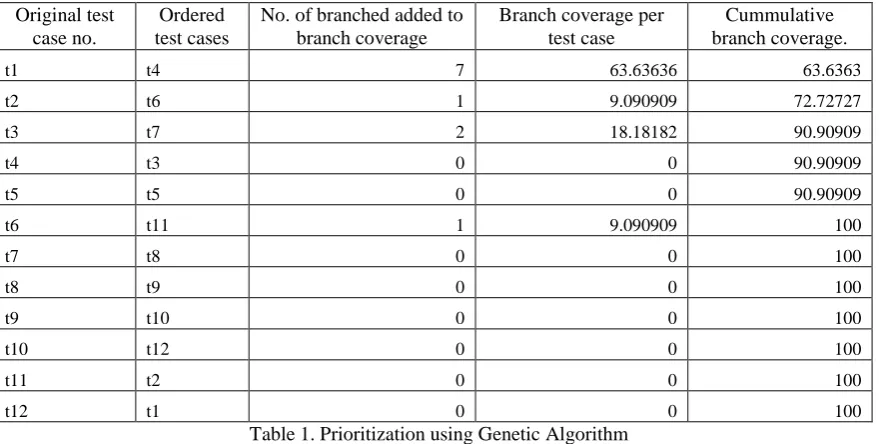
The above given Activity diagram is converted to activity graph and test cases are generated from the activity graph. the generated test cases are first prioritized using Evolutionary algorithms and then they are minimized by applying the greedy heuristic technique. The combination of both the algorithms produces an ordered test suite and a reduced test suite. Patient payment activity diagram is converted to a graph and the following test cases are generated from it. Genetic algorithm is applied on the test suite and the number of times a chromosome is selected acts as a rank function which determines which test case needs to be executed first. The average percent branch coverage is calculated for every test case. After prioritizing the test suite, greedy heuristic is applied on the ordered test suite. according to the greedy heuristic only those test cases that add atleast one branch to the branch coverage criterion are added to the reduced set and the others are disacarded. The following table describes how the test cases are ordered.
InitialNode Patient-Payment MergeNode Input-PatentID Option-selected Quit ActivityFinalNode
InitialNode Patient-Payment MergeNode Input-PatentID Option-selected MergeNode Enter-Payment-type DecisionNode Cash Receive-cash Exact-amount Return-change MergeNode Print-receipt Give-receipt-to-patient MergeNode Input-PatentID
Option-selected Quit ActivityFinalNode
InitialNode Patient-Payment MergeNode Input-PatentID Option-selected MergeNode Enter-Payment-type DecisionNode Cash Receive-cash Exact-amount Return-change MergeNode Print-receipt Give-receipt-to-patient MergeNode Input-PatentID
V.Mary Sumalatha
et al
, International Journal of Computer Science and Mobile Applications,
Vol.2 Issue. 11, November- 2014, pg. 131-142
ISSN: 2321-8363
InitialNode Patient-Payment MergeNode Input-PatentID Option-selected MergeNodeEnter-Payment-type DecisionNode Cash Receive-cash Exact-amount MergeNode Print-receipt Give-receipt-to-patient MergeNode Input-PatentID Option-selected Quit ActivityFinalNode
InitialNode Patient-Payment MergeNode Input-PatentID Option-selected MergeNode
Enter-Payment-type DecisionNode Cash Receive-cash Exact-amount MergeNode Print-receipt Give-receipt-to-patient MergeNode Input-PatentID Option-selected MergeNode Enter-Payment-type DecisionNode Cheque Validate-payment Payment-correct ActivityFinalNode
InitialNode Patient-Payment MergeNode Input-PatentID Option-selected MergeNode
Enter-Payment-type DecisionNode Credit-card Record-transaction MergeNode Print-receipt Give-receipt-to-patient MergeNode Input-PatentID Option-selected Quit ActivityFinalNode
InitialNode Patient-Payment MergeNode Input-PatentID Option-selected MergeNode
Enter-Payment-type DecisionNode Cheque Validate-payment Payment-correct MergeNode Enter-Payment-type DecisionNode Cash Receive-cash Exact-amount Return-change MergeNode Print-receipt Give-receipt-to-patient MergeNode Input-PatentID
Option-selected Quit ActivityFinalNode
InitialNode Patient-Payment MergeNode Input-PatentID Option-selected MergeNode
Enter-Payment-type DecisionNode Cheque Validate-payment Payment-correct MergeNode Enter-Payment-type DecisionNode Cash Receive-cash Exact-amount MergeNode Print-receipt Give-receipt-to-patient MergeNode Input-PatentID Option-selected Quit ActivityFinalNode
InitialNode Patient-Payment MergeNode Input-PatentID Option-selected MergeNode
Enter-Payment-type DecisionNode Cheque Validate-payment Payment-correct MergeNode Enter-Payment-type DecisionNode Credit-card Record-transaction MergeNode Print-receipt Give-receipt-to-patient MergeNode Input-PatentID Option-selected Quit ActivityFinalNode
InitialNode Patient-Payment MergeNode Input-PatentID Option-selected MergeNode
Enter-Payment-type DecisionNode Cheque Validate-payment Payment-correct MergeNode Enter-Payment-type DecisionNode Receive-cash Exact-amount Return-change MergeNode Print-receipt Give-receipt-to-patient MergeNode Input-PatentID Option-selected Quit ActivityFinalNode
InitialNode Patient-Payment MergeNode Input-PatentID Option-selected MergeNode
Enter-Payment-type DecisionNode Cheque Validate-payment Payment-correct MergeNode Enter-Payment-type DecisionNode Receive-cash Exact-amount MergeNode
Print-receipt Give-receipt-to-patient MergeNode Input-PatentID Option-selected Quit ActivityFinalNode
InitialNode Patient-Payment MergeNode Input-PatentID Option-selected MergeNode
V.Mary Sumalatha
et al
, International Journal of Computer Science and Mobile Applications,
Vol.2 Issue. 11, November- 2014, pg. 131-142
ISSN: 2321-8363
Original testcase no.
Ordered test cases
No. of branched added to branch coverage
Branch coverage per test case
Cummulative branch coverage.
t1 t4 7 63.63636 63.6363
t2 t6 1 9.090909 72.72727
t3 t7 2 18.18182 90.90909
t4 t3 0 0 90.90909
t5 t5 0 0 90.90909
t6 t11 1 9.090909 100
t7 t8 0 0 100
t8 t9 0 0 100
t9 t10 0 0 100
t10 t12 0 0 100
t11 t2 0 0 100
t12 t1 0 0 100
Table 1. Prioritization using Genetic Algorithm
Twelve test cases are generated from the patient payment activity diagram and the average percent branch coverage 92% after prioritizing the test cases. The test cases that are added to the reduced set are four and the other eight test cases are deleted from the test suite. The reduction rate is nearly 67 percent. the other evolutionary algorithms are applied on the activity diagram to generate a better reduction rate and branch coverage.
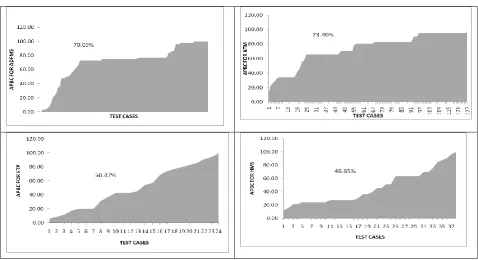
The four case studies Airport Departure Flow Management System (ADFMS), Automated teller Machine (ATM), Hospital Management system (HMS), and Edit Trend Properties (ETP) are used in experimenting to find the reduced set. The proposed algorithms were applied to cover all nodes, edges, and branches on the generated test suite. greedy heuristic and the oter evolutionary algorithms were applied to find the coverage criteria. The following table shows the results obtained by applying grredy heuristic on the generated test suite. The average percent branch coverage for model is calculated and is tabled as follows.
ADFMS ATM HMS ETP
Average percent node coverage
66.9 75.71 47.79 48.26
Average percent edge coverage
68.26 72.27 47.68 48.75
Average percent branch coverage
70.09 73.40 46.65 50.47
V.Mary Sumalatha
et al
, International Journal of Computer Science and Mobile Applications,
Vol.2 Issue. 11, November- 2014, pg. 131-142
ISSN: 2321-8363
Table 3. Average Percent Branch Coverage for ADFMS, ATM, HMS, and ETP
GREEDY SIMPLE STEADY STRUGGLE ESC ESP EP
ADFMS 74 80 87 85 84 85 83
ATM 82 85 85 88 87 85 88
HMS 53 66 66 58 66 66 71
ETP 17 42 38 42 42 42 38
Table 4. Reduction Percentages using Evolutionary and Greedy Algorithms
SIMPLE STEADY STRUGGLE ESC ESP EP
NO
PRIORITY OPTIMAL
80 85 85 84 84 88 85 97
89 87 90 80 85 91 83 98
75 76 81 78 81 79 50 93
67 75 76 73 73 79 59 87
Table 5. Average Percent Branch Coverage after Prioritization
GREEDY SIMPLE STEADY STRUGGLE ESC ESP EP
ADFMS 70 63 70 72 64 70 67
ATM 73 68 63 78 64 61 72
HMS 47 67 71 69 64 70 71
ETP 50 60 73 66 72 72 70
V.Mary Sumalatha
et al
, International Journal of Computer Science and Mobile Applications,
Vol.2 Issue. 11, November- 2014, pg. 131-142
ISSN: 2321-8363
IX.
Conclusion
In this paper we presented the test case generation of UML activity diagram. Moreover our method for test case generation by removing ambiguities produces a set of test cases that are more efficient and effective. In future, it is possible to build an automatic tool using this approach. This automatic tool will reduce cost of software development and improve quality of the software.
References
[1].Beizer.B. Software System Testing and Quality Assurance, Van Nostrand Reinhold, New York, 1984. [2].Beizer.B. Software testing Techniques, Van Nostrand Reinhold, New York, 1983 and 1990 2nd edition. [3].Binder.R.V. Testing Object-oriented systems, Addison-Wesley, 1999.
[4].Debasish Kundu, Debasis Samanta: "A Novel Approach to Generate Test Cases from UML Activity Diagrams", in Journal of Object Technology, vol. 8, no. 3, May-June 2009, pp.65-83
[5].Fogel LJ (1960) Biotechnology: Concepts and Applications, Prentice Hall.
[6].G. Rothermel, R.H. Untch, C. Chu, and M.J.Harrold, “Prioritizing Test Cases for Regression Testing,” IEEE Trans. Software Eng., vol. 27, no. 10, pp. 929-948, Oct. 2001.
[7].Ingo Rechenberg, Hans-Paul Schwefel and Peter Bienert, Evolutionsstrategie, Frommann-Holzboog Verlag, 1973 [8].OMG. UML Superstructure, Version 2.1.1. OMG Document Formal/2007-02-03. Object Management Group, Needham, MA, 2007.
[9].OMG. UML Infrastructure Version 2.1.2. OMG Document Formal/2007-11-04. Object management Group, Needham, MA, 2007. http://www.omg.org/spec/UML/2.2/Superstructure/PDF
[10].Santosh Kumar Swain and Durga Prasad Mohapatra, “Test Case Generation from Behavioral UML Models”, International Journal of Computer Applications (0975 – 8887) Volume 6– No.8, September 2010
[11].Pakinam N. Boghdady, Nagwa L. Badr, Mohamed Hashem and Mohamed F.Tolba, “A Proposed Test Case Generation Technique Based on Activity Diagrams”, International Journal of Engineering & Technology IJET-IJENS Vol: 11 No: 03
[12].Sebastian Elbaum, Gregg Rothermel, Satya Kanduri, Alexey G. Malishevsky, Selecting a Cost-Effective Test Case Prioritization Technique, April 20, 2004
[13].M.J. Harrold, R. Gupta, M.L. Soffa, “A Methodology for Controlling the Size of a Test Suite”, ACM Transactions on Software Engineering Methodologies 2, 1993, pp. 270-285
[14].T. Gruninger. Multimodal optimization using genetic algorithms. Master’s thesis, Stuttgart University, 1996