69
EMPLOYABILITY OF MACHINE LEARNING
TECHNIQUES IN DEVELOPING ADVANCE
TRAFFIC INFORMATION SYSTEM TO PREDICT
HEAVY TRAFFIC CONGESTION IN MITIGATING
CRASH OCCURRENCES DURING PEAK HOURS ON
EXPRESS WAYS USING SUPPORT VECTOR
MACHINE CLASSIFICATION
Jaskaran Singh Kohli Bachelor’s in Technology , CSE
( SRM Institute of Science and Technology ,Kattankulathur, Tamil Nadu ,India)
ABSTRACT
The traffic security on roads is critical for the proficient activity of the regional framework, and there is an intimate connection between traffic states and crashes on freeways, and the event of accidents might be affected by the cooperation of various blends of traffic states upstream and downstream of the accident area. In light of the accident information and the comparing traffic stream finder information gathered on freeways in Shanghai, this investigation proposes a half and half model joining a support vector machine (SVM) display with a k-means bunching calculation to foresee the probability of accidents. The Random Forest (RF) display is utilized to choose the critical and noteworthy factors for model development from the information of the traffic stream 5– 10 min before the accident happened. At that point, the cross-approval and transferability of various models (SVM demonstrate without variable choice, SVM display with variable determination, and a half and half SVM show with variable choice) are resolved to utilize 577 accidents and 5794 coordinated non-crash occasions. The results show that the mishap figure show close by the four most fundamental variables picked using the RF model can get an alluring desire execution for mishaps. With the blend of the clustering computation and SVM illustrate, the precision of the mishap desire model can be as high as 78.0%. Additionally, the outcomes of the transferability of the three exceptional models propose that the variable assurance and gathering estimation both have use for mishap desire.
1
INTRODUCTION
the past decade, studies concerning crash predictionmodels have been very popular in freeway safety analyses.
In practice, with a real-time crash prediction model, several safety countermeasures on expressways can be applied. First, drivers can be notified through in-car display devices or variable message signs on the road; furthermore, in the case of a likely high-risk crash segment, it is important to dispatch rescue vehicles in advance.
In general, the development of a real-time crash prediction model is based on crash (non-crash) data and the corresponding traffic data, which are collected from detectors installed upstream and downstream of the crash location. In addition, the traffic state of expressways can be described by traffic parameters, among which the basic traffic flow data (i.e. volume, speed and occupancy) and their combinations are commonly used. Furthermore, several previous studies developed different crash prediction models within different traffic states. However, there is a relationship between traffic states and crash incidents on freeways. The events of accidents might be brought about by the association of various blends of upstream and downstream traffic states close to the accident area. Therefore, the accident expectation model ought to incorporate traffic states in the model as opposed to be essentially grown independently for various traffic states. Along these lines, the target of this exploration is to sort different traffic states with different traffic parameters utilizing grouping calculation and after that to anticipate crashes with a help vector machine (SVM) demonstrate which together form a half and half model.
On the other hand, some previous research paid more attention to the crash prediction modelling approach, while the identification of the critical variables that can describe the crash risks was ignored. However, it can lead to high computational complexity and over-fitting of models due to too many variables. Thus, it is important to identify the critical variables from the whole candidate variables before using the crash prediction models. Since the random forest (RF) model is an effective method for calculating the importance of the model variables, critical variables are selected by the RF model for the construction of the predictive model in this study.
2
DATA COLLECTION
2.1 Crash data
71 577 crashes innormal weather condition are identified and used in the study. Each crash data contains information, such as the accident occurrence time, location, type of crash and weather.
2.2 Traffic flow data
The traffic state of an expressway in this study is described by the traffic flow parameters (volume, speed and occupancy) and their combinations. These data are collected from the detectors near the crash site.
Before the crash occurrence, there are nearly 20 min of traffic flow data that can be used for crash prediction, which could be separated into four 5-min time slices .
Each crash corresponds to the traffic data collected from the four detectors nearest to the crash, each with two detectors upstream and downstream. The four detectors are named D1, D2, D3 and D4 in the order from upstream to downstream, as shown in Fig. 1. Therefore, traffic flow data (volume, speed and occupancy) can be obtained from each detector. Also, the differences and average values of the traffic flow data upstream and downstream of the crash site are calculated from this raw data.
Therefore, the input variables of the model can be divided into three parts: the first part is the original detector data; the second part is the difference of the traffic flow data between one upstream detector and one downstream detector; and the third part is the average value of the traffic flow data of two upstream or downstream detectors. Specific variables are listed in Table
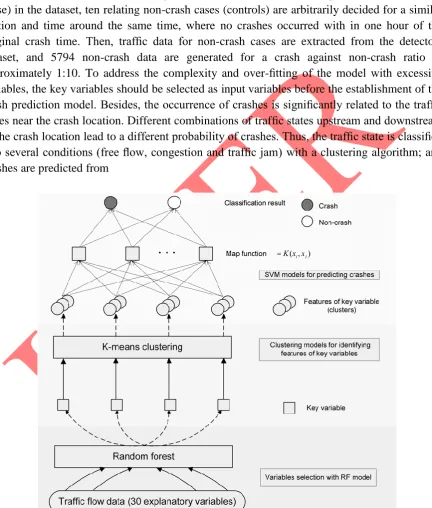
where ‘x’ represents the type of data indicated by ‘q’, ‘v’ and ‘o’, which are short for volume, As the predictive modelling is treated as a classification problem to distinguish crash-prone traffic conditions from normal conditions, the traffic data under conditions that do not lead to a crash are also collected. Similar to the crash data, the non-crash data are collected under different traffic conditions, according to a matched case-control design . For each accident (case) in the dataset, ten relating non-crash cases (controls) are arbitrarily decided for a similar section and time around the same time, where no crashes occurred with in one hour of the original crash time. Then, traffic data for non-crash cases are extracted from the detectors dataset, and 5794 non-crash data are generated for a crash against non-crash ratio of approximately 1:10. To address the complexity and over-fitting of the model with excessive variables, the key variables should be selected as input variables before the establishment of the crash prediction model. Besides, the occurrence of crashes is significantly related to the traffic states near the crash location. Different combinations of traffic states upstream and downstream of the crash location lead to a different probability of crashes. Thus, the traffic state is classified into several conditions (free flow, congestion and traffic jam) with a clustering algorithm; and crashes are predicted from
Fig. 1Structure of the crash prediction model
73 obtained with a lower computational load and higher robustness. The entire data flow process is indicated in Fig.2and will be described in detail below.
2.3 Clustering method
In the first part of the hybrid model, a commonly used clustering method, K-means clustering, is adopted to abstract each selected variable into several groups because of the continuous nature of all the variables in this study .
SVM model with two penalty parameters
In the second piece of the crossover show, an SVM demonstrate with two punishment parameters is produced for the characterization of accident inclined conditions from typical traffic conditions. The SVM show is a sort of learning calculation dependent on correct learning hypothesis and the basic hazard minimization standard, which can be changed following a guide the input– yield relationship for a non-straight framework. The fundamental thought of the SVM display is that it maps the info vectors into some high-dimensional component space Z through non-direct mapping picked from the earlier. In this space, a right choice surface is built with unique properties that guarantee the high speculation capacity of the system . There is a wide range of sorts of SVM models as indicated by the distinctive goal. Inferable from the characterization issue in this investigation, the C-bolster vector order demonstrates (C-SVM) in LIBSVM is utilized in this examination [29]. When utilizing the C-SVM display, the information ought to be partitioned into a preparation dataset and a testing dataset. The preparation dataset is characterized as vectors
{xi, yi}li
=1, where xi represents the traffic condition variables and yi
= 1 represents the crash occurrence. Therefore, the aim is to find
an optimal hyper plane that can separate the category of each input
and is defined as
Its twin difficulty is
where e = [1,…,1]T is the vector of every one of the ones, C+ speaks to the punishment parameter of the characterization of accidents, while C− is one of the non-crashes, Q is a l × l positive semi-unequivocal framework and Qij ≡ yi yjK(xi, xj) and K(xi, xj) =f(xi)Tf(xj) is the piece work. Here, preparing vectors xi are mapped into a higher-dimensional space by the capacity f. In spite of the fact that few bits have been proposed by analysts, the spiral premise work is the most ordinarily utilized portion and is received in this examination as
Finally, the choice purpose that can separate two conditions is
75 Model evaluation
The ratio of the crash data and non-crash data is approximately 1:10and this becomes an imbalanced classification problem. Owing to the small ratio of crash data in the dataset, the overall accuracy metric at is no longer sufficient to evaluate the performance of a classification model because the overall classification accuracy can be as high as 90.8%, even if the model classifies all the cases as non-crashes. Hence, several metrics based on the confusion matrix are used for the effectiveness evaluation on the imbalanced classification as shown in Table 3.
Therefore, we assess the calculations as far as the expectation adequacy utilizing the accident grouping precision, false alert rate, generally arrangement exactness, G-means and F-measure. As discovering crash-inclined conditions are what we are especially inspired by, the F-proportion of the accident expectation model will be utilized more. A preparation dataset and testing dataset are relegated haphazardly from a dataset. Both datasets contained numerous accidents and non-crashes with their comparing traffic condition information. To lessen the blunder caused by the irregular division of the dataset, ten investigations with various preparing and testing datasets arbitrarily created from one lot of traffic information are directed. At that point, a lot of mean of previously mentioned measurements is utilized to speak to the mode execution.
3 RESULTS OF ANALYSIS
3.1 Results of variable selection
To select the appropriate number of important variables to develop the crash prediction model, a primary test of the RF model is conducted to obtain the minimum OOB error with fewer variables .In addition, the analysis result shows that with the top eight variables adopted in the RF model, the OOB error reaches a relative minimum. However, it is not always the case that more variables lead to higher prediction accuracy. Then, a comparative analysis is conducted with the construction of the SVM model to examine the possibility of fewer variables based on 408 crashes and 4063 corresponding non-crashes on the Yan-an expressway .Different numbers of input variables for the SVM models are developed for confirming the proper number of input variables .The result shows that models with the four most important variables obtained the best performance and were ultimately selected as the input for the models in this study. As shown in Figs. 3, the four selected variables are o2, Do23, Ao12 and v3, respectively, which is the occupancy of the D2 detector, the occupancy difference of the D2 and D3 detectors, the mean of the occupancy upstream of the crash location, and the average speed of the D3 detector.
In addition, a comparison between the SVM model with and without variable selection is conducted. As mentioned, a training dataset and testing dataset are assigned randomly and equally from a dataset. Generally, the comparison and concerning results are calculated from the testing dataset. However, since over-fitting may be caused by excessive variables, an additional test is conducted with the training dataset to compare the testing dataset results as shown in Table 4. From the table, we know that the SVM model without variable selection exhibits severe over-fitting as the crash prediction accuracy decreases greatly, though the model obtain quite well prediction accuracy with the training dataset. With regard to the SVM model with variable selection, the crash prediction accuracy and the false alarm rate both varies
Classification ability and the F-measure both have a promotion. We thus conclude that variable selection provides more efficient crash prediction.
3.2 Results of the hybrid model
Based on the data collected on the Yan-an expressway, a comparison analysis of hybrid model used in this study is conducted with the result of the SVM model with variable selection as the baseline .The analysis result is shown in Table 5 as follows. As we can see from Table 5, the hybrid model shows improved classification accuracy compared with the original SVM model. All five metrics of the hybrid model with k-means clustering have an advantage over the baseline for not only the balanced classification ability, but also the ability to predict crashes, which are shown by the G-means and F-measure. Meanwhile, although it is a tiny advancement with the clustering introduced in the hybrid model, the computational property of the SVM model can improve to a large extent, especially with large-scale data .As represented in the literature review, the prediction accuracy of the hybrid model in this study is superior to that in previous studies, where the model that can predict 73.9% crashes with a false alarm rate of 28.7% in is the best model. In addition, the false alarm rate of the hybrid model performs better than the SVM model in our previous study at 26.1% . Thus, the results show that the Hybrid model combined with the SVM model and clustering algorithm is relatively better for the prediction of crashes.
3.3 Transferability of the model
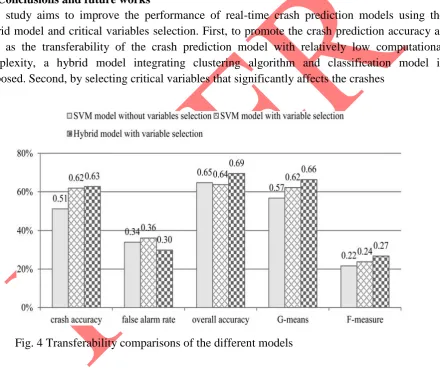
79 variables election has the worst accuracy. With the use of variable selection and clustering, the crash prediction accuracy increases to some extent, whereas the performance of the false alarm rate decreases a little. It can also be observed from the variety of the G-means and F-measure. It is shown in the figure that the G-means vary from0.57 to 0.66, while the F-measure increases by 0.05. Although the transferability of the crash prediction model cannot reach the original prediction accuracy, the transferability in this study already reaches a reasonable extent while a 55.84% crash prediction is obtained using the logistic regression model for the transferability test in the study.
3.4 Conclusions and future works
This study aims to improve the performance of real-time crash prediction models using the hybrid model and critical variables selection. First, to promote the crash prediction accuracy as well as the transferability of the crash prediction model with relatively low computational complexity, a hybrid model integrating clustering algorithm and classification model is proposed. Second, by selecting critical variables that significantly affects the crashes
Fig. 4 Transferability comparisons of the different models
Prediction with the RF model, the relationship of crash and traffic states can be understood. A dataset of 577 crashes and 5794non-crashes combined with the corresponding traffic data 5– 10min before the crashes (non-crashes) are collected on two expressways in Shanghai, while the hybrid model is cross-validated with data collected on the Yan-an expressway, and the transferability of the model is examined with data collected on the North–South expressway. The detailed results are as follows:
to handle unbalanced crash and non-crash data.
(ii) The results indicate that both the balanced classification ability and the crash prediction ability of the hybrid crash prediction model get promoted with a classification accuracy of crashes of 78.0% at best. The false alarm rate of the hybrid model also decreases to some extent. (iii) The RF model is developed to select the four most important variables for the establishment of the crash prediction model. The results show that the ability of the model to predict crashes is enhanced to some degree, with lower over-fitting.