Correlations of Biomechanical Characteristics with Ball Speed in Penalty Corner Push-In
Measuring Library and Information Science Research in India: A Study
Duraipandi, R.
Research Scholar, Department of Library and Information Science, Bharathidasan University, Tiruchirappalli, Tamil Nadu, India.
Received 30th June 2014, Accepted 30th July 2014
Abstract
Programme of Research in Ph.D. level in Library and Information Science carried out in India during the eleven years (2002-2012) have been analyzed to find out the trends and areas of research, growth pattern and productivity of universities and states along with broad and narrow subject areas in the discipline in PhD Library and Information Science. Presents study analysis that the primary goal of appraising the perspective LIS research community to make them aware of the direction path of research. In total 344 doctoral degree awarded during the period of 2002 – 2012, highest number of doctoral degree awarded in the year of 2002 with 47(14%). Totally 50universities contributed to produce 344 PhDs during 2002-201 2in India. Among these universities, Andhra University produced highest number. Most of the research scholars done their research, based on academic/ public/special library. South Indian states universities produced more research output than Compared with north Indian states.
Keywords: Research in Library and Information Science; Dissertations; LIS research; Indian Universities; LIS Education.
© Copy Right, IJRRAS, 2014. All Rights Reserved.
Introduction
Indian universities play a major role in creation and dissemination of knowledge by providing opportunities for research scholars to conduct research studies and to bring out doctoral dissertations. Delhi University instituted the doctoral degree programme leading to PhD in Library Science in 1951. Dr. D.B. Krishna Rao was the first recipient of PhD in Library Science in India in 1958 from University of Delhi, under the guidance of Prof. S.R. Ranganathan. His topic was “Facet Analysis and Depth Classification”. However, the second PhD degree in Library Science was awarded to Dr.Pandey S.K. Sharma by Punjab University in 1977 only after 19 years. He received the degree under the guidance of Dr. J.S. Sharma. His topic was, “Expansion and Modification of DDC (18) for Classifying Ideological Books with Special Reference to Indian Philosophy and Indian Religion,” with this modest beginning of PhD research, as of now, there are approximately 800+ PhD degree holders in LIS in India. It is an accepted fact that at any given point, the major objectives of the academic work in a university are teaching, research, and publications; the research being the core function. Apart from PhD, the components of research at elementary level are also covered through the following ways:
Correspondence
MPhil course.
MLIS projects/dissertations.
Individual or team research projects sponsored by UGC, ICSSR, DST, MHRD.
Self-supported research..
The paper is designed to reflect the Ph.D. works in LIS in India during a period of eleven years, from 2002- 2012.
Objectives of the Study
The study was designed with the following objectives:
To determine the growth and research productivity at doctoral level by Library and information science in India from 2002 – 2012;
To identify and explore that how many universities in India are providing doctoral Research in the field of library and information science;
To know the origin and growth of doctoral programme in LIS in India;
to understand the contribution by individual universities, research supervisors Indian states towards LIS Research ;
To identify the important core and allied subject areas in the field of LIS, also identify threshold research in LIS Field;
International
85
Methodology
This study aims to analyze the doctoral dissertations awarded by various universities in India in the field of library and information science during the period 2002- 2012 (11years). The data was collected
from three sources INFLIBNET (online data base), Vidhyanithi (on-line database) Shodganga& shodgangagothiri (online data base), and university news published by AIUA, Delhi (printed Journal).
Data Analysis and Interpretation
Table 1. Year-Wise Distribution of Doctoral Research Outputs
S.No Year No. of Doctoral Research Reports Percentage
1 2002 47 14
2 2003 37 11
3 2004 37 11
4 2005 36 10.46
5 2006 24 7
6 2007 42 12.20
7 2008 20 6
8 2009 25 7.26
9 2010 27 8
10 2011 3 0.9
11 2012 45 13
Total 344 100%
Table I represents that the year wise distribution of theses during the period of 2002 – 2012, which shows that the research productivity differs from year to year. The highest number of thesis produced in the year
of 2002 (47) followed by 2012, 45 doctoral degree had awarded. Lowest numbers of 3 thesis awarded in the year 2011.Equal numbers of 37 theses awarded in the years 2003 and 2004.
.
Graph 1. Year Wise Productivity
0
2
4
6
8
10
12
14
2002
2003
2004
2005
2006
2007
2008
2009
2010
2011
2012
14
11
11
10.46
7
12.2
6
7.26
8
0.9
Table II. Productivity of Research Guides
S/NO Contributions of Research Guides
Output of Doctoral Thesis Total Percentage
1 62 supervisors Single PhD 62 18.0
2 38 supervisors Two PhDs 76 22.1
3 21 supervisors Three PhDs 63 18.32
4 12 supervisors Four PhDs 48 14.0
5 5 supervisors Five PhDs 25 7.26
6 1 supervisor Six PhDs 6 1.74
7 3 supervisors Seven PhDs 21 6.10
8 1 supervisor Eight PhDs 8 2.33
9 1 supervisor Nine PhDs 9 2.62
10 2 supervisors Ten PhDs 20 5.81
Total 344 100
Productivity of Research Supervisors
Research supervisor plays an important role in the productivity of research outputs by individual universities. The dedication of research scholar, proper guidance from research supervisor and the infrastructure facilities provided by universities play an important role in the productivity of research output. Table 2 illustrates the output of research supervisors during 2002 – 2012, the majority of the supervisors (32) supervised for two
research students. followed by62 supervisors contributed only one thesis,21 research supervisors supervised to three students.12 supervisors supervised to four students and five supervisors supervised to five students, one supervisor supervised to 6 students, three supervisors guided for 7 scholars, 1 supervisor guided for 8 scholars, again 1 supervisor guided for 9 scholars. 2 supervisors supervised 10 students respectively.
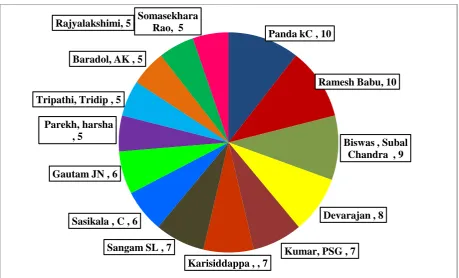
Table III. Prolific Guide
S.No Name of The Guide No of Contribution Rank
1 Panda KC 10 I
2 Ramesh Babu 10 I
3 Biswas , Subal Chandra 9 II
4 Devarajan 8 III
5 Kumar, PSG 7 IV
6 Karisiddappa , 7 IV
7 Sangam SL 7 IV
8 Sasikala , C 6 V
9 Gautam JN 6 V
10 Parekh, harsha 5 VI
11 Tripathi, Tridip 5 VI
12 Baradol, AK 5 VI
13 Rajyalakshimi, 5 VI
14 SomasekharaRao, 5 VI
Rank list
Rank list has given for highly supervised guide. This table shows that the maximum number of thesis have been submitted under the guide ship of Panda KC and Ramesh Babu secured I Rank for their supervision
87
Graph II. Rank and Score of the Research Supervisors
Table IV. Contributions of Co-Guide
S.No Year
No. of Co-Giude
1 2002 7
2 2003 4
3 2004 3
4 2005 2
5 2006 -
6 2007 -
7 2008 -
8 2009 1
9 2010 -
10 2011
11 2012 1
Total no. of Co-Guides
18
The above table shows that the contributions of the co guide or co- research supervisor during 2002 – 2012in the field of library and information science in India. Year by year the co guide contributions were minimized. In the eleven years only 18 research scholar
chosen co guide for their research out of 344 research scholars. From this table it is shows that the majority of research scholars are willing to do their PhD under single supervisor.
Panda kC , 10
Ramesh Babu, 10
Biswas , Subal Chandra , 9
Devarajan , 8
Kumar, PSG , 7 Karisiddappa , , 7
Sangam SL , 7 Sasikala , C , 6
Gautam JN , 6
Parekh, harsha , 5
Tripathi, Tridip , 5 Baradol, AK , 5
Table V. Research Productivity of Universities
Number of University No of PhD Awarded
Total
1 20 20
1 19 19
1 18 18
2 17 34
1 16 16
1 13 13
5 12 60
1 11 11
2 10 20
5 8 40
4 6 24
6 5 30
2 4 8
4 3 12
5 2 10
9 1 9
50 344
Table VI. Name of the Universities
S/NO Name of the University NO. of
Contribution
1 Andhra University 20
2 Sambalpur University 19
3 University of Calicut 18
4 University of Burdwan 17
5 Karnatak University 17
6 University of Pune 16
7 Mangalore University 13
8 University of Madras 12
9 University of Kerala 12
10 Punjabi University 12
11 Jiwaji University 12
12 University of Calcutta 12
13 Guru Ghasidas University 11
14 Dr.BabasahebAmbedkarMarathwada University 10
15 University of Delhi 10
16 Shillong. North Eastern Hill University 8
17 Ujjain. Vikram University 8
18 Imphal. Manipur University. 8
19 Hyderabad. Osmania University 8
20 Bangalore University. 8
21 RashtrasantTukadojiMaharaj Nagpur University 6
22 Panjab University 6
23 SantGadge Baba Amravati University 6
24 ShreematiNathibaiDamodarThackersey Women's University 6
25 Aligarh Muslim University 5
26 Gulbarga University 5
27 Kota. VardhamanMahaveer Open University 5
89
32 Gauhati University 4
33 Dr.HarisinghGourVishwavidyalaya 3
34 Anna University 3
35 Kurukshetra University 3
36 University of Lucknow 3
37 Mizoram University 2
38 Saurashtra University 2
39 Shankaraghatta. Kuvempu University 2
40 Guru Nanak Dev University 2
41 Sri Krishnadevaraya University 2
42 Utkal University 1
43 MohanlalSukhadia University 1
44 Annamalai University 1
45 University of Mysore 1
46 Pt. Sundarlal Sharma Open University 1
47 University of Kashmir 1
48 Dr.B.R. Ambedkar Open University 1
49 Kannur University 1
50 KrantiguruShyamjiKrushnVarmaKachchh University 1
Graph III. Ranking and Distribution of Research Reports (15 High Performed Universities)
Table VI depicts the university-wise research output in the form of Ph.D theses. Among 50 Indian universities, considering the number of doctoral degrees, Andhra University stands first with 20 Ph.D theses, next to Andhra University; Sambalpur University with theses occupies the second place. Single PhDs has produced by
9 universities among 50 universities. The table VII indicates that highly performing universities.Among 50 universities more than 10 PhDs produced by 15 universities. Andhra University, Sambalpur University, University of Calicut secured I, II and III places with 20, 19 and 18 PhDs.
And
h
ra
Uni
ve
rsity
S
am
b
alp
u
r …
Uni
ve
rsity
of
…
Uni
ve
rsity of
…
K
ar
n
at
ak
…
Uni
ve
rsity
of
P
u
n
e
M
an
galor
e
…
Uni
ve
rsity of
…
P
u
n
jabi
Uni
ve
rsity
Jiw
aj
i
Uni
ve
rsity
U
ni
ve
rsity
of
…
G
u
ru
G
h
asid
as
…
Dr
.B
ab
asah
eb
…
Uni
ve
rsity
of
De
lh
i
20 19 18 17 17
16
13 12 12 12 12
12 11 10
10
Table VII. Specialized Area Distribution of Doctoral Research
S/No Subject
No of Research
Output
Total
1 Academic /public// special Library 62 18.02
2 Information need and seeking behavior 39 11.33
3 Information communication and technology 36 10.47
4 Information source and services 35 10.18
5 Electronic / digital Library/ library automation 30 8.72
6 Bibiliometric study/ citation analysis/
Scientometric study 30 8.72
7 Library profession 26 8.00
8 User studies 24 7.00
9 Library and management 22 6.4
10 Growth and development of library 22 6.4
11 LIS education 18 5.24
The table VII shows that majority of the contributions appeared under Academic /public/ special Library 62 (18.02%). The next position is taken by Information needs and seeking behaviour 39 (11.33%). This is followed by ICT 36 (10.47%) and Information source and services 35 (10.18%) further followed by
“Electronic / digital Library/ library automation” and “Bibiliometric study/ citation analysis/ Scientometric study” 30 (18.72%), Library profession 26 (8%), User studies 24 (7%), “Library and management” and “Growth and development of library” 22 (6.4%), LIS Education 18 (5.24%) respectively.
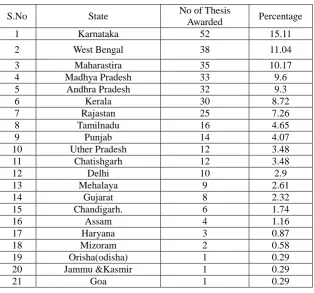
Table VIII. State Wise Productivity of Doctoral Research InLIS
S.No State No of Thesis
Awarded Percentage
1 Karnataka 52 15.11
2 West Bengal 38 11.04
3 Maharastira 35 10.17
4 Madhya Pradesh 33 9.6
5 Andhra Pradesh 32 9.3
6 Kerala 30 8.72
7 Rajastan 25 7.26
8 Tamilnadu 16 4.65
9 Punjab 14 4.07
10 Uther Pradesh 12 3.48
11 Chatishgarh 12 3.48
12 Delhi 10 2.9
13 Mehalaya 9 2.61
14 Gujarat 8 2.32
15 Chandigarh. 6 1.74
16 Assam 4 1.16
17 Haryana 3 0.87
18 Mizoram 2 0.58
19 Orisha(odisha) 1 0.29
20 Jammu &Kasmir 1 0.29
91
Graph IV. State Wise Productivity
Out of 28 states in India, it is pleasing to note that 2/3rd of them have LIS research programs in the universities located in their state. Among the states, Karnataka has produced maximum number of PhDs 52(14%), followed by Westbengal 38 (9.9%),Maharastira35 (9.9%), Madhya Pradesh 33 (9.6%),Andhra Pradesh 32 (9.3%), Kerala 30
(8.72%),Rajastan 25 (7.26%),Tamilnadu 16 (4.65%), Punjab 14 (4.07%),Uther Pradesh 12 (3.48%), Chatishgarh 12 (3.48%), Delhi 10( 2.9%)Mehalaya 9 (2.61%), Gujarat 8(2.32%), Chandigarh 6 (1.74%),Assam4 (1.16%). Haryana3 (0.87%) ,Mizoram 2 (0.58%) , The Lowest number of one PhD (0.29%) contributed by Odisha, Jammu &Kasmir and Goa.
Table IX. Regional Wise Productivity
Region Contribution
South India 130
North India 116
West India 44
East India 39
North east India 15
52 38
35 33 32 30 25 16 14 12 12 10 9 8 6 4 3 2 1 1 1
Karnataka
Maharastira
Andhra Pradesh
Rajastan
Punjab
Chatishgarh
Mehalaya
Chandigarh.
Haryana
Odisha
Goa
0 10 20 30 40 50 60
Graph V. Regional Productivity
From the Table 2 find out that majority of the PhD thesis awarded in southern region of India with 130 contributions and this is followed by northern region of India with116, western Region with 44, eastern region 39 and north east India with 15 contributions.
Finding and Conclusion
The present paper has undertaken to find out the development of LIS research at doctoral level for the last eleven years period 2002 to 2012. It is identified that the highest of theses i.e., forty seven (47) has been produced in the year 2002, the lowest being in the year 2011. 'Library study' appears to be the only broad subject area which has attracted the attention of professionals in which highest number of Ph.D works have been done followed by Information seeking behavior. Among 50 universities the Andhra University produced 20 PhDs and has been in first place. The universities in the State of Karnataka have awarded highest number of Ph.Ds in LIS. Similarly and obviously the Southern Region in India has the highest number of doctoral research works produced during the period. In respect to guideship pattern, maximum number of guides has produced two PhDs.
References
1. University News, Association of Indian Universities, New Delhi. Back Issues : 2002- 2012 2. Inflibnet website. http://www.inflibnet.ac.in 3. Kannappanavar (8 U) and Vijaykumar (M). Fifty
Years of LIS Research in India: Trends and Developments. SRELS Journal of Information Management.37,4;2000;267 -300
4. Lahiri, Ramansu. 1996. “Research in library science in India (1950–95): an account of Ph.D.
Journal of Library & Information Science, 8 (2) (2003) 1-17.