JIEM, 2016 – 9(3): 684-707 – Online ISSN: 2013-0953 – Print ISSN: 2013-8423 http://dx.doi.org/10.3926/jiem.1869
IT Integration, Operations Flexibility and Performance:
An Empirical Study
María Esther Caracuel Martínez , Daniel Arias Aranda , Leopoldo Gutiérrez Gutiérrez
Universidad de Granada (Spain)
[email protected], [email protected], [email protected]
Received: January 2016
Accepted: July 2016
Abstract:
Purpose: This study examines the relationship between IT implementation and performance with manufacturing flexibility based on a sample drawn from a set of manufacturing firms.
Design/methodology/approach: The relationships were analyzed using structural equations modelling (SEM) using EQS 6.2 software. Previously, an explanatory factor analysis confirmed one-dimensionality of the scales, Cronbach’s alpha was calculated to evaluate its internal consistency and a confirmatory factor analysis was run to observe scales’ validity.
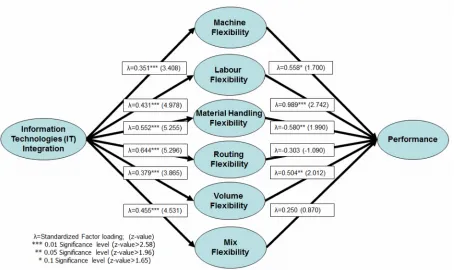
Findings: This research proves a significant positive and direct effect of IT implementation on operations performance with 4 out of 6 flexibility dimensions (Machine, Labour, Material handling and Volume). Mix and Routing flexibility dimensions show no significant impact on firm performance.
Research limitations/implications: It is necessary to be cautious when generalizing this findings these findings, as service firms were not part of the sample even when statistical results prove robustness suggesting that the findings are quite reliable. Some flexibility dimensions show no significant impact in performance (Routing and Mix flexibility). This is consistent with the fact that these flexibility dimensions act as variability absorbers within the manufacturing process.
Originality/value: This research proves a significant positive and direct effect of IT implementation on operations performance. Results show not only the links between IT implementation and operations performance, but also the magnitude of every impact. The model considers IT integration as the degree of alignment that existing technology resources in a firm have with the business strategy, in terms of importance and support for this strategy.
Keywords: IT integration, manufacturing flexibility, performance, strategy, complementarity perspective
1. Introduction
This study examines the relationship between IT implementation and performance with manufacturing flexibility. IT implementation is a costly investment for firms which could lead to support the development of manufacturing flexibility and to obtain higher levels of performance (Giménez, Van der Vaart & van Donk, 2012). IT integration and flexibility have been considered as antecedents for achieving agility in the supply chain in previous studies (Swafford, Ghosh & Murthy, 2008). It is essential to develop in greater depth the idea that supply chain can involve multiple organizations with cross effects in performance. Internal integration can improve the different dimensions of flexibility and, as a result, improve internal efficiency, increasing performance for the supply chain. Based on these considerations, our conceptual model does not attribute direct impact on performance to IT per se but instead views it as adding competitive value to operating performance with the action of flexibility. From an academic perspective, this study provides an analysis of operating flexibility from a perspective of complementarity among organizational resources to increase performance.
This paper is structured as follows. In the next section, the theoretical basis of IT, manufacturing flexibility and performance is presented as well as an analysis of the linkages among them from the perspective of the complementarity approach (Milgrom & Roberts, 1995) and the Theory of Resources and Capabilities (Nelson & Winter, 1992) to state the hypotheses of the study. The next section presents the research methodology, sample and data collection as well as the measurement of the different variables involved in the study. After that, results will be discussed. In the last section, the implications of the findings, limitations of the study and academic and practitioners implications will be disclosed together with limitations of the study and future lines of research.
2. Theoretical Review and Hypothesis Development
2.1. Integration of Information Technologies into Business Strategy and its Impact on Operating Flexibility
IT integration impact on performance has been analyzed considering different IT dimensions such as investment in IT, adoption of specific information systems, and IT infrastructure (Mitra & Chaya, 1996; Tam, 1998). There are studies that consider management aspects directly affected by IT implementation such as management abilities, employee training or knowledge management (Ranganathan et al., 2004; Bhatt, Grover & Grover, 2005). Recently, practices of integration with “key” customers have received specific attention regarding its high complexity (Giménez et al., 2012).
benefits are strengthened only when synergy with other investments or complementary resources are achieved not only within business processes but also amidst capabilities (Ray, Muhanna & Barney, 2005; Tanriverdi, 2006; Zhu, 2002). In terms of the strategic goal of the IT integration process, Ranganathan et al. (2004) findings support the fact that IT implementation ameliorates the firm’s internal operations (e-business intranets) while improving supply chain even in e-(e-business extranets. In both cases, there are cross effects from internal and external outcomes (Melville, Kraemer & Gurbaxani, 2004; Zhang & Dhaliwal, 2009). Some of these internal outcomes are related to organizational issues for internal diffusion of IT such as formalization of IT deployment, knowledge management as well as integration of manager’s abilities (Barney, 1991; Swanson, 1994). External outcomes are more related to technological issues for IT external diffusion among suppliers, customers, partners, etc (Chwelos, Benbasar & Dexter, 2001). The intensity of the interdependence of the firm with its suppliers, customers or partners will shape the intensity with which they deploy ITs in the supply chain (Zhu, Kraemer & Xu, 2006). Hence, the intensity of competence, or the so-called “positive effect of competence” drives other firms to adopt technologies to improve their operating efficiency and coordination with other partners in the supply chain increasing the intensity of IT integration deployed throughout the supply chain (Zhu et al., 2006).
Operations flexibility as competitive priority has received plenty of attention from the academic community in the last decades for manufacturing as well as service industries. Despite there has been a clear evolution in the concept still no clear consensus about the definition of flexibility has been settled (see among others Baykasoglu & Özbakir, 2008; Beach, Muhlemann, Price, Paterson & Sharp, 2000; Francas, Kremer, Minner & Friese, 2009; Koste & Malhotra, 1999; Mihi-Ramírez, García-Morales, Arias-Aranda, 2012; Oke, 2005; Prahalad & Hamel, 1990; Sethi & Sethi, 1990; Teece, Pisano & Shuen, 1997; De Toni & Tonchia, 1998; Upton, 1997; Vokurka & O’Leary-Kelli, 2000). Notwithstanding, all studies agree that flexible organizations are those which have developed the ability to generate new products rapidly and often that are able to vary production volume without incurring into higher costs, time, or performance. Therefore, operations flexibility allows firms to respond to threats from competitors and fulfil customer’s expectations in time and place (Swafford et al., 2008; Upton, 1997; Zhang, Vonderembse & Lim, 2003).
This relationship is reinforced when operations and other functional processes are previously integrated such like inventory management, new product development and even interfunctional relations (Das, Narasimham & Talluri, 2006) which drives the firm towards optimizing the IT adoption and implementation process (Zhang, Vonderembse & Cao, 2006). Consequently, integration of IT in the business strategy for decision making and improvement in internal efficiency involves higher flexibility due to an increased real time control and effectiveness in decision making regarding production planning and programming among others (Jin, Vonderembse, Ragu-Nathan & Smith, 2014).
Gerwin (1993) identifies 7 dimensions of manufacturing flexibility accordingly to different types of uncertainty and strategic goals. These dimensions help operations managers to prioritize which dimension(s) of flexibility must be strengthened according to achieve every strategic goal. Table 1 shows how the initial four dimensions of flexibility are associated with market-oriented uncertainties, particularly those related to products demand. The next three dimensions are more related to uncertainties regarding manufacturing processes (see Table 1).
Dimension of Flexibility Type of Uncertainty Strategic Goal
Mix flexibility Market acceptance of different types ofproducts Diverse product line
Product innovation flexibility Length of product life cycle Product innovation Product modification flexibility Specific characteristics of the product Response to customer expectations
Volume flexibility Aggregate product demand Market share Process routing flexibility Inactive machines Customer due date
Material flexibility Characteristics of materials Product quality Response flexibility Changes in the uncertainties mentioned Strategic adaptability
Table 1. Manufacturing flexibility dimensions (Gerwin, 1993)
Information Technology implementation in the supply chain plays a crucial and strategic role in collaborative partnering as it enables integration of the information for improvements in products, quality, and flow of materials among others. It also leads to optimization of space availability, teamwork, improved productivity, and increased product and process flexibility (Stevenson & Spring, 2007; Soroor et al., 2009). Most of these benefits are derived from adjustability in manufacturing programming, provision of materials, and planning of delivery deadlines (Jin et al., 2014).
and deadlines agreed upon. To fulfil this multidisciplinary effort, the firm must assume a level of uncertainty derived from its internal (mistakes, delays, defective materials, etc.) as well as external environment (demand and/or supply variability), which can have a direct impact on the flexibility level of the entire production system. It is important to consider the multiple relationships of interdependence both within and outside the firm, as uncertainties have the potential to expand throughout the chain (De Toni & Tonchia, 2005; Handfield & Nichols, 2002; Sawhney, 2006).
Firms can thus face uncertainty and variability based on the strategic orientation of flexibility:
• Reactive orientation: in this case, developing flexibility involves the ability to fit production to market demand with the least time and cost (Beach et al., 2000; Collins, Cordon & Julien, 1998; Gerwin, 1993; Gupta & Somers, 1996; Iravani, Van Oyen & Sims, 2005; Mackenzie, 1998; Milliken, 1987; Schmenner & Tatikonda, 2005; Swamidas & Newell, 1987).
• Proactive orientation: flexibility seeks to generate competitive advantages by developing abilities that enable the firm to focus products to a market niche, adapt the product to the consumers requirements, or increasing innovativeness (Bolwijn & Kumpe, 1990; Sawhney, 2006).
Stevenson and Spring (2007) structure 21 dimensions of flexibility in a hierarchy with 4 levels: operations, tactical, strategic, and supply chain levels. The first three levels are bound to manufacturing flexibility while supply chain covers a wider aspect of flexibility. From these dimensions, Zhang et al. (2003) consider machine, labor, routing, and material handling flexibility (operations flexibility) as competences and mix and volume flexibility as capabilities (tactical flexibility). For these authors, the competences impact performance through flexibility as shown in Table 2. From the perspective of competitiveness, volume and mix flexibility are considered crucial as capabilities referred to short term reaction to variability in order volumes while the rest of the dimensions are more related to long term counteraction as they generate abilities for adapting resources that previously required high levels of financial compromise (Cox, 1989; New, 1996; Oke, 2003; Zhang et al., 2003).
Competences
• Machine flexibility: ability of a part of the team to perform different operations efficiently and economically.
• Labor flexibility: ability of labour to perform a wide range of functions efficiently and economically.
• Material handling flexibility: ability to transport different parts among various work centers through multiple routes efficiently and economically.
• Routing flexibility: ability to process a set of parts using multiple routes efficiently and effectively.
Capabilities
• Product modification flexibility
• Mix flexibility: ability to handle a wide range of products efficiently and economically, given a certain volume.
• Volume flexibility: ability to increase or decrease the aggregate production level
Flexibility as a competitive priority concerns operations strategy processes to build capabilities for anticipating the firm’s current needs (Hayes & Wheelwright, 1984; Urgal-González & García-Vázquez, 2007) through the practice known as production proactivity (Ward, Leong & Boyer, 1994; Chang, Lin, Chen & Huang, 2005). This practice generates commitment to continuous technological advances, development of multidisciplinary teams, and integration of production into the functions of marketing and design. Operations, machinery, process routes, tasks, product, work, material, program, and expansion of production influence as well the generation of new strategic capabilities. Managers need to find the right mix in the operations flexibility dimensions according to the strategic goals. Chang et al. (2005) found that dimensions that affect internal efficiency, such as Flexibility of Machines, Flexibility of Components, Flexibility of Material, or Routing Flexibility affect positively efficiency in fulfilling customers demand, while dimensions such as mix and volume flexibility have a positive impact when dealing with uncertainties in the environment and demand variations (Chang et al., 2005). Hence, from the strategic point of view, the flexibility dimensions have a direct impact on operational performance (Bustinza-Sánchez, Molina-Fernandez & Arias-Aranda, 2010).
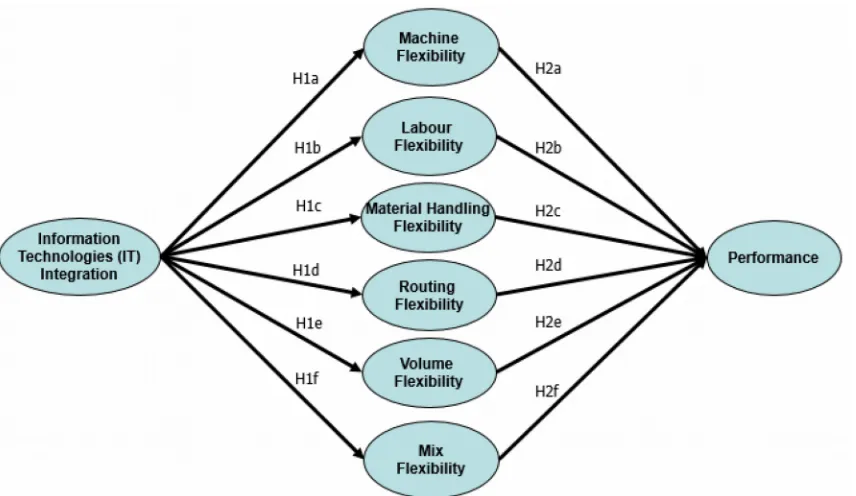
Based on the foregoing theoretical review and following the framework provided by Zhang et al. (2003) of flexible manufacturing competencies and capabilities the present study intends to analyze the distinct relationships between It integration, the different dimensions of flexibility and performance to establish the following hypothesis:
H1a. An increase in the degree of IT integration increases machine flexibility.
H1b. An increase in the degree of IT integration increases labour flexibility.
H1c. An increase in the degree of IT integration increases material handling flexibility.
H1d. An increase in the degree of IT integration increases routing flexibility.
H1e. An increase in the degree of IT integration increases volume flexibility.
H1f. An increase in the degree of IT integration increases material mix flexibility.
This hypothesis is subdivided in 12 sub-hypotheses, one for every relationship between the main constructs and the different dimensions of operations flexibility as shown is Figure 1.
H2a. Machine flexibility is positively related to performance.
H2b. Labour flexibility is positively related to performance.
H2c. Material handling flexibility is positively related to performance.
H2d. Routing flexibility is positively related to performance.
H2e. Volume flexibility is positively related to performance.
Figure 1. Conceptual Model
3. Methodology
3.1. Data Samples and Scales
This study is based on a sample drawn from a set of manufacturing firms from the SABI database. The data collection process was based entirely on a telephone survey. A pilot test with ten firms was performed in the initial questionnaire in order to ensure a clear understanding of the questions and items included. During the next stage, production, quality and operations managers were interviewed and informed about the research. 1,032 firms were contacted obtaining 201 valid surveys with a response rate of 19.47 per cent, and an estimated sampling error of 5.47 per cent. Next we analyze the possible non-respondent bias. For this purpose, we run t-tests to observe the difference between early and late respondents in the variables sales volume, number of employees and industry. Results did not indicate any significant difference between both groups. Thus, both groups of respondents do not introduce significant bias into the results of this research. Finally, we also analyze the common method variance (CMV). For this purpose, we performed a confirmatory factor analysis (CFA) to Harman’s one factor test (Podsakoff, Mackenzie, Lee & Podsakoff, 2003). If all the items are significantly related to a unique factor, CMV represents a problem. Our results show that a one-factor model has a poor fit with the data (RMSEA = 0.144; CFI = 0.393; NFI = 0.401) and consequently CMV is not a problem for our analyses.
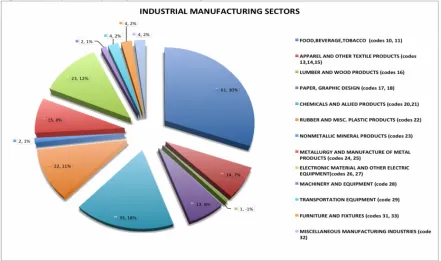
rest 24.38 per cent reported revenues over 10 million Euros. Regarding the number of employees 73.13 per cent reported fewer than 50 employees, 19.40 per cent reported 51 to 250 employees, and 7.46 per cent reported 251 or more employees as shown in Table 3. The firms in the sample perform activities in different sectors such as agri-food manufacturing (fruit, vegetables, meat, etc.); technology components manufacturing (electronic, computers); and textile and footwear manufacturing (CNAE code 2009: 10 – food industry, 11 – Beverage manufacturing, 13 – Textile industry, 14 – Apparel manufacturing, 15 – Leather and footwear industry) (see Figure 2).
Revenues (Million Euros)
< 2 2-10 > 10 Total
Employees
< 50 22.39% 43..78% 6.97% 73.13%
50-250 1.99% 6.97% 10.45% 19.40%
> 250 0.00% 0.50% 6.97% 7.46%
Total 24.38% 51.24% 24.38% 100%
Table 3. Sample description (Revenue and Employees)
Figure 2. Sample description (industrial sectors)
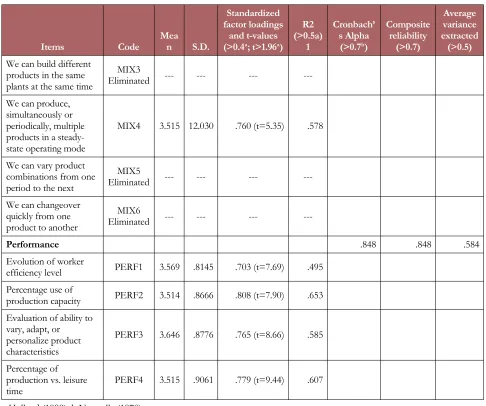
included in this study focus specifically on analyzing two strategic dimensions of IT: aggressive and defensive IT orientation within the business strategy. The different items of the questionnaire evaluate the degree of agreement with the integration of existing IT in the firm according to such strategic dimensions. For measuring operations flexibility, the scales validated by Zhang et al. (2003) regarding flexibility competences were used. The study considers the dimensions of machine, labour, material handling, routing, volume and mix flexibility (Tu, Vonderembse, Ragu-Nathan & Sharkey, 2006; Zhang et al., 2006; Charles, Lauras & Van Wassenhove, 2010). Operations performance has been measured adapting the scales of Abernethy and Lillis (1995). Different measurements of performance have been included in the research based on efficiency of the system as well as customer satisfaction by benchmarking firms performance with competitors. All items shown in Table 5 are measured through a 7-point Likert scale, in which 1 indicates completely disagreeand 7 completely agree on every statement.
4. Results
4.1. Scale Validation Process
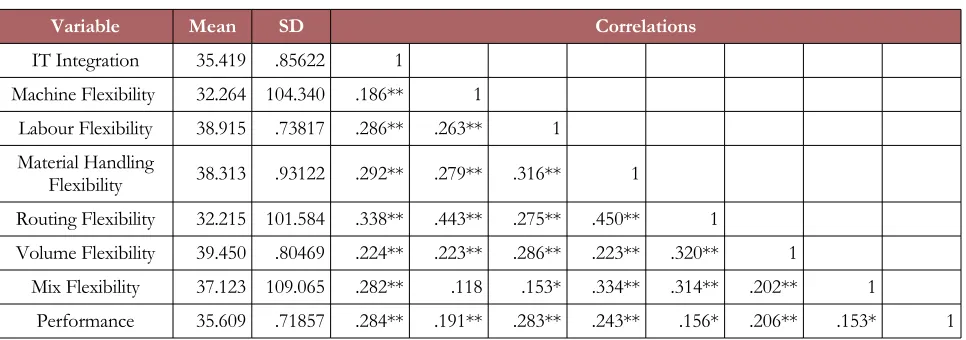
Prior to confirming empirically the validity of the hypotheses and the scales validation, we include the descriptive statistics of observed variables (see table 4). . Next, the validation process was divided into two stages. First, we performed an explanatory factor analysis that enabled us to confirm the one-dimensionality of each scale. Second, we observed the scales’ internal consistency by calculating the Cronbach’s Alpha. In all cases, the resulting scales showed values higher than the recommended minimum of 0.7 (Nunnally & Bernstein, 1978), guaranteeing internal consistency (see Table 5). To calculate one-dimensionality and internal consistency, we used SPSS 22.0 software.
Variable Mean SD Correlations
IT Integration 35.419 .85622 1
Machine Flexibility 32.264 104.340 .186** 1
Labour Flexibility 38.915 .73817 .286** .263** 1 Material Handling
Flexibility 38.313 .93122 .292** .279** .316** 1
Routing Flexibility 32.215 101.584 .338** .443** .275** .450** 1
Volume Flexibility 39.450 .80469 .224** .223** .286** .223** .320** 1
Mix Flexibility 37.123 109.065 .282** .118 .153* .334** .314** .202** 1
Performance 35.609 .71857 .284** .191** .283** .243** .156* .206** .153* 1
* Correlation is significant at the 0.05 level; ** Correlation is significant at the 0.01 level.
Table 4. Descriptive statistics and reliability analysis
Items Code Mean S.D.
Standardized factor loadings
and t-values (>0.4a; t>1.96a)
R2 (>0.5a)
1
Cronbach’ s Alpha (>0.7b)
Composite reliability (>0.7) Average variance extracted (>0.5) Information Technology
Integration .898 .900 .584
The IT’s we use help us to be or become one of the leading firms in our market.
ITI1 3.335 .9914 .660 (t=10.03) .436
The IT’s we use help us to be on the cutting edge with respect to our competition.
ITI2 3.48 10.294 .718 (t=11.42) .516
The IT’s we use help us
to achieve market share. EliminatedITI3 --- --- --- ---The IT’s we use help us
to develop strong ties to
our main customers. ITI4 3.698 10.581 .839 (t=15.92) .705 The IT’s we use help us
to develop strong ties to
our main suppliers. ITI5 3.678 10.085 .826 (t=14.73) .683 The IT’s we use help us
to connect strongly to
the market in general. ITI6 3.518 .9892 .834 (t=15.30) .696
Machine Flexibility .772 .775 .537
Our machinery can be installed/configured
rapidly. MACH1 3.364 1.311 .683 (t=9.49) .466 Any machine can
perform different types of operations.
MACH2
Eliminated --- --- ---
---Any machine can use different devices effectively.
MACH3
---Items Code Mean S.D.
Standardized factor loadings
and t-values (>0.4a; t>1.96a)
R2 (>0.5a)
1
Cronbach’ s Alpha (>0.7b)
Composite reliability (>0.7) Average variance extracted (>0.5)
Our machines often become obsolete when new operations are introduced in the firm.
MACH4
Eliminated --- --- ---
---The devices on our machines can be
changed rapidly. MACH5 3.095 12.108 .682 (t=9.03) .464 It is easy to
install/configure our
machinery. MACH6 3.22 12.536 .826 (t=9.18) .683
Labor Flexibility .843 .845 .579
Our workers can perform different types
of operations efficiently. LAB1 3.98 .8483 .712 (t=8.57) .507 Any worker is able to
work efficiently with
different devices. LAB2 3.731 .9314 .701 (t=10.06) .491 Our polyvalent
workers(qualified in various fields) can perform a large number of tasks in the firm efficiently.
LAB3 3.98 .8829 .868 (t=12.35) .753
Our workers can/are trained to work various
types of machines. LAB4 3.874 .9161 .752 (t=9.83) .565 Our workers can easily
be transferred to other departments or units in the same firm.
LAB5
Eliminated --- --- ---
---Material Handling
Flexibility .867 .868 .688
Our material handling system enables us to manipulate, move, and/or transport different kinds of components.
MAT1 3.874 10.195 .843 (t=12.48) .711
Our material handling system can work in different processing areas.
MAT2 3.821 10.361 .775 (t=9.98) .600
Our material handling system can move different kinds of components through our factory installations.
MAT3 3.799 10.862 .868 (t=14.02) .753
Our material handling system enables us to exchange/replace components rapidly.
MAT4
---Items Code Mean S.D.
Standardized factor loadings
and t-values (>0.4a; t>1.96a)
R2 (>0.5a)
1
Cronbach’ s Alpha (>0.7b)
Composite reliability (>0.7) Average variance extracted (>0.5)
The devices we use for material handling can be changed or replaced rapidly.
MAT5
Eliminated --- --- ---
---Routing Flexibility .825 .828 .618
A typical part operation can be routed to different machines
ROUT1
Eliminated --- --- ---
---A typical part can use
many different routes EliminatedROUT2 --- --- --- ---The system has
alternative routes in case
machines break down ROUT3 3.342 11.535 .682 (t=8.25) .466 The operating sequence
through which the parts
flow can be changed ROUT4 3.091 12.132 .839 (t=12.54) .703 Machine visitation
sequence can be changed or replaced quickly
ROUT5
Eliminated --- --- ---
---Route changeovers are
easy ROUT6 3.231 11.734 .828 (t=13.78) .686
Volume Flexibility .884 .885 .719
We can function efficiently at different production levels.
VOL1
Eliminated --- --- ---
---We can work profitably with different
production volumes.
VOL2
Eliminated --- --- ---
---We can produce different lot sizes efficiently.
VOL3
Eliminated --- --- ---
---We can change our production volume
rapidly. VOL4 3.96 .8593 .800 (t=12.17) .640 We can change total
production from one
period to another. VOL5 3.975 .9189 .893 (t=17.37) .797 We can easily change
the production volume of a manufacturing process.
VOL6 3.9 .9 .850 (t=15.22) .722
Mix Flexibility .883 .885 .721
We can produce a wide variety of products in
our plants MIX1 3.831 12.733 .895 (t=7.30) .802 We can produce
different product types without major changeover
Items Code Mean S.D.
Standardized factor loadings
and t-values (>0.4a; t>1.96a)
R2 (>0.5a)
1
Cronbach’ s Alpha (>0.7b)
Composite reliability (>0.7) Average variance extracted (>0.5)
We can build different products in the same plants at the same time
MIX3
Eliminated --- --- ---
---We can produce, simultaneously or periodically, multiple products in a steady-state operating mode
MIX4 3.515 12.030 .760 (t=5.35) .578
We can vary product combinations from one period to the next
MIX5
Eliminated --- --- ---
---We can changeover quickly from one product to another
MIX6
Eliminated --- --- ---
---Performance .848 .848 .584
Evolution of worker
efficiency level PERF1 3.569 .8145 .703 (t=7.69) .495 Percentage use of
production capacity PERF2 3.514 .8666 .808 (t=7.90) .653 Evaluation of ability to
vary, adapt, or personalize product characteristics
PERF3 3.646 .8776 .765 (t=8.66) .585
Percentage of production vs. leisure
time PERF4 3.515 .9061 .779 (t=9.44) .607
a Hulland (1999); b Nunnally (1978)
Table 5. Scale items and validation
4.2. Structural Equations Model (SEM)
indexes show values above the recommended minimums, indicating that the model shows good fit for interpretation.
Figure 3. Relationships of the model
Fit Index Model Acceptance levels
Chi-square 569.966
Degrees of freedom 328
Normed Chi-square χ2 / df 1.737 <3.0b
Root Mean Square Error of
Approximation (RMSEA) .061 <0.08
b
Comparative Fit Index (CFI) .919 >0.9c
Bollen’s Fit Index (IFI) .920 >0.9c
GFI Fit Index .831 >0.5 c
AGFI Fit Index .791 >0.5c
az-values greater than 1.96 are significant at p < 0.05; z-values greater than 2.58 are significant at p < 0.01. bHair, Tatham,, Anderson and Black (2006) and Byrne (1998); cByrne (1998).
5. Conclusions, Limitations and Future Lines of Research
The main goal of this study is to develop a deeper understanding of the relationship between IT integration and performance through operations flexibility beyond those suggested by previous studies. Results prove a complex set of relationships in manufacturing firms which provides important implications for academics and managerial practice. First, based on the different dimensions of operations flexibility, this study uncovers how IT implementation impacts operational performance. This finding opens new research opportunities to analyze such impact to different environmental conditions. In future studies, additional perspectives under a contingency analysis can even clarify possible hidden aspects in this relationship. At this point, practitioners can have a better understanding on how IT implementation affects the different dimensions that configure the operations flexibility.
Second, a model of analysis of the relationships among IT implementation, flexibility and performance has been developed based on the classical manufacturing flexibility frameworks. This research analyzes these critical constructs though the use of empirical methods within a field-based setting. Some flexibility dimensions show no significant impact in performance (routing and mix flexibility). This is consistent with the fact that these flexibility dimensions act as variability absorbers within the manufacturing process. Routing flexibility is a competence that decreases the job flow pattern from a random job shop to a flow shop (Hitoshi & Mitsuyoshi, 1999). Hence, when the production system is balanced, the impact of routing flexibility on performance may not be significant when variability is small. Regarding mix flexibility, it involves the capability to adjust quickly to changes in the demand. It affects performance when there is a large need for product variety. Hence, in multisectorial studies, the effect of mix flexibility on performance can be affected according to different product variability levels in different industries. In addition, current flexible technologies decrease the possibilities for mix flexibility improvements on operational performance as found by Karuppan and Kepes (2006). Therefore, future studies can focus on determining further internal and environmental factors that affect operations flexibility according to specific sector characteristics. These findings can improve practitioners decision process when choosing which combinations of flexibility dimensions fit better with strategic priorities, especially when dealing with financial options of IT investments and equipment.
investment, an idea also consistent with Byrd et al. (2006). The strategic role of IT is oriented to improving information flow and real-time coordination with suppliers that facilitates effective planning of production and provision of materials. When integrated into decision making, this information enables a faster evaluation of the firm’s current level of flexibility to prioritize its resources, and identify resources leading to improve operations processes. This information will enable better integration with customers, allowing the firm to optimize deadlines and better adapt products to customer needs. Future sectorial analysis could provide more specific results considering as well service industries.
References
Abernethy, M.A., & Lillis, A.M. (1995). The impact of manufacturing flexibility on management control system design. Accounting, Organizations and Society, 20(4), 241-258. http://dx.doi.org/10.1016/0361-3682(94)E0014-L
Ageron, B., Gunasekaran, A., & Spalanzani, A. (2013). IS/IT as supplier selection criterion for upstream value chain. Industrial Management & Data Systems, 113(3), 443-460.
http://dx.doi.org/10.1108/02635571311312703
Arias-Aranda, D. (2003). Service operations strategy, flexibility and performance in engineering consulting firms. International Journal of Operations & Production Management, 23(11), 1401-1421.
http://dx.doi.org/10.1108/01443570310501907
Avittathur, B., & Swamidass, P. (2007). Matching plant flexibility and supplier flexibility: lessons from small suppliers of US manufacturing plants in India. Journal of Operations Management, 25(3), 717-735. http://dx.doi.org/10.1016/j.jom.2006.05.015
Barney, J. (1991). Firm resources and sustained competitive advantage. Journal of Management, 17(1), 99-120. http://dx.doi.org/10.1177/014920639101700108
Baykasoglu, A., & Özbakir, L. (2008). Analysing the effect of flexibility on manufacturing systems performance. Journal of Manufacturing Technology Management, 19(2), 172-193.
http://dx.doi.org/10.1108/17410380810847909
Bhatt, G.D., Grover, V., & Grover, V. (2005). Types of information technology capabilities and their role in competitive advantage: an empirical study. Journal of Management Information Systems, 22(2), 253-277.
Bolwijn, P.T., & Kumpe, T. (1990). Manufacturing in the 1990s: productivity, flexibility and innovation. Long Range Planning, 23(4), 44-57. http://dx.doi.org/10.1016/0024-6301(90)90151-S
Bustinza-Sánchez, O.F., Molina-Fernández, L.M., & Arias-Aranda, D. (2010). Organizational learning and performance: Relationship between the dynamic and the operational capabilities of the firm. Journal of Business Management, 4(18), 4067-4078.
Byrd, T.A., Lewis, B.R., & Bryan, R.W. (2006). The leveraging influence of strategic alignment on IT investment: an empirical examination. Information & Management, 43(3), 308-321.
http://dx.doi.org/10.1016/j.im.2005.07.002
Byrne, B.M. (1998). Structural Equation Modeling with LISREL, PRELIS, and SIMPLIS: Basis Concepts, Application, and Programming. Mahwah, New Jersey: Lawrence Erlbaum.
Chan, H., & Chan, F. (2009). Effect of information sharing in supply chains with flexibility. International Journal of Production Research, 47(1), 213-232. http://dx.doi.org/10.1080/00207540600767764
Chan, Y.E., Huff, S.L., Barclay, D.W., & Copeland, D.G. (1997). Business strategic orientation, information systems strategic orientation, and strategic alignment. Information Systems Research, 8(2), 125-150. http://dx.doi.org/10.1287/isre.8.2.125
Chang, S., Lin, R., Chen, J., & Huang, L. (2005). Manufacturing flexibility and manufacturing proactiveness: Empirical evidence from the motherboard industry. Industrial Management and Data Systems, 105(8), 1115-1132. http://dx.doi.org/10.1108/02635570510624482
Charles, A., Lauras, M., & Van Wassenhove, L. (2010). A model to define and assess the agility of supply chains: building on humanitarian experience. International Journal of Physical Distribution & Logistics Management, 40(8/9), 722-741. http://dx.doi.org/10.1108/09600031011079355
Chwelos, P., Benbasat, I., & Dexter, A.S. (2001). Research report: empirical test of an EDI adoption model. Information Systems Research, 12(3), 304-321. http://dx.doi.org/10.1287/isre.12.3.304.9708
Collins, R.S., Cordon, C., & Julien, D. (1998). An empirical test of the rigid flexibility model. Journal of Operations Management, 16(2), 133-146. http://dx.doi.org/10.1016/S0272-6963(97)00033-8
Cox, T. (1989). Toward the measurement of manufacturing flexibility. Production and Inventory Management Journal, 30(1), 68-72.
De Toni, A., & Tonchia, S. (1998). Manufacturing flexibility: A literature review. International Journal of Production Research, 36(6), 1587-1617. http://dx.doi.org/10.1080/002075498193183
De Toni, A. & Tonchia, S.(2005). Definitions and linkages between operational and strategic flexibilities. Omega, 33(6), 525-540. http://dx.doi.org/10.1016/j.omega.2004.07.014
Flynn, B.B., Huo, B., & Zhao, X. (2010). The impact of supply chain integration on performance: a contingency and configuration approach. Journal of Operations Management, 28(1), 58-71.
http://dx.doi.org/10.1016/j.jom.2009.06.001
Francas, D., Kremer, M., Minner, S., & Friese, M. (2009). Strategic process flexibility under lifecycle demand. International Journal of Production Economics, 121(2), 427-440.
http://dx.doi.org/10.1016/j.ijpe.2006.12.062
Frohlich, M.T., & Westbrook, R. (2001). Arcs of integration: an international study of supply chain strategies. Journal of Operations Management, 19(2), 185-200. http://dx.doi.org/10.1016/S0272-6963(00)00055-3
Gerwin, D. (1993).Manufacturing flexibility: a strategic perspective. Management Science, 39(4), 395-410. http://dx.doi.org/10.1287/mnsc.39.4.395
Giménez, C., van der Vaart, T., & van Donk, D.P. (2012). Supply chain integration and performance: The moderating effect of supply complexity. International Journal of Operations & Production Management, 32(5), 583-610. http://dx.doi.org/10.1108/01443571211226506
Gupta, Y.P., & Somers, T.M. (1996). Business strategy, manufacturing flexibility, and organizational performance relationships: a path analysis approach. Production and Operations Management, 5(3), 204-233. http://dx.doi.org/10.1111/j.1937-5956.1996.tb00395.x
Hair, J.F. (2010). Multivariate data analysis Pearson College Division.
Hair, J.F., Tatham, R.L., Anderson, R.E., & Black, W. (2006). Multivariate data analysis. Upper Saddle River, NJ.: Pearson Prentice Hall.
Handfield, R.B., & Nichols, E.L. (2002). Supply chain redesign: Transforming supply chains into integrated value systems. FT Press.
Hitt, L.M., & Brynjolfsson, E. (1996). Productivity, business profitability, and consumer surplus: Three different measures of information technology value. MIS Quarterly, 20(2), 121-142. http://dx.doi.org/10.2307/249475
Hitoshi, T., & Mitsuyoshi, H. (1999): A Comparison between machine flexibility and Routing flexibility. International Journal of Flexible manufacturing System, 11(1), 83-101. http://dx.doi.org/10.1023/A:1008096724273
Iravani, S.M., Van Oyen, M.P., & Sims, K.T. (2005). Structural flexibility: a new perspective on the design of manufacturing and service operations. Management Science, 51(2), 151-166. http://dx.doi.org/10.1287/mnsc.1040.0333
Jin, Y., Vonderembse, M., Ragu-Nathan, T., & Smith, J.T. (2014). Exploring relationships among IT-enabled sharing capability, supply chain flexibility, and competitive performance. International Journal of Production Economics, 153, 24-34.
Karuppan, C., & Kepes, S. (2006): The strategic pursuit of mix flexibility through operators’ involvement in decision making. International Journal of Operations and Production Management, 26(9), 1039-1064. http://dx.doi.org/10.1108/01443570610682625
Kim, D., Kumar, V., & Kumar, U. (2012). Relationship between quality management practices and innovation. Journal of Operations Management, 30, 295-315. http://dx.doi.org/10.1016/j.jom.2012.02.003
Koste, L.L., & Malhotra, M.K. (1999). A theoretical framework for analyzing the dimensions of manufacturing flexibility. Journal of Operations Management, 18(1), 75-93. http://dx.doi.org/10.1016/S0272-6963(99)00010-8
Liu, G., Shah, R., & Schroeder, R. G. (2012). The relationships among functional integration, mass customisation, and firm performance. International Journal of Production Research, 50(3), 677-690. http://dx.doi.org/10.1080/00207543.2010.537390
Mackenzie, K.D. (1998). A framework for managing risky situations. International Journal of Organizational Analysis, 6(1), 5-31. http://dx.doi.org/10.1108/eb028876
Markus, M.L., Steinfield, C.W., & Wigand, R.T. (2006). Industry-wide information systems standardization as collective action: the case of the US residential mortgage industry. MIS Quarterly, 30(1), 439-465.
Mihi-Ramírez, A., García-Morales V.J.; Arias-Aranda D. (2012): Knowledge creation and flexibility of distribution of information. Industrial Management & Data Systems, 112(2), 166-185. http://dx.doi.org/10.1108/02635571211204245
Milgrom, P., & Roberts, J. (1995). Complementarities and fit strategy, structure, and organizational change in manufacturing. Journal of Accounting and Economics, 19(2), 179-208. http://dx.doi.org/10.1016/0165-4101(94)00382-F
Milliken, F.J. (1987). Three types of perceived uncertainty about the environment: state, effect, and response uncertainty. Academy of Management Review, 12(1), 133-143.
Mitra, S., & Chaya, A.K. (1996). Analyzing cost-effectiveness of organizations: the impact of information technology spending. Journal of Management Information Systems), 13(2), 29-57.
http://dx.doi.org/10.1080/07421222.1996.11518122
Nelson, R.R., & Winter S.G. (1982). Evolutionary theory of Economic Change. Cambridge, Mass.: Belknap Press.
New, C. (1996). The building blocks of manufacturing excellence. GEC Journal of Research, 13(2), 67-75.
Nunnally, J.C., & Bernstein, I. (1978). Psychometric theory. New York: McGraw-Hill.
Nurmilaakso, J. (2008). Adoption of e-business functions and migration from EDI-based to XML-based e-business frameworks in supply chain integration. International Journal of Production Economics, 113(2), 721-733. http://dx.doi.org/10.1016/j.ijpe.2007.11.001
Oke, A. (2003). Drivers of volume flexibility requirements in manufacturing plants. International Journal of Operations & Production Management, 23(12), 1497-1513. http://dx.doi.org/10.1108/01443570310506731
Oke, A. (2005). A framework for analysing manufacturing flexibility. International Journal of Operations & Production Management, 25(9), 973-996. http://dx.doi.org/10.1108/01443570510619482
Petersen, K.J., Handfield, R.B., & Ragatz, G.L. (2005). Supplier integration into new product development: coordinating product, process and supply chain design. Journal of Operations Management, 23(3), 371-388. http://dx.doi.org/10.1016/j.jom.2004.07.009
Podsakoff, P.M., Mackenzie, S.B., Lee, J.Y., & Podsakoff, N.P. (2003). Common method biases in behavioral research: A critical review of the literature and recommended remedies. Journal of Applied Psychology, 88(5): 879-903. http://dx.doi.org/10.1037/0021-9010.88.5.879
Ranganathan, C., Dhaliwal, J.S., & Teo, T.S. (2004). Assimilation and diffusion of web technologies in supply-chain management: an examination of key drivers and performance impacts. International Journal of Electronic Commerce, 9(1), 127-161.
Ray, G., Muhanna, W.A., & Barney, J.B. (2005). Information technology and the performance of the customer service process: a resource-based analysis. MIS Quarterly, 29(4), 625-652.
Sanders, N.R., & Premus, R. (2002). IT applications in supply chain organizations: a link between competitive priorities and organizational benefits. Journal of Business Logistics, 23(1), 65-83. http://dx.doi.org/10.1002/j.2158-1592.2002.tb00016.x
Sawhney, R. (2006). Interplay between uncertainty and flexibility across the value-chain: towards a transformation model of manufacturing flexibility. Journal of Operations Management, 24(5), 476-493. http://dx.doi.org/10.1016/j.jom.2005.11.008
Schmenner, R.W., & Tatikonda, M.V. (2005). Manufacturing process flexibility revisited. International Journal of Operations & Production Management, 25(12), 1183-1189. http://dx.doi.org/10.1108/01443570510633585
Sethi, A.K., & Sethi, S.P. (1990). Flexibility in manufacturing: a survey. International Journal of Flexible Manufacturing Systems, 2(4), 289-328. http://dx.doi.org/10.1007/BF00186471
Soroor, J., Tarokh, M.J., & Keshtgary, M. (2009). Preventing failure in IT-enabled systems for supply chain management. International Journal of Production Research, 47(23), 6543-6557. http://dx.doi.org/10.1080/00207540802314837
Stank, T.P., Keller, S.B., & Daugherty, P.J. (2001). Supply chain collaboration and logistical service performance. Journal of Business Logistics, 22(1), 29-48. http://dx.doi.org/10.1002/j.2158-1592.2001.tb00158.x
Stevens, G.C. (1989). Integrating the supply chain. International Journal of Physical Distribution & Logistics Management, 19(8), 3-8. http://dx.doi.org/10.1108/EUM0000000000329
Stevenson, M., & Spring, M. (2007). Flexibility from a supply chain perspective: definition and review. International Journal of Operations & Production Management, 27(7), 685-713.
http://dx.doi.org/10.1108/01443570710756956
Swafford, P.M., Ghosh, S., & Murthy, N. (2008). Achieving supply chain agility through IT integration and flexibility. International Journal of Production Economics, 116(2), 288-297.
Swafford, P.M., Ghosh, S., & Murthy, N. (2006). The antecedents of supply chain agility of a firm: scale development and model testing. Journal of Operations Management, 24(2), 170-188.
http://dx.doi.org/10.1016/j.jom.2005.05.002
Swamidass, P.M., & Newell, W.T. (1987). Manufacturing strategy, environmental uncertainty and performance: a path analytic model. Management Science, 33(4), 509-524.
http://dx.doi.org/10.1287/mnsc.33.4.509
Swanson, E.B. (1994). Information systems innovation among organizations. Management Science, 40(9), 1069-1092. http://dx.doi.org/10.1287/mnsc.40.9.1069
Szulanski, G. (1996). Exploring internal stickiness: Impediments to the transfer of the best practice within the firm. Strategic Management Journal, 17, 27-43. http://dx.doi.org/10.1002/smj.4250171105
Tam, K.Y. (1998). The impact of information technology investments on firm performance and evaluation: evidence from newly industrialized economies. Information Systems Research, 9(1), 85-98. http://dx.doi.org/10.1287/isre.9.1.85
Tanriverdi, H. (2006). Performance effects of information technology synergies in multibusiness firms. MIS Quarterly), 30(1), 57-77.
Teece, D.J., Pisano, G., & Shuen, A. (1997). Dynamic capabilities and strategic management. Strategic Management Journal, 18(7), 509-533. http://dx.doi.org/10.1002/(SICI)1097-0266(199708)18:7<509::AID-SMJ882>3.0.CO;2-Z
Tu, Q., Vonderembse, M.A., Ragu-Nathan, T., & Sharkey, T.W. (2006). Absorptive capacity: enhancing the assimilation of time-based manufacturing practices. Journal of Operations Management, 24(5), 692-710. http://dx.doi.org/10.1016/j.jom.2005.05.004
Upton, D.M. (1997). Process range in manufacturing: an empirical study of flexibility. Management Science, 43(8), 1079-1092. http://dx.doi.org/10.1287/mnsc.43.8.1079
Urgal-González, B., & García-Vázquez, J.M. (2007). The strategic influence of structural manufacturing decisions. International Journal of Operations & Production Management, 27(6), 605-626. http://dx.doi.org/10.1108/01443570710750286
Vokurka, R.J., & O'Leary-Kelly, S.W. (2000). A review of empirical research on manufacturing flexibility. Journal of Operations Management, 18(4), 485-501. http://dx.doi.org/10.1016/S0272-6963(00)00031-0
Ward, P.T., Leong, G.K., & Boyer, K.K. (1994). Manufacturing proactiveness and performance. Decision Sciences, 25(3), 337-358. http://dx.doi.org/10.1111/j.1540-5915.1994.tb01847.x
Zhang, C., & Dhaliwal, J. (2009). An investigation of resource-based and institutional theoretic factors in technology adoption for operations and supply chain management. International Journal of Production Economics, 120(1), 252-269. http://dx.doi.org/10.1016/j.ijpe.2008.07.023
Zhang, Q., Vonderembse, M.A., & Lim, J. (2003). Manufacturing flexibility: defining and analyzing relationships among competence, capability, and customer satisfaction. Journal of Operations Management,. 21, 2, 173-191. http://dx.doi.org/10.1016/S0272-6963(02)00067-0
Zhang, Q., Vonderembse, M.A., & Cao, M. (2006). Achieving flexible manufacturing competence: the roles of advanced manufacturing technology and operations improvement practices. International Journal of Operations & Production Management, 26(6), 580-599. http://dx.doi.org/10.1108/01443570610666957
Zhu, K. (2002). Information transparency in electronic marketplaces: Why data transparency may hinder the adoption of B2B exchanges. Electronic Markets, 12(2), 92-99.
http://dx.doi.org/10.1080/10196780252844535
Zhu, K., Kraemer, K.L., & Xu, S. (2006). The process of innovation assimilation by firms in different countries: a technology diffusion perspective on e-business. Management Science,. 52(10),. 1557-1576. http://dx.doi.org/10.1287/mnsc.1050.0487
Journal of Industrial Engineering and Management, 2016 (www.jiem.org)
Article's contents are provided on an Attribution-Non Commercial 3.0 Creative commons license. Readers are allowed to copy, distribute and communicate article's contents, provided the author's and Journal of Industrial Engineering and Management's