Integrated Resource Plan
Update
March 30,
2011
2012
Let’s turn the answers
on.
This 2011 Integrated Resource Plan Update (2011 IRP Update) report is based upon the best available information at the time of preparation. The IRP action plan will be implemented as described herein, but is subject to change as new information becomes available or as circumstances change. It is PacifiCorp’s intention to revisit and refresh the IRP action plan no less frequently than annually. Any refreshed IRP action plan will be submitted to the State Commissions for their information.
For more information, contact: PacifiCorp
IRP Resource Planning
825 N.E. Multnomah, Suite 600 Portland, Oregon 97232
(503) 813-5245
http://www.pacificorp.com
This report is printed on recycled paper
Cover Photos (Left to Right):
Wind: McFadden Ridge I
Thermal-Gas: Lake Side Power Plant
Hydroelectric: Lemolo 1 on North Umpqua River
Transmission: Distribution Transformers
Solar: Residential Photovoltaic Solar Project
T
ABLE OF
C
ONTENTS
TABLE OF CONTENTS ... I INDEX OF TABLES ... III INDEX OF FIGURES ... IV
EXECUTIVE SUMMARY ... 1
Key Assumption Updates... 1
2012 Business Plan Resource Portfolio ... 2
IRP Action Plan Update ... 4
CHAPTER 1 – INTRODUCTION ... 11
CHAPTER 2 – PLANNING ENVIRONMENT ... 13
BUSINESS PLAN DEVELOPMENT ... 13
Disposition of the Carbon Coal-fired Plant ... 13
RESOURCE PROCUREMENT UPDATE ... 14
Lake Side 2 Combined-Cycle Combustion Turbine Project ... 14
All-Source Request for Proposals ... 14
Solar Request for Proposals ... 15
EMERGING ENVIRONMENTAL REGULATIONS OVERVIEW ... 15
Clean Air Act (CAA) Criteria Pollutants ... 16
Regional Haze ... 17
Mercury and Air Toxics Standards (MATS) ... 17
Cross-State Air Pollution Rule ... 18
New Source Review and Prevention of Significant Deterioration ... 19
Regional Climate Change Initiatives ... 20
State-Specific Initiatives ... 20
Oregon and Washington Initiatives... 20
Water Quality Standards ... 21
Coal Combustion Byproduct Disposal ... 21
ENERGY GATEWAY TRANSMISSION PROGRAM PLANNING ... 22
Energy Gateway Transmission Project Updates ... 23
Transmission Expansion Planning for the 2013 IRP ... 25
CHAPTER 3 – RESOURCE NEEDS ASSESSMENT UPDATE ... 27
INTRODUCTION ... 27
COINCIDENT PEAK LOAD FORECAST ... 27
Load Forecast ... 27
RESOURCE UPDATES ... 29
Existing and Firm Planned Resources ... 29
UPDATED CAPACITY LOAD AND RESOURCE BALANCE ... 29
Planning Reserve Margin Sensitivity Analysis ... 36
CHAPTER 4 – MODELING ASSUMPTIONS UPDATE ... 37
GENERAL ASSUMPTIONS AND PRICE INPUTS ... 37
Study Period and Date Conventions ... 37
Escalation Rates, Renewable Tax Credits, and Other Financial Parameters ... 37
NATURAL GAS AND POWER MARKET PRICE UPDATES ... 37
Natural Gas Market Prices ... 37
Power Market Prices ... 38
CARBON DIOXIDE EMISSION COSTS AND COMPLIANCE... 40
FRONT OFFICE TRANSACTIONS ... 42
SUPPLY-SIDE RESOURCES ... 43
CHAPTER 5 – PORTFOLIO DEVELOPMENT ... 45
INTRODUCTION ... 45
WIND RESOURCES AND RENEWABLE PORTFOLIO STANDARD COMPLIANCE ... 45
Renewable Portfolio Standard Compliance ... 46
Oregon RPS Compliance ... 49
Washington RPS Compliance ... 49
California RPS Compliance ... 50
Federal RPS Compliance ... 50
2012BUSINESS PLAN RESOURCE PORTFOLIO ... 52
Resource Strategies ... 57
Thermal Resources ... 57
Demand-side Management and Distributed Generation ... 57
Front Office Transactions ... 58
CHAPTER 6 – ACTION PLAN UPDATE ... 59
REDACTED APPENDIX A – COAL REPLACEMENT STUDY UPDATE ... 67
INTRODUCTION ... 67
ENVIRONMENTAL COMPLIANCE FOR COAL RESOURCES ... 68
Regulatory Backdrop ... 68
Compliance Flexibility ... 68
COAL REPLACEMENT STUDY APPROACH ... 71
Screening Analysis ... 71
System Optimizer Model Simulations ... 72
Replacement Resource Alternatives ... 74
Coal Investment Costs ... 75
Treatment of Post-2030 Costs ... 76
Cost Recovery ... 79
Decommissioning ... 81
NATURAL GAS AND CO2SCENARIOS... 81
RESULTS ... 85
Replacement Alternatives ... 85
Detailed Analysis of Units Selected through the Screening Analysis ... 86
Conclusions ... 89
I
NDEX OF
T
ABLES
TABLE ES.1 – 2012 BUSINESS PLAN PORTFOLIO, 2012-2021 ... 3
TABLE ES.2 – IRP ACTION PLAN UPDATE ... 5
TABLE 2.2 – TRANSMISSION EXPANSION PROJECT CATEGORIES ... 26
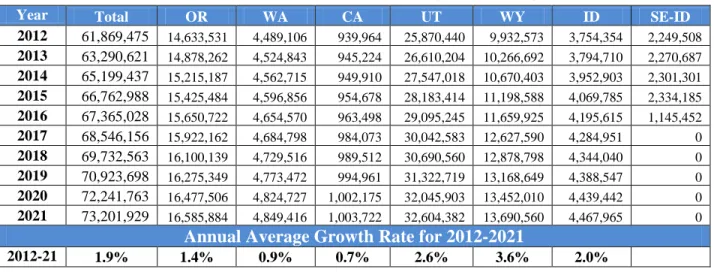
TABLE 3.1 – FORECASTED ANNUAL LOAD GROWTH, 2012 THROUGH 2021 (MEGAWATT-HOURS) ... 27
TABLE 3.2 – FORECASTED ANNUAL COINCIDENTAL PEAK LOAD (MEGAWATTS) ... 28
TABLE 3.3 – ANNUAL LOAD GROWTH CHANGE: NOVEMBER 2011 FORECAST LESS NOVEMBER 2010 FORECAST (MEGAWATT-HOURS) ... 28
TABLE 3.4 – ANNUAL COINCIDENTAL PEAK GROWTH CHANGE: NOVEMBER 2011 FORECAST LESS NOVEMBER 2010 FORECAST (MEGAWATTS) ... 28
TABLE 3.5 – DETAILED 2016 CAPACITY POSITION COMPARISON, 2011 IRP VERSUS THE 2012 BUSINESS PLAN ... 31
TABLE 3.6 – CAPACITY LOAD AND RESOURCE BALANCE, MEGAWATTS (13% TARGET RESERVE MARGIN) ... 34
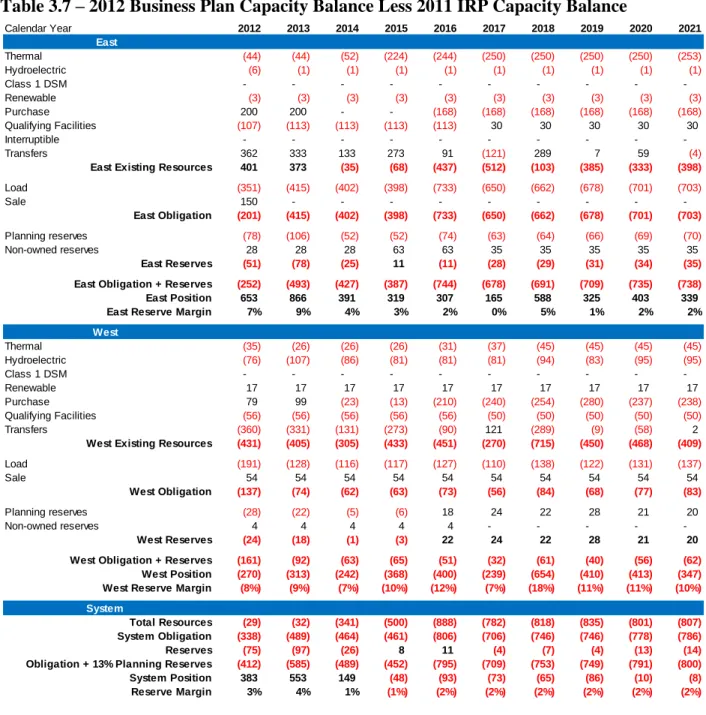
TABLE 3.7 – 2012 BUSINESS PLAN CAPACITY BALANCE LESS 2011 IRP CAPACITY BALANCE ... 35
TABLE 5.1 – WIND ADDITIONS SCHEDULE, 2012 BUSINESS PLAN VS. 2011 IRP ... 45
TABLE 5.2 – RENEWABLE PORTFOLIO STANDARD TARGETS, REQUIREMENTS, AND ELIGIBLE EXISTING RESOURCES BY STATE ... 48
TABLE 5.3 – RPS COMPLIANT WIND ADDITIONS SCHEDULE ... 49
TABLE 5.4 – COMPARISON OF 2012 BUSINESS PLAN WITH 2011 IRP PREFERRED PORTFOLIO ... 54
TABLE 5.5 – 2012 BUSINESS PLAN PORTFOLIO, DETAIL LEVEL ... 55
TABLE 5.6 – 2012 BUSINESS PLAN CAPACITY LOAD AND RESOURCE BALANCE (13% PLANNING RESERVE MARGIN) 56 TABLE 6.1 – IRP REVISED ACTION PLAN ... 60
TABLE 6.2 – COMPLETED ACTION PLAN ACTIVITIES ... 65
TABLE A.1 – DISTINCTIONS BETWEEN BOARDMAN AND NAUGHTON UNIT 3 THAT WOULD IMPACT COMPLIANCE FLEXIBILITY ... 70
TABLE A.2 – UNITS ANALYZED IN THE UPDATED COAL REPLACEMENT STUDY ... 72
TABLE A.3 – STRUCTURE OF SO MODEL SIMULATIONS ... 74
TABLE A.4 – TIMING AND AVAILABILITY OF REPLACEMENT RESOURCE ALTERNATIVES ... 75
REDACTED TABLE A.5 – INCREMENTAL COAL INVESTMENT COST ASSUMPTIONS, 2012 - 2030 ($ MILLION) ... 76
TABLE A.6 – ASSUMPTIONS FOR A REAL LEVELIZED REVENUE REQUIREMENT CALCULATION APPLIED TO TWO DIFFERENT HYPOTHETICAL INVESTMENT ALTERNATIVES ... 77
TABLE A.7 – COMPARISON OF THE PVRR RELATIONSHIP BETWEEN INVESTMENTS ALTERNATIVES A AND B USING THE REAL LEVELIZED REVENUE REQUIREMENT METHOD ... 79
TABLE A.8 – NATURAL GAS AND CO2 PRICE SCENARIOS ... 82
TABLE A.9 – SELECTED SYSTEM OPTIMIZER RESOURCE REPLACEMENT ALTERNATIVES TO CAPITAL INVESTMENT BY COAL UNIT ... 86
TABLE B.1 – POST-DSM: ANNUAL FORECASTED LOADS IN MEGAWATT-HOURS ... 91
TABLE B.2 – POST-DSM: ANNUAL FORECASTED COINCIDENTAL PEAK LOADS IN MEGAWATTS ... 91
I
NDEX OF
F
IGURES
FIGURE 2.1 – EPA REGULATORY TIMELINE FOR THE UTILITY INDUSTRY ... 16
FIGURE 2.2 – CROSS-STATE AIR POLLUTION RULE IMPACTED STATES ... 19
FIGURE 2.3 – ENERGY GATEWAY MAP ... 23
FIGURE 3.1 – CAPACITY POSITION COMPARISON, 2011 IRP VERSUS THE 2012 BUSINESS PLAN ... 30
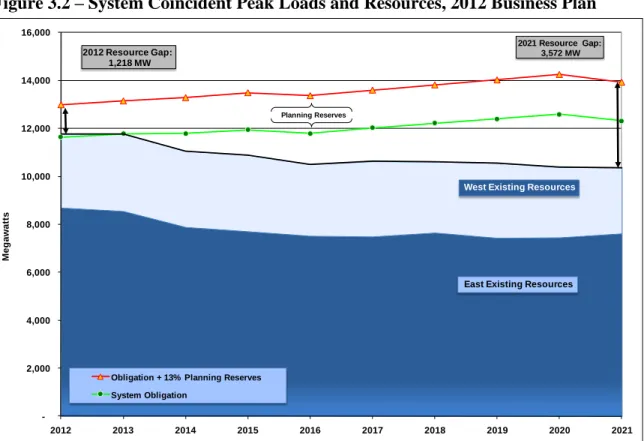
FIGURE 3.2 – SYSTEM COINCIDENT PEAK LOADS AND RESOURCES, 2012 BUSINESS PLAN ... 32
FIGURE 3.3 – EAST COINCIDENT PEAK LOADS AND RESOURCES, 2012 BUSINESS PLAN ... 32
FIGURE 3.4 – WEST COINCIDENT PEAK LOAD AND RESOURCES, 2012 BUSINESS PLAN ... 33
FIGURE 4.1 – HENRY HUB NATURAL GAS PRICES (NOMINAL) ... 38
FIGURE 4.2 – AVERAGE ANNUAL FLAT PALO VERDE ELECTRICITY PRICES ... 39
FIGURE 4.3 – AVERAGE ANNUAL HEAVY LOAD HOUR PALO VERDE ELECTRICITY PRICES ... 39
FIGURE 4.4 – AVERAGE ANNUAL FLAT MID-COLUMBIA ELECTRICITY PRICES ... 40
FIGURE 4.5 – TRANSMISSION TOPOLOGY ... 42
FIGURE 5.1 – OREGON RPS COMPLIANCE POSITION ... 50
FIGURE 5.2 – WASHINGTON RPS COMPLIANCE POSITION ... 51
FIGURE 5.3 – CALIFORNIA RPS COMPLIANCE POSITION ... 51
FIGURE 5.4 – FEDERAL RPS COMPLIANCE POSITION ... 52
FIGURE A.1 – ANNUAL NOMINAL AND REAL LEVELIZED REVENUE REQUIREMENT FOR HYPOTHETICAL INVESTMENT ALTERNATIVES A AND B ... 78
REDACTED FIGURE A.2 – ANNUAL INCREMENTAL COAL RESOURCE INVESTMENT COST VS. ANNUAL COST FOR RECOVERY OF INVESTMENTS MADE IN PRIOR YEARS ... 81
FIGURE A.3 – COMPARISON OF THIRD PARTY HENRY HUB NATURAL GAS PRICE FORECASTS ... 83
FIGURE A.4 – COMPARISON OF THIRD PARTY CO2 PRICE FORECASTS ... 84
FIGURE A.5 – HENRY HUB NATURAL GAS PRICES AMONG ALL SCENARIOS INCLUDED IN THE UPDATED COAL REPLACEMENT STUDY ... 85
REDACTED FIGURE A.6 – IMPACT OF NATURAL GAS PRICES ON THE PVRR(D) (BENEFIT)/COST OF INCREMENTAL ENVIRONMENTAL INVESTMENTS IN COAL RESOURCES ... 87
REDACTED FIGURE A.7 – IMPACT OF CO2 PRICES ON THE PVRR(D) (BENEFIT)/COST OF INCREMENTAL ENVIRONMENTAL INVESTMENTS IN COAL RESOURCES ... 88
FIGURE A.8 – FLEET-WIDE COAL GENERATION IN THE LOW GAS $34 CO2 SCENARIO AS COMPARED TO THE BASE GAS $16 CO2 SCENARIO ... 89
E
XECUTIVE
S
UMMARY
This 2011 Integrated Resource Plan (IRP) update report describes resource planning and procurement activities that occurred subsequent to the filing of the 2011 IRP in March 2011, and presents PacifiCorp‘s revised resource portfolio and IRP Action Plan. The resource portfolio reflects the outcome of the Company‘s 10-year business planning process for 2012-2021, culminating in the ―2012 Business Plan‖ approved by the MidAmerican Energy Holdings Company Board of Directors in December 2011. The revised IRP Action Plan comprises more implementation details for existing action items as well as new action items.
Key Assumption Updates
The figure below shows that the short capacity system position in the 2012 Business Plan has improved by 383 megawatts (MW) in 2012, 553 MW in 2013 and 149 MW in 2014 as compared to the 2011 IRP. In 2015 and 2016, the system capacity position in the 2012 Business Plan is shorter by 48 MW and 93 MW, respectively. Over the period 2017 through 2021, the system capacity position is on average 48 MW shorter in the 2012 Business Plan than in the 2011 IRP.
Key assumption and forecast changes between the 2012 Business Plan and the 2011 IRP include the following:
Load and resource updates, including:
Continued sluggish economy and deferral of expected new industrial and commercial loads.
Termination of the Southeast Idaho Exchange Agreement in 2016, which removed PacifiCorp‘s obligation for providing about 189 MW of firm peak load for Bonneville Power Administration‘s Idaho customers net of BPA Idaho resources, that is offset by reduced power purchases of nearly 200 MW in PacifiCorp West Balancing Area.
Several industrial customers‘ increased use of self-generation to offset retail loads.
(4,500) (4,000) (3,500) (3,000) (2,500) (2,000) (1,500) (1,000) (500) 0 2012 2013 2014 2015 2016 2017 2018 2019 2020 2021 M e gaw atts
System Capacity Position Change
2011 IRP
The assumption that certain PURPA Qualifying Facilities will elect to self-generate through 2016 rather than sell their output to PacifiCorp, reducing the amount of supply that can be used to meet load obligations.
The assumed retirement of the Carbon coal-fired plant as of January 1, 2015.1
Updated capacity ratings for a number of existing owned generating units, along with termination of the Grant Mid-Columbia hydro contract in 2013.
Cancellation of two coal plant turbine upgrade projects (Huntington 2 in 2016 and Hayden 2 in 2021).
Other updates, including:
Lower forecasted natural gas and wholesale electricity prices relative to the 2011 IRP, favoring natural gas fueled resources and market purchases.
An updated evaluation of Renewable Portfolio Standard compliance requirements and strategy that assumes federal renewable tax incentives will not be extended beyond December 31, 2012. The updated evaluation of RPS compliance requirements indicated that some wind resource capacity could be deferred to help reduce power supply costs during the planning window.
A net 50 MW increase in front office transaction (FOT) acquisition capabilities in the PacifiCorp West Balancing area.
A net decrease of about 250 MW in FOT acquisition capabilities in the PacifiCorp East balancing area, driven mainly by uncertainty regarding the availability of Utah North capacity following the expiration of an existing 200 MW contract that expires in December 2013.
A one to three year delay in several Energy Gateway transmission project segment in-service dates due to continued challenges in planning for, permitting, and building these transmission expansion projects. Affecting the timing of Wyoming wind additions is a one-year delay in the Windstar to Populus segment of Energy Gateway West.
The Company also modified its assumptions regarding future regulation of carbon emissions. For resource portfolio modeling and the September 2010 price curve used for the 2011 IRP, carbon
dioxide (CO2) pricing started in 2015 at $19/short ton; whereas, for the 2012 Business Plan and
August 2011 curve, CO2 pricing starts in 2021 at $16/ton. The slow economic recovery, in
tandem with predictions of sustained low natural gas prices and lack of momentum for CO2
legislation, has altered expectations.
2012 Business Plan Resource Portfolio
Table ES.1 reports the 2012 Business Plan portfolio resources, showing the years for which the resources are available to meet summer peak loads, along with a comparison to the 2011 IRP resources. The key resource changes with respect to the 2011 IRP preferred portfolio, for the 2012-2021 planning period, include the following:
Prior to 2015, lower market prices and increased access to market increases overall reliance on FOTs in the west, which are more than offset by reduced market purchases in the east
1
The compliance deadline based on the Environmental Protection Agency‘s recently finalized Mercury and Air Toxics Standards (MATS) is April 16, 2015.
driven by less market access, reduced loads, and the 200 MW Utah capacity purchase. On a system basis, reliance on FOTs in the 2012 Business Plan declines by 95 MW in 2012, 241 MW in 2013, and 129 MW in 2014 as compared to the 2011 IRP.
Given the 2016 capacity deficit increased by 93 MW, the need for a 2016 resource remains unchanged in the 2012 business plan, and the increased need relative to the 2011 IRP is largely met with incremental FOT acquisitions.
Deferral of 550 MW of wind resources over the period 2018 through 2021 in the 2012 business plan is driven by a revised RPS compliance analysis that is consistent with a lower load forecast, assumed delays in prospective federal RPS policy implementation, a delay of the Windstar to Populus Energy Gateway transmission project (from end 2017 to year-end 2018), and the assumed unavailability of federal production tax credits for the 10-year planning period.
With favorable wholesale electricity prices driven by lower natural gas prices, the 2012 Business Plan portfolio includes an additional 138 MW of west side FOTs and a 393 MW CCCT in 2019, which is smaller than the 475 MW CCCT included in the 2011 IRP preferred portfolio.
Table ES.1 – 2012 Business Plan Portfolio, 2012-2021
2012 Business Plan Portfolio
Capacity (MW) Resource
Total
Resource 2011 2012 2013 2014 2015 2016 2017 2018 2019 2020 2021 2012-2021
CCCT F 2x1 - - - 637 - 597 - - - - - 1,234
CCCT G 1x1 Dry-Cooled - - - - 393 - - 393
Coal Plant Turbine Upgrades 16 19 2 - - - - 21
Wind * - - - - 225 225 - 450
CHP - Biomass 1 1 1 1 1 1 1 1 1 1 1 10
DSM, Class 1 6 70 - 20 91 - - - - 181
DSM, Class 2 47 53 46 48 51 54 56 58 60 63 62 550
Micro Solar Watering Heating - - - - -Utah Capacity Purchase ** 200 200 200 - - - - 400
Front Office Transactions *** 17 17 150 300 331 300 300 300 296 300 54
Coal Plant Turbine Upgrades - - 12 - - - - 12
CHP - Biomass 4 4 4 4 4 4 4 4 4 4 4 42
DSM, Class 1 - - 57 - 6 - - - - 63
DSM, Class 2 61 61 65 70 71 70 70 62 62 62 63 655
Solar (Oregon) 4 4 4 3 3 - - - - 15
Micro Solar Watering Heating - - - - -Front Office Transactions *** 130 927 838 761 892 567 596 735 533 795 714
Annual Additions, Long Term Resources 139 213 191 783 227 726 131 125 745 355 130
Annual Additions, Short Term Resources 347 1,145 1,188 1,061 1,223 867 896 1,035 829 1,095 768
Total Annual Additions 486 1,358 1,378 1,844 1,450 1,593 1,027 1,160 1,574 1,450 897
** Utah Capacity Purchase is treated as an existing resource in the load & resource balance, having been executed in August 2011. Annual capacity amounts are not additive. *** Front Office Transactions amounts reflect one-year transaction periods, and are not additive. Difference - 2012 Business Plan Less 2011 IRP Preferred Portfolio Capacity (MW) Resource Total Resource 2011 2012 2013 2014 2015 2016 2017 2018 2019 2020 2021 2012-2021 CCCT F 2x1 - - - 12 - - - 12
CCCT G or H 1x1 - - - (82) - - (82)
Coal Plant Turbine Upgrades 4 - - - - (18) - - - - (2) (20)
Wind - - - - (300) (75) 25 (200) (550)
CHP - Biomass - - - -DSM, Class 1 - - - -DSM, Class 2 - - - -Micro Solar Watering Heating - (3) (3) (3) (3) (3) (3) (3) - - - (18)
Utah Capacity Purchase / FOT - - (4) (26) (250) - (72) (217) - (245)
-Front Office Transactions 17 (151) (264) (264) (68) (25) - - (4) - (246)
Coal Plant Turbine Upgrades - - 8 - - - - (8) - - -
-CHP - Biomass - - - -DSM, Class 1 - - - -DSM, Class 2 - - - -Solar (Oregon) - - - -Micro Solar Watering Heating - (2) (2) (2) (2) (2) (2) (1) - - - (12)
Front Office Transactions (20) 56 26 161 392 117 146 285 138 345 314
Annual Additions, Long Term Resources 4 (4) 4 7 (4) (22) (4) (312) (157) 25 (202)
Annual Additions, Short Term Resources (3) (95) (241) (129) 74 92 74 68 134 100 68
Total Annual Additions 2 (99) (238) (122) 69 70 69 (244) (23) 125 (135)
* In-service dates reflect the year in which wind resources contribute to meeting summer system peak load requirements. For the 2012 Business Plan, actual in-service dates are November of the prior year. For example, the resources shown in 2019 (225 MW) have an in-service date of November 1, 2018.
East
West
East
IRP Action Plan Update
Table ES.2 presents the updated 2011 IRP Action Plan. Activities already completed by the Company have been removed from the Action Plan and summarized in Table 6.2 of this report. The Company‘s updates to the 2011 IRP Action Plan reflect more specificity concerning resource procurement and study activities during the first four years of the Action Plan. A key change concerns the scope of the needs assessment supporting PacifiCorp‘s planned acquisition of resources by the summer of 2016. The Company has committed to updating the resource needs assessment (a capacity load and resource balance, along with new resource acquisition forecasts based on the outcome of 2012 procurement-related activities) in preparation for the bid evaluation phase of its all-source Request for Proposals. As required by the Public Utility Commission of Oregon in its recent PacifiCorp 2011 IRP acknowledgment order (issued March 9, 2012), the Company will request that the Oregon commission schedule a discovery and comment period for IRP stakeholders subsequent to preparation of this additional resource needs assessment.
Table ES.2 – IRP Action Plan Update
Action
Item Category Action(s)
1
Renewables/ Distributed Generation
Wind
Acquire cost effective wind resources to satisfy renewable portfolio standard requirements, diversify portfolio risk and reduce emissions. Incremental wind resource acquisition does not begin until the end of 2018 due to the need for
incremental transmission capacity to be able to deliver remote resource generation to load and the associated in-service date of Energy Gateway West. Acquire 450 MW of incremental wind resources in 2019 and 2020.
In the next IRP, PacifiCorp will track and report the statistics used to calculate capacity contribution from its wind resources as a means of testing the validity of the PLCC method.
Future IRP cycles will include a projection for wind acquisition with and without geothermal until a clearer picture emerges regarding geothermal dry hole risk.
The Company will continue to refine the wind integration modeling approach; establish a technical review committee (TRC) and a schedule and project plan for the next wind integration study. The TRC will be formed and members identified within 30 days of the effective date of the [Oregon] IRP Order. Within 30 days of the effective date of the [Oregon] IRP Order, a schedule for the study will be established, including full opportunity for stakeholder involvement and progress reviews by the TRC that will allow the final study to be submitted with the next IRP.
Geothermal
Continue to refine resource potential estimates and update resource costs in 2012 for further economic evaluation of resource opportunities. Continue to explicitly include geothermal projects as eligible resources in future all-source RFPs.
Solar
Acquire additional Oregon solar resource through RFPs or other means in order to meet the Company‘s 8.7 MW compliance obligation.
Work with Utah parties to investigate solar program design and deployment issues and opportunities in 2012 as part of the Public Service Commission of Utah‘s investigative docket (No. 11-035-104) on expanding the Solar Incentive Program.2
Investigate, and pursue if cost-effective from an implementation standpoint, commercial/residential solar water heating programs. Program cost-effectiveness and targets will be evaluated as part of resource planning efforts to be conducted during 2012.
In the context of the Oregon solar RFPs, analyze the trade-offs between early and later acquisition of solar resources. Combined Heat & Power (CHP)
Pursue opportunities for acquiring biomass CHP resources, primarily through the PURPA Qualifying Facility contracting process.
The preferred portfolio contains 52 MW of CHP resources for 2012-2021(10 MW in the east side and 42 MW in the
west side).3 Energy Storage
Proceed with an energy storage demonstration project, subject to Utah Commission approval of the Company‘s proposal to defer and recover expenditures through the demand-side management surcharge.
2Rocky Mountain Power, ―Re: Docket No. 07-035-T14 – Three year assessment of the Solar Incentive Program‖, December 15, 2010.
3
Action
Item Category Action(s)
Conduct a study of grid flexibility for accommodating variable energy resources (VER) as part of the next IRP filing. The study will include the following elements:
Definition of and suggest metrics by which to measure flexibility (applicable to all flexibility resources including: thermal, demand response (DR), and storage).
An inventory of existing flexibility needs and the adequacy or capability of existing assets to meet them. A projection of flexibility needs in the IRP timeframe to successfully integrate project VER additions.
A comparison of benefits and costs of obtaining flexibility from the range of flexibility resources (conventional thermal, DR, storage, etc).
Renewable Portfolio Standard Compliance
Develop and refine strategies for renewable portfolio standard compliance in California and Washington.
PacifiCorp will expand the next IRP to include discussion of RPS compliance strategies and the role of REC sales and purchases. The Company will be selective in its discussion to avoid conflict between the IRP, RPS Implementation Plan and RPS Compliance Report. 2 Intermediate / Base-load Thermal Supply-side Resources
Acquire a combined-cycle combustion turbine resource at the Lake Side site in Utah by the summer of 2014; the plant is proposed to be constructed by CH2M Hill E&C, Inc. (―CH2M Hill‖) under the terms of an engineering, procurement, and construction (EPC) contract. This resource corresponds to the 2014 CCCT proxy resource included in the 2011 IRP preferred portfolio.
PacifiCorp will reexamine the timing and type of post-2014 gas resources and other resource changes as part of the 2012 business planning process and all-source bid evaluation for 2016 resources.The reexamination will include documentation of capital cost and operating cost tradeoffs between resource types.
Consider siting additional gas-fired resources in locations other than Utah. Investigate resource availability issues including water availability, permitting, transmission constraints, access to natural gas, and potential impacts of elevation.
Continue conducting the all-source RFP for potential acquisition of peaking/intermediate/baseload resources by the summer of 2016 to fill any remaining resource need indicated by an updated load and resource balance reflecting the results of DSM RFPs, acquisition of front office transactions, reserve margin sensitivity analysis, and other relevant information.
3 Firm Market
Purchases
Acquire economic front office transactions or power purchase agreements as needed through summer 2016.
– Resources will be procured through multiple means, such as periodic mini-RFPs that seek resources less than five years in term, and bilateral negotiations.
Closely monitor the near-term and long-term need for front office transactions and adjust planned acquisitions as appropriate based on market conditions, resource costs, and load expectations.
Actively search for market options that could cost-effectively defer acquisition or construction of a 2016 CCCT resource.
4
Plant Efficiency Improvements
Continue to pursue economic plant upgrade projects—such as turbine system improvements and retrofits—and unit availability improvements to lower operating costs and help meet the Company‘s future CO2 and other environmental
Action
Item Category Action(s)
compliance requirements.
– Complete the remaining turbine upgrade projects by 2013, totaling an incremental 33.0 MW, subject to continuing
review of project economics.4
– Seek to meet the Company‘s updated aggregate coal plant net heat rate improvement goal of 478 Btu/kWh by 2019.5
Continue to monitor turbine and other equipment technologies for cost-effective upgrade opportunities tied to future plant maintenance schedules.
For the next IRP complete a study of cost-effective and reliable production efficiency opportunities at generating facilities (station load reduction opportunities not currently being captured in the IRP) where the Company has sole ownership of the facility. The resource opportunities identified will be modeled against competing demand and supply-side resources in the next IRP. Those selected will be targeted for completion by 2015 provided plant outages are not required.
5 Class 1 DSM
Acquire at least 140 MW of incremental cost-effective demand-side management resource by 2013 and up to 250 MW by 2015.
– Finalize an agreement for the commercial curtailment product (which includes customer-owned standby generation
opportunities). If cost effective, the company will file for approval by the 3rd quarter of 2012.
– Complete an analysis of the economic feasibility of Class 1 irrigation load control in the west by the second quarter of 2012. If the analysis suggests Class 1 irrigation load control is economic in the west, the Company will source delivery of a program through a Request for Proposal concurrent with the re-sourcing of Class 1 irrigation load control program delivery in the east by the third quarter of 2012.
– Issue an RFP in 2012 to re-procure the delivery of the Cool Keeper program following the 2013 control season. For the RFP, the Company will seek market approaches acceptable to Utah regulators to expand the program beyond its current level beginning in 2014.
6 Class 2 DSM
Acquire at least 900 MW6and up to 1,800 MW of cost-effective Class 2 programs by 2020, equivalent to at least 4,533 GWh and up to 9,066 GWh. Acquire at least 520 MW and up to 1000 MW of cost-effective Class 2 DSM by 2016.
– The Company filed the Utah and Washington residential home comparison report programs in March 2012. Investigate
broader applications by the end of 2014 that can be implemented by 2016.
– By 3rd quarter 2012 the Company will submit for commission approval a plan to acquire energy efficiency resources
from the Company‘s Special Contract customers in Utah and Idaho that can be reliably verified and delivered by 2016, and will pursue those resources provided the Commissions in those states approve a cost-recovery mechanism for the plan.
– The Company will seek to acquire all cost-effective resources that are available from the system-wide (except Oregon) RFP for residential and small commercial sector savings issued in March 2012. The cost effectiveness analysis will consider any adverse impact on the existing DSM programs. The results of the RFP will be known prior to the Company seeking acknowledgement of the final short list for the all-source RFP. The Company will promptly file for commission approvals to implement the cost-effective programs.
4 The redline correction reflects updated project information for the approved 2012 Business Plan. 5PacifiCorp Energy Heat Rate Improvement Plan, April 2010.
6 Adjusted to reflect 2011 IRP‘s initial MW contribution from Class 2 resources expected to be acquired in Oregon (reduces the MW contribution from Oregon
Action
Item Category Action(s)
For the next IRP, prior to beginning modeling and screening of DSM, and as part of the public input process, provide an analysis of alternatives to the current supply curve bundling and ramping methods for modeling energy efficiency measures. By the end of 2012 provide an analysis of the sufficiency of current staffing levels to achieve programmatic cost effective energy efficiency targets established in this plan.
Leverage the distribution energy efficiency analysis of 19 distribution feeders in Washington (conducted for PacifiCorp by Commonwealth Associates, Inc.) for analysis of potential distribution energy efficiency in other areas of PacifiCorp‘s system provided the Company receives approval by the appropriate Commission for recovery of the study cost through the demand-side customer efficiency surcharge. (The Washington distribution energy efficiency study final report was completed December 26, 2011.)
– Include in the 2013 IRP a detailed plan and schedule to implement cost-effective CVR in each state as approved by the state.
– By May 1, 2012 the company will schedule a work shop in each of its major states with commission staff to present findings of the Washington CVR evaluation.
– By the end of 2012 perform a high-level screening of 40 percent of its distribution circuits in each of the states to identify circuits where cost effective energy savings appears viable and detailed circuit study is warranted provided the Company receives approval by the appropriate Commission for recovery of the study cost through the demand-side customer efficiency surcharge.
– By the end of 2013 perform a high-level screening of the remaining 60 percent of its distribution circuits in each of the states to identify circuits where cost-effective energy savings appear viable and detailed circuit study is warranted provided the Company receives approval by the appropriate state commission for recovery of the study cost through the demand-side customer efficiency surcharge.
– In the 2013 IRP include the results of the CVR evaluation to date.
7 Class 3 DSM
During 2012 update the Conservation Potential Assessment to more accurately reflect Class 1 and 3 DSM resource opportunities in regards to 1) market and regulatory capabilities and climates in each state, 2) interactions within and between Class 1 and Class 3 resource potentials identified, and 3) the impact of existing Class 3 programs on product potential.
During 2012 have a third-party consultant review and prepare a report on how other utilities treat price-responsive products in their resource planning process (for example, as an adjustment to their load forecast and/or as a firm planning resource), and prepare a recommendation on how the Company might apply contributions from price products to help defer
investments in other resource options cost-effectively.
For the 2013 IRP provide a sensitivity analysis, similar to portfolio development Case 31 in the 2011 IRP, that more accurately reflects incremental Class 3 product opportunities (incremental to Class 1 products, other Class 3 products, and to existing impacts of Class 3 products the Company is already running).
Implement in Utah and Washington (subject to regulatory approvals) residential information pilots to test the effects of providing customers greater amounts of usage information on the quantity of electricity they consume. The pilots will leverage the existing AMR metering currently available in these states.
– Pilots will consist of three test groups each receiving varying levels of usage information:
Action
Item Category Action(s)
o Group 2 - Daily usage data through Home Energy Monitoring software (key component to pricing products)
o Group 3 – Home comparison reports, energy savings suggestions, and daily usage data through Home Energy
Monitoring software
Pilots will be implemented in 2012, run throughout 2013, and an analysis and recommendation prepared in 2014, prior to the development of the 2015 IRP.
If the analysis of Class 1 irrigation load control in the west (see action item 5) indicates that such programs are non-economic, investigate, through a pilot program in Oregon a Class 3 irrigation time-of-use program as an alternative approach for managing irrigation loads in the west.
8
Planning and Modeling
Process Improvements
Incorporate plug-in electric vehicles and Smart Grid technologies as a discussion topic for the next IRP.
9 Transmission
In the scenario definition phase of the IRP process, the Company will address with stakeholders the inclusion of any transmission projects on a case-by-case basis.
Develop an evaluation process and criteria for evaluating transmission additions. Review with stakeholders which transmission projects should be included and why.
Based on the outcome of these steps, PacifiCorp will provide appropriate transmission segment analysis for which the Company requests acknowledgement (including Wallula to McNary and Sigurd to Red Butte).
10
Planning Reserve Margin
As part of the updated resource needs assessment to be conducted for the all-source RFP, include the results of a System Optimizer portfolio sensitivity analysis comparing the resource and cost impacts of a 12 percent versus 13 percent planning reserve margin.
C
HAPTER
1
–
I
NTRODUCTION
This 2011 Integrated Resource Plan (IRP) Update Report describes resource planning activities that occurred subsequent to the filing of the 2011 Integrated Resource Plan in March 2010, and presents the Company‘s revised resource portfolio and IRP action plan. These activities centered on preparation of the Company‘s 10-year business plan for the period 2012-2021 (2012 Business Plan).
To support business plan development, PacifiCorp used its capacity expansion optimization
model, System Optimizer, to help refine the resource portfolio based on updates to forecasted
loads, resources, market prices, and other model inputs. The updated resource portfolio also incorporates resource decisions made outside of an optimization modeling context. These resource decisions reflect an analysis of state renewable portfolio standard (RPS) compliance requirements as well as capital expenditure and operating cost constraints developed by the corporate finance department with input from the PacifiCorp business units (PacifiCorp Energy, Pacific Power, and Rocky Mountain Power). The financial constraints ensure that the business plan is financially supportable and affordable to customers, while at the same time complying with all regulations and the MidAmerican Energy Holdings Company (MEHC) PacifiCorp acquisition commitments.
This report first describes the planning environment for 2011, focusing on PacifiCorp‘s business planning development, resource procurement initiatives, emissions/climate change regulatory outlook, and Energy Gateway transmission planning and project completion forecast (Chapter 2). Next, Chapters 3 and 4 describe the changes to key inputs and assumptions relative to those used for the 2011 IRP. The updated resource portfolio is then presented along with the updated IRP Action Plan (Chapters 5 and 6).
Appendices include the following:
Redacted Appendix A – Coal Replacement Study Update Appendix B – Additional Load Forecast Details
C
HAPTER
2
–
P
LANNING
E
NVIRONMENT
Business Plan Development
PacifiCorp developed the 2012 Business Plan as a result of a robust review and update of assumptions and budgetary constraints. The Plan was approved by the MEHC Board on December 9, 2011. It incorporated investments in transmission infrastructure and thermal and renewable resources needed to support future load obligations, maintain transmission system reliability, and meet current/prospective regulatory requirements.
A main finding of the 2012 business planning process was that given the current load forecast and sluggish economic recovery, continued reexamination of the need and timing for capital investments was necessary. Where appropriate and feasible, the Company eliminated or deferred investments and reduced operating expenditures. A primary focus of this effort was on the acquisition of wind resources to economically meet state renewable portfolio standards in light of diminishing prospects for continued federal renewable tax incentives and carbon regulation during the 10-year business planning horizon. An updated evaluation of RPS compliance requirements indicated that some wind resource capacity could be deferred to help reduce power supply costs during the planning window. Another key focus was consideration of investments to address current and emerging federal emission control standards. The planning assumptions for two of PacifiCorp‘s 26 coal units—Carbon Units 1 and 2—are described in the next section. During 2011, the Company also continued to address challenges associated with the Energy Gateway transmission expansion project. In-service dates have been updated relative to those assumed for the 2011 IRP. These date adjustments, combined with the lack of additional transmission capacity on the existing system, prompted a one-year deferral of planned wind resources dependent on the availability of new transmission.
Disposition of the Carbon Coal-fired Plant
The EPA‘s recently promulgated Mercury and Air Toxics Standards (MATS) incorporate specific emissions requirements for mercury, non-mercury metallic HAPs (hazardous air pollutants), and acid gases. The current emissions profiles of the Company‘s Carbon Units 1 and 2 do not demonstrate compliance with MATS limits for the pollutants regulated under that rule. Emissions control equipment currently installed on the units is limited to electrostatic precipitators for particulate matter control. The units have not been retrofitted with scrubbers, baghouses, or other emissions control equipment that would foster the units‘ abilities to comply. The Company is in the process of assessing emerging technologies, namely dry sorbent injection into the combustion processes of the units, in order to identify possible MATS compliance options. Should the testing provide positive results for all MATS regulated emissions, the Company will further assess the long-term commercial viability of such emerging technologies, as well as the ability of said technologies to support compliance with other emissions regulations such as National Ambient Air Quality Standards (NAAQS) and long-term Regional Haze Rule planning. The Company has assessed the feasibility and economics of major environmental equipment retrofits of Carbon Units 1 and 2 in the past and did not identify viable least-cost
options, accounting for risk and uncertainty, for the units. The Company has also assessed conversion of the units to natural gas as a fuel source and did not find that approach to result in favorable economics nor an acceptable emissions profile for long-term environmental compliance. Each of those assessments will be further reviewed against current environmental requirements and economic drivers to ensure that the most current and appropriate inputs are being assessed.
While the assessments described above will continue, the Company does not expect to identify a least-cost option, accounting for risk and uncertainty, other than retiring Carbon Units 1 and 2.
For resource planning purposes, these units were assumed to retire as of January 1, 2015.7
However, the Company is also currently assessing potential transmission system impacts associated with potential retirement of the Carbon units, particularly with respect to long-term regional transmission system reliability, that may result in a need to request an extension of the compliance deadline for the Carbon facility to accommodate transmission system improvements. The initial results of said study are expected in April 2012. Should reliability concerns or other considerations support the need for an extended compliance schedule, the Company will work within the conditions included within the MATS regulations and administrative guidance to request an appropriate compliance extension.
Resource Procurement Update
The following sections summarize procurement activities initiated in 2011 that influenced 2012 Business Plan development.
Lake Side 2 Combined-Cycle Combustion Turbine Project
On April 20, 2011, the Public Service Commission of Utah approved PacifiCorp‘s decision to build the Lake Side 2 CCCT plant for service by June 2014, and conditionally granted a Certificate of Public Convenience and Necessity (CPCN) enabling the Company to proceed with construction. CH2M Hill Engineers Inc. is the engineering, procurement and construction contractor for the project.
All-Source Request for Proposals
PacifiCorp issued its all-source RFP on January 6, 2012 for acquisition of resources by June 1,
2016. This RFP seeks up to approximately 600 MW of base load, intermediate load and summer
peak (3rd-quarter) resources. For the 2012 Business Plan, the Company assumed the 2016 acquisition of the generic CCCT included in the 2011 IRP preferred portfolio. As noted in the revised IRP Action Plan, the Company may opt to contract for more or less capacity and energy depending upon an updated resource needs assessment and other factors. The Public Utility Commission of Oregon approved the RFP on March 27, 2012. Bids are due May 9, 2012. Acknowledgment of the resulting final bid short list by the Oregon Commission is expected in October 2012, and a final resource
7 The compliance deadline based on the Environmental Protection Agency‘s recently finalized MATS is April 16,
decision is expected by early 2013. At that time, the Company will file an application for a ―major resource‖ approval proceeding in Utah.
The RFP documents and support materials are available for download from the Company‘s RFP
Web site: http://www.pacificorp.com/sup/rfps/asrfp2016.html.
Solar Request for Proposals
On November 30, 2010, PacifiCorp issued a solar photovoltaic resource RFP for projects up to two MW (alternating current) located in Oregon. The solar RFP was issued in response to
Oregon Statute ORS 757.370, which requires the Company to acquire 8.7 MWac of qualifying
solar photovoltaic system capacity by 2020. As a result of the RFP, the Company awarded a development contract for a two-megawatt, 9,000 panel solar installation near Lakeview, Oregon. Construction is scheduled to begin in May 2012, and the project is expected to start commercial operations in October 2012.
Emerging Environmental Regulations Overview
PacifiCorp‘s parent company, MidAmerican Energy Holdings Company, has been an active member of the Edison Electric Institute (EEI) modeling group, especially regarding the analysis of potential EPA regulatory scenarios.
In January 2011, the EEI published a report titled ―Potential Impacts of Environmental Regulation on the U.S. Generation Fleet‖, which reflects a collaborative effort by the EEI and its members to model a variety of prospective EPA rules for air quality, greenhouse gases (GHGs), coal combustion residuals and cooling water intakes. The report summarizes the potential impact of uncertain regulatory outcomes on unit retirements, idling, capacity additions, pollution control installations, and capital expenditures, based on national-level average input assumptions. The results contained in the report help guide PacifiCorp‘s long-term environmental planning.
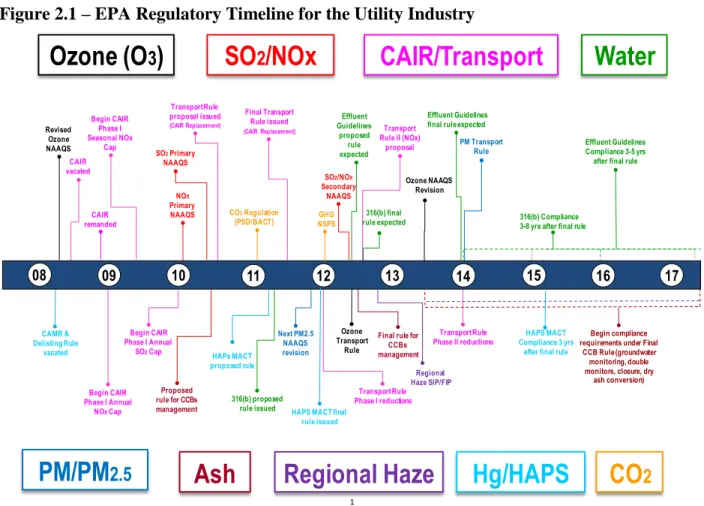
The EPA has undertaken a multiple-path approach to minimize air, land and water-based environmental impacts. Many environmental regulations from the EPA are in various stages of parallel development, as represented in the timeline in Figure 2.1.
Figure 2.1 – EPA Regulatory Timeline for the Utility Industry
Each of these regulations could have an impact on PacifiCorp‘s long-term environmental plan,
could change dispatch scenarios, and could ultimately impact the economic viability of PacifiCorp‘s electric generation units.
PacifiCorp continues to evaluate the potential impact of climate change legislation at the federal level. The impact of federal climate change legislation would vary significantly depending on key criteria. While measures to regulate GHG emissions at the federal level were considered by the United States Congress in 2010, comprehensive climate change legislation has not been adopted. Further, in April 2011, the United States House of Representatives voted 255-177 on a
bill (H.R. 910) that would prevent the EPA from regulating GHG emissions. No action has been
taken by the Senate on the bill.
The EPA regulatory timeline above identifies several categories of regulations for non-GHG
emissions, some of which are represented below:
Clean Air Act (CAA) Criteria Pollutants
Currently, PacifiCorp‘s generation units must comply with the CAA which is implemented by state agencies and subject to EPA approval and oversight. The CAA requires the EPA to set National NAAQS for certain pollutants considered harmful to the environment and public health. For a specific NAAQS, the EPA and/or a state agency identifies various control measures that when implemented are meant to achieve an ambient air quality standard for a certain pollutant.
Ozone (O
3)
PM/PM
2.5 08 09 10 11 12 13 14 15 16 17 Begin CAIR Phase I Seasonal NOx Cap HAPs MACT proposed rule Revised Ozone NAAQS Begin CAIR Phase I Annual SO2Cap Next PM2.5 NAAQS revision PM Transport Rule SO2Primary NAAQS SO2/NOX Secondary NAAQS NOX Primary NAAQSSO
2/NOx
CAMR & Delisting Rule vacated Transport Rule proposal issued (CAIR Replacement)HAPS MACT final
rule issued
CAIR
vacated
HAPS MACT
Compliance 3 yrs after final rule
CAIR remanded
CAIR/Transport
Begin CAIR Phase I Annual NOXCap 316(b) proposed rule issued 316(b) finalrule expected 316(b) Compliance3-8 yrs after final rule
Effluent Guidelines proposed rule expected
Water
Effluent Guidelinesfinal rule expected
Effluent Guidelines
Compliance 3-5 yrs after final rule
Begin compliance
requirements under Final
CCB Rule (groundwater monitoring, double
monitors, closure, dry
ash conversion)
Ash
Proposed
rule for CCBs
management
Final rule for
CCBs management Final Transport Rule issued (CAIR Replacement) CO2Regulation (PSD/BACT) Ozone NAAQS Revision Transport Rule Phase I reductions Transport Rule Phase II reductions Transport Rule II (NOx) proposal Ozone Transport Rule
Hg/HAPS
CO
2 1Regional Haze
Regional Haze SIP/FIP GHG NSPSPM, SO2, ozone, NO2, carbon monoxide and lead are frequently grouped together under the
CAA because each of these categories is linked to one or more NAAQS. The criteria pollutants, while undesirable, are not toxic in typical concentrations in the ambient air. Under the CAA, they are regulated differently from other types of emissions, such as HAPs and GHGs which will be mentioned below. As a result of its periodic review of the NAAQS, the EPA established new
standards for NO2, PM, and SO2. In addition, the EPA was expected to complete reconsideration
of the previously established ozone standards in 2011. However on September 2, 2011, President Obama requested that EPA Administrator Jackson withdraw the draft ozone standard because the standard would be reconsidered in 2013 and he did not support implementation of a new standard that would be reconsidered shortly after issuance.
President Obama cited concern about the new standard negatively affecting jobs and economic recovery. This recent decision is indicative of the level of environmental rulemaking uncertainty.
Regional Haze
The EPA‘s rule to address Regional Haze visibility concerns drives emission reductions from steam electric plants operating in PacifiCorp‘s service territories. On June 15, 2005, the EPA issued amendments to its July 1999 Regional Haze rule. The amendments apply to provisions of the Regional Haze rule that require emission controls known as Best Available Retrofit Technology (BART) for steam electric plants with emissions that have the potential to impact
visibility. These emissions of primary concern include PM2.5, NOX, and SO2. The 2005
amendments included final guidelines, known as BART guidelines, for states to use in determining which steam electric plants must install controls and the type of controls the steam electric plants must implement during the program‘s first five-year planning period. States were given until December 2007 to develop their implementation plans, in which states were responsible for identifying the facilities, including steam electric plants that would be required to reduce criteria pollutant emissions under BART, as well as establishing BART emissions limits for those facilities. These facilities, after undergoing a review of their emissions and their contribution to visibility impairment, may be required to install additional emission control equipment no later than five years after the EPA approves a state‘s Regional Haze implementation plan. In 2008, the state of Utah submitted its regional haze state implementation plan to the EPA for approval, and the state of Wyoming submitted its plan in January 2011. The EPA has not yet provided its initial or final approval or disapproval of the Wyoming or Utah state implementation plans. The EPA‘s rejection of other regional haze state implementation plans has resulted in lawsuits being filed by states and affected entities. Such appeals were pending before the Tenth Circuit Court of Appeals by New Mexico and Oklahoma at the time the 2012 Business Plan was approved in December 2011.
Mercury and Air Toxics Standards (MATS)
In March 2005, the EPA issued the Clean Air Mercury Rule (CAMR) to permanently limit and reduce mercury emissions from coal-fueled steam electric plants under a market-based cap-and-trade program. However, the CAMR was vacated in February 2008, with the court finding the
mercury rules inconsistent with the stipulations of Section 112 of the CAA. A replacement rule, proposed in March 2011, was published in the Federal Register February 16, 2012, and will become final in April 2012. The MATS rule requires existing coal-fueled generating facilities to achieve stringent emission standards for mercury, acid gases and other non-mercury hazardous air pollutants within three years after the rule is final, with individual sources granted an additional year to comply if approved by the permitting authority. Mercury emissions control equipment is included in PacifiCorp‘s environmental and capital plans. Emissions control
equipment for SO2 and particulate matter assist in achieving compliance with the MATS.
Cross-State Air Pollution Rule
On July 6, 2011, the EPA finalized a rule which requires new reductions in SO2 and NOX
emissions from electricity generating units in 27 states. This rule, known as the Cross-State Air Pollution Rule (CSAPR), requires emission reductions to take effect starting January 1, 2012, for
SO2 and annual NOX reduction, and May 1, 2012, for ozone season NOX reduction. The CSAPR
was intended to replace the Bush administration‘s Clean Air Interstate Rule (CAIR), which was vacated in July 2008 and rescinded by a federal court because it failed to effectively address pollution from upwind states that is hampering efforts by downwind states to comply with PM and ozone NAAQS. CSAPR also replaces the July 2009 EPA proposed Clean Air Transport Rule intended to help states attain NAAQS established in 1997 for fine PM and ozone emissions. Implementation of the CSAPR was stayed by the D.C. Circuit Court of Appeals in December 2011 pending consideration of several petitions for review before the court; the court held that the CAIR should be administered pending the resolution of the pending petitions for review. PacifiCorp does not own generation units in states identified by the CSAPR and is not directly impacted; however, PacifiCorp continues to monitor other CSAPR related state and supplementary EPA actions and pending challenges of the CSAPR for indications that these actions extend the geographic extent of impacted states. Figure 2.2 is a map of the CSAPR impacted states, and includes states covered in the EPA‘s supplemental notice of proposed rulemaking (SNPR).
Figure 2.2 – Cross-State Air Pollution Rule Impacted States
The EPA regulatory timeline above also identifies several key initiatives for regulating GHG emissions. These are outlined below.
New Source Review and Prevention of Significant Deterioration
On May 13, 2010, the EPA issued a final rule that addresses GHG emissions from stationary sources under CAA permitting programs, known as the greenhouse gas ―tailoring‖ rule. This final rule sets thresholds for GHG emissions that define when permits under the NSR, PSD and Title V Operating Permit programs are required for new and existing steam electric plants. This final rule ―tailors‖ the requirements of CAA permitting programs to limit which facilities will be required to obtain PSD and Title V permits. The GHG tailoring rule required new or modified sources of GHG emissions to determine the best available control technology for their GHG emissions beginning in January 2011. Litigation is currently pending in the D.C. Circuit Court of Appeals on EPA‘s GHG endangerment finding and the tailoring rule, with oral arguments schedule to take place in February 2012.
New Source Performance Standards (NSPS)
NSPS are established under the CAA for certain industrial sources of emissions determined to endanger public health and welfare, and must be reviewed every eight years. On December 23, 2010, in a settlement reached with several states and environmental groups in New York v. EPA,
the EPA agreed to promulgate emissions standards covering GHGs from new and existing fossil-fueled electric generating units under Section 111 of the CAA by July 26, 2011 (which was subsequently extended) and issue final regulations by May 26, 2012. On March 27, 2012, the EPA issued proposed rules to limit emissions of greenhouse gases from new fossil-fueled power plants to 1,000 pounds per megawatt-hour, the impacts of which will be addressed in PacifiCorp’s forthcoming resource planning efforts.
Regional Climate Change Initiatives
While national GHG legislation has yet to be successfully adopted, regional and state initiatives continue with the active development of climate change regulations that are likely to impact PacifiCorp. The Western Climate Initiative was established as a comprehensive regional effort to reduce GHG emissions by 15% below 2005 levels by 2020 through a cap-and-trade program that includes the electricity sector. The Western Climate Initiative initially included the state of California, Montana, New Mexico, Oregon, Utah, Washington and the Canadian provinces of British Columbia, Manitoba, Ontario and Quebec. However, only California, British Columbia and Quebec are moving forward under the initiative, with the other states focused on efforts to design, promote and implement cost-effective policies to reduce GHG emissions and create economic opportunities.
State-Specific Initiatives
Many states have developed climate action plans and formed legislative advisory groups. PacifiCorp continues to actively monitor and participate in state and regional policy discussions relevant to all of its retail jurisdictions.
In October 2011, the California Air Resources Board adopted a GHG cap-and-trade program with an effective date of January 1, 2012; compliance obligations will be imposed on entities beginning in 2013. California also adopted a greenhouse gas emissions performance standard (S.B. 1368) that precludes long-term investments in base load generation (through ownership or through long-term contract) in power plants unless the facility meets a GHG emission rate of 1,100 pounds per megawatt hour.
Oregon and Washington Initiatives
The Washington and Oregon governors signed executive orders in May 2007 and August 2007, respectively, establishing economy-wide goals for the reduction of GHGs in their respective states. Washington’s goals seek to: (1) by 2020, reduce emissions to 1990 levels; (2) by 2035, reduce emissions to 25 percent below 1990 levels; and (3) by 2050, reduce emissions to 50 percent below 1990 levels, or 70 percent below Washington’s forecasted emissions in 2050. Oregon’s goals seek to: (1) by 2010, cease the growth of Oregon GHG emissions; and (2) by 2020, reduce greenhouse gas levels to 10 percent below 1990 levels. Each state’s legislation also calls for state government developed policy recommendations in the future to assist in the monitoring and achievement of these goals.
In addition, both Washington and Oregon have adopted GHG emission performance standards of 1,100 pounds of carbon dioxide per megawatt hour and prohibit electric utilities from entering into long-term financial commitments (e.g., new ownership investments or new or renewed
contracts with a term of five or more years) unless any base load generation supplied under long-term financial commitments comply with the GHG emissions performance standards.
Water Quality Standards
In March 2011, the EPA released a proposed rule under §316(b) of the Clean Water Act to regulate cooling water intakes at existing facilities. The proposed rule establishes requirements for all power generating facilities that withdraw more than two million gallons per day, based on total design intake capacity, of water from waters of the United States and use at least 25% of the withdrawn water exclusively for cooling purposes. PacifiCorp's Dave Johnston generating facility withdraws more than two million gallons per day of water from waters of the United States. PacifiCorp's Jim Bridger, Naughton, Gadsby, Hunter, Carbon and Huntington generating facilities currently utilize closed cycle cooling towers, but also withdraw more than two million gallons of water per day. The proposed rule includes impingement (i.e., when fish and other organisms are trapped against screens when water is drawn into a facility's cooling system) mortality standards to be met through average impingement mortality or intake velocity design criteria and entrainment (i.e., when organisms are drawn into the facility) standards to be determined on a case-by-case basis. The standards are required to be met as soon as possible after the effective date of the final rule, but no later than eight years thereafter. The rule is required to be finalized by the EPA by July 2012. Assuming the final rule is issued by July 2012, PacifiCorp's generating facilities impacted by the final rule will be required to complete impingement and entrainment studies in 2013.
Coal Combustion Byproduct Disposal
In December 2008, an ash impoundment dike at the Tennessee Valley Authority's Kingston power plant collapsed after heavy rain, releasing a significant amount of fly ash and bottom ash, coal combustion byproducts, and water to the surrounding area. In light of this incident, federal and state officials have called for greater regulation of the storage and disposal of coal combustion byproducts. In May 2010, the EPA released a proposed rule to regulate the management and disposal of coal combustion byproducts, presenting two alternatives to regulation under the RCRA. Under the first option, coal combustion byproducts would be regulated as special waste under RCRA Subtitle C and the EPA would establish requirements for coal combustion byproducts from the point of generation to disposition, including the closure of disposal units. Alternatively, the EPA is considering regulation under RCRA Subtitle D under which it would establish minimum nationwide standards for the disposal of coal combustion byproducts. Under both options, surface impoundments utilized for coal combustion byproducts would have to be cleaned and closed unless they could meet more stringent regulatory requirements; in addition, more stringent requirements would be implemented for new ash landfills and expansions of existing ash landfills. PacifiCorp operates 16 surface impoundments and six landfills that contain coal combustion byproducts. These ash impoundments and landfills may be impacted by the newly proposed regulation, particularly if the materials are regulated as hazardous or special waste under RCRA Subtitle C. The public comment period closed in November 2010. The EPA has not indicated when the rule will be finalized, and the substance of the final rule is not known. The United States House of Representatives passed H.R. 2273 in October 2011, which would regulate coal combustion byproducts under RCRA Subtitle D. A Senate bill similar to the House bill has been introduced, but action has not been taken on the bill. PacifiCorp has begun evaluating surface impoundment and landfill compliance plan options
to ensure that physical infrastructure decisions are aligned with the potential outcomes of the rulemaking.
Energy Gateway Transmission Program Planning
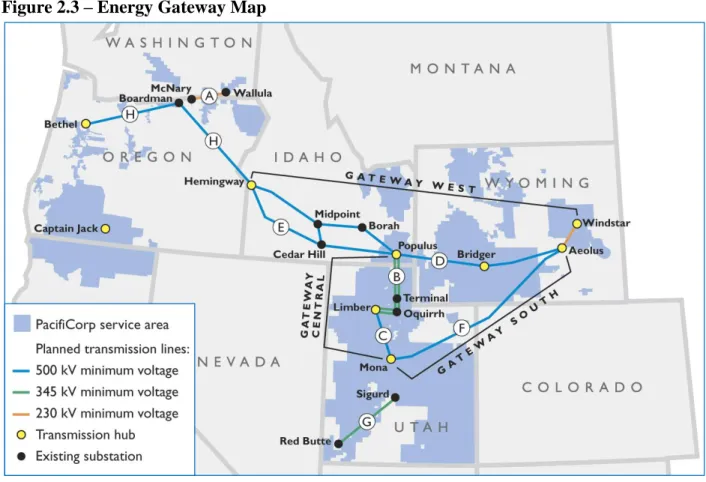
The Energy Gateway transmission program continues to play an important role in the Company’s commitment to provide safe, reliable, reasonably priced electricity to meet the needs of our customers. Energy Gateway’s design and extensive footprint provides needed system reliability improvements and supports the development of a diverse range of cost-effective resources required for meeting customers’ energy needs. Energy Gateway has been included as a component of the IRP for multiple cycles as a solution for delivering the least cost resource portfolio. The company is continuing to develop methods, in parallel with current industry best practices and regional transmission planning requirements, to better quantify all the benefits of transmission that are essential to serving customers. For example, Energy Gateway is designed to relieve operating limitations, increase capacity, and improve operations and reliability in the existing electric transmission grid. See below under “Transmission Expansion Planning for the 2013 IRP” for a discussion of the Company’s efforts to demonstrate—and quantify where possible—these benefits more comprehensively than traditional methods of net power cost and least-cost analysis have afforded.
Several Energy Gateway developments have occurred since the Company’s March 2011 IRP was filed, including reaching construction and permitting milestones, adjusting in-service dates for future segments, adjusting configuration for one segment, and making progress on joint-development projects. Also, in response to direction from state regulators, the Company has committed through a new IRP Action Plan item to address with stakeholders the evaluation and inclusion of any transmission projects in the IRP, which includes efforts to develop a stakeholder process to identify and quantify a broad range of transmission benefits. An updated Energy Gateway map is provided below as Figure 2.3.