Opening up IP Strategy: Implications for Open Source
Software Entry by Start-Up Firms
Wen Wen
McCombs School of Business The University of Texas at Austin
1 University Station, B6000 Austin, TX 78712
Marco Ceccagnoli
Scheller College of Business Georgia Institute of Technology
800 West Peachtree St. NW Atlanta, GA 30308
Chris Forman
Scheller College of Business Georgia Institute of Technology
800 West Peachtree St. NW Atlanta, GA 30308
[January 2015. Forthcoming: Management Science]
Abstract
We examine whether a firm’s IP strategy in support of the open source software (OSS) community stimulates new OSS product entry by start-up software firms. In particular, we analyze the impact of strategic decisions taken by IBM around the mid-2000s, such as its announcement that it will not assert its patents against the OSS community and its creation of a patent commons. These decisions formed a coherent IP strategy in support of OSS. We find that IBM’s actions stimulated new OSS product introductions by entrepreneurial firms, and that their impact is increasing in the cumulativeness of innovation in the market and the extent to which patent ownership in the market is concentrated.
Keywords: IP strategy, open source, open source software (OSS), OSS entry, patent commons, patent pledge, patent thicket, start-ups’ OSS innovation, cumulative innovation, concentrated patent ownership.
* We thank Ajay Agrawal, Ashish Arora, Tim Bresnahan, Alberto Galasso, Stuart Graham, Patrick Legros, Josh Lerner, Megan
MacGarvie, Marc Rysman, Timothy Simcoe, Salvatore Torrisi, Nicolas Van Zeebrock, Feng Zhu, and participants at the NBER Patents, Standards, and Innovation Conference, the 2011 Workshop on Information Systems and Economics (WISE), the 2011 Conference on Information Systems and Technology (CIST), the 2011 REER conference at the Georgia Institute of Technology, the 2012 European Policy for Intellectual Property (EPIP) conference, the Université Libre de Bruxelles (ECARES), the 2012 Academy of Management Conference Symposium, the 2013 Platform Strategy Research Symposium at the Boston University. We gratefully acknowledge funding from a Kauffman Foundation/Georgia Research Alliance grant for the study of entrepreneurship and productivity. We thank Nirmalya Choudhury, Matthew Espy, Emily Getreu, Bridget M. Gorta, Sujay Mehta, Daniel Mitchell, and Jian Zhao for outstanding research assistance. Wen Wen thanks the Kauffman Foundation for providing funding for this research through a Kauffman Dissertation Fellowship. Chris Forman acknowledges funding from the Alfred P. Sloan Foundation through an Industry Studies Fellowship. All errors are our own.
1 1. Introduction
While patents play an important “property rights” role in facilitating transactions in markets for technology (e.g., Arora et al. 2001, Gans et al. 2002), the strategic use of patents and the appearance of dense, overlapping webs of property rights known as patent thickets may also work to stifle innovation (e.g., Bessen and Meurer 2008, Jaffe and Lerner 2004, Shapiro 2001). Empirical evidence on this issue is still mixed, with implications varying across industries and firms.1
The presence of patent thickets may be a particular issue for developers of information technology (IT) products like computing hardware and software, where innovation is often highly cumulative and products rely on standards of heterogeneous inventions for which patent rights are often owned by many different firms.2 Firms who wish to mitigate the patent thickets problem can form multi-firm institutional arrangements such as standard setting organizations (SSOs) and patent pools. These mechanisms will lower the transaction costs of identifying and negotiating licensing agreements for related technologies, but may also increase the incentives for some patentees to litigate (e.g., Lampe and Moser 2013, Simcoe et al. 2009). As a result, they have had mixed effects on inventive activity that builds upon earlier patented technologies.3
Alternatively, firms can use their own patent portfolios, generated internally or acquired through markets for technology, to mitigate risks of infringement posed by patent thickets. This can be done either by making their intellectual property rights (IPR) available to other firms for use at low cost or to facilitate the discovery of prior art for complementary producers who may face litigation. This motivation is widely believed to be one reason for Google’s recent acquisition of Motorola. For example, Google CEO Larry Page writes in a letter (Page 2011):
“We recently explained how companies including Microsoft and Apple are banding together in anti-competitive patent attacks on Android. The U.S. Department of Justice had to intervene in the results of one recent patent auction to “protect competition and innovation in the open source software community” and it is currently looking into the results of the Nortel auction. Our acquisition of Motorola will increase competition by strengthening Google’s patent portfolio, which will enable us to better protect Android from anti-competitive threats from Microsoft, Apple
and other companies.”4
1 For example, one study on the semiconductor industry finds that the pro-patent shift in US policy in the 1980s spawned an increase
in strategic patenting among capital-intensive firms, but also facilitated entry by specialized design firms (Hall and Ziedonis 2001). Cockburn and MacGarvie (2011) find that, following expansions in the patentability of software in the mid-1990s, average entry rates declined but the likelihood of entry by firms holding patents increased.
2 For example, Biddle et al. (2012) identify 251 technical interoperability standards in a modern laptop.
3 For example, Rysman and Simcoe (2008) show that citations to patents increase significantly after disclosure that they are part of
a standard, while Lampe and Moser (2010) study the sewing machine patent pool and find that the pool decreased patenting and innovation, particularly among members of the pool.
4 Google sold Motorola to Lenovo in early 2014, retaining, however, most of the patents acquired as part of its original deal (Miller
2 Despite the potential importance of this type of intellectual property (IP) strategy and its implications for complementary innovation, thus far we have little evidence on whether such actions contribute to increased innovative activity, and the conditions under which these strategies are most effective.5 This is an important gap in understanding. In our setting, we will refer to an IP strategy as any of a set of decisions on how to leverage own IP in order to stimulate complementary innovation. This could include a patent non-assertion pledge, or the establishment of other institutions to mitigate some of the risks of IPR infringement by complementors. These types of IP strategies are becoming increasingly common in a range of settings, as firms have pledged IP related to such diverse technologies as the PC bus architecture and microprocessors (Ethiraj 2007, Gawer and Henderson 2007), open document format standards (Bekkers et al. 2012), electric cars (Musk 2014), and green technology (Hall and Helmers 2013).
Motivated by these observations, we take a first step toward evaluating whether and under what conditions one firm’s IP strategy influenced complementary innovation around a set of related platform technologies. Specifically, we study the impact of strategic decisions taken by IBM around 2005 to stimulate innovative activity in open source software (OSS). We use as a proxy for this shift in strategy IBM’s announcements of non-assertion of patents against the OSS community and the creation of The Patent Commons (commonly referred to as “The Commons”), a specific set of patents that was made available royalty-free to the OSS community under certain conditions. We focus on the how these decisions impacted the entry of new products issued under an OSS license (which we refer to as “OSS entry”) by US software start-up firms.
We study OSS because it is a setting where the patent thickets problem is thought to be particularly salient; the distributed, incremental development approach to developing OSS implies that innovation is highly cumulative and it is difficult to identify the provenance of source code. As a result, small OSS firms commonly have few patents themselves with which to execute cross-licensing agreements or to facilitate prior art searches when facing litigation (e.g., von Hippel and von Krogh 2003, Alexy and Reitzig 2013).6 Against the background of this environment, there have been some well-known examples of assertion of IPR against OSS firms (e.g., the SCO v. IBM case, see Alexy and Reitzig 2013 and Wen, Forman, and Graham 2013).
Our theoretical framework suggests that IBM’s IP strategy in support of OSS should mitigate licensing costs and litigation threats created by patent thickets. Start-ups should expect lower sunk costs of entry than otherwise and thus be more likely to enter into downstream markets. Moreover, we argue that
5For examples of how openness in IP influences the rate and direction of innovation in academic research, see Murray and Stern (2007) and Williams (2013). While empirical work on this topic is scant, the perception in the software industry is that bigger companies do not pledge their most important patents (Bort 2010).
6 Larger firms who offer products under an OSS license frequently do have IPR holdings for complementary technologies that
3 such an IP strategy should have the greatest impact on OSS entry in environments with high licensing and litigation costs, such as when innovations are highly cumulative and when IPR ownership (particularly patent ownership) is highly concentrated.
To test these hypotheses, we gather data on OSS entry by US start-up firms who produce prepackaged software and who are included in the CorpTech Directory of Technology Firms. OSS entry was identified using longitudinal press releases contained in the Gale database “PROMT”. Our key measure of the extent of IBM’s IP support for OSS is based on the number of claims-weighted patents pledged in The Commons in 2005 in each software market. Following prior work that has examined the extent to which patents deter entry into the software industry (Cockburn and MacGarvie 2009, 2011), we allocate patents to software product markets based upon the technological classes of patents and their keywords.
Using count data conditional fixed effects models, our empirical strategy examines whether time series variation in the number of patents contributed to The Commons related to a narrowly defined software market is associated with changes in the amount of OSS entry into that market. Our results show that a 10% increase in The Commons’ patent claims in a software market is associated with an average 1% to 3% increase in the rate of OSS entry by start-ups into that market. However, introduction of The Commons influences entry especially in those markets where innovations are highly cumulative and where patent ownership is concentrated. As market cumulativeness increases from the 10th to the 90th percentile, the marginal effect of a 10% increase in The Commons’ patent claims on OSS entry increases from 0.6%-1.3% to 4.0%-5.5%. Similarly, as market concentration increases from the 10th to the 90th percentile, the marginal effect of a 10% increase in The Commons increases from 0-1.7% to 1.5%-2.7%.
IBM’s pledge of patents to The Commons in 2005 represented an important shift in its explicit legal support of OSS. However, other events around the same time period also signaled an increase in this type of support. For example, on August 4, 2004 IBM publicly announced that it would not assert its patents against the Linux kernel. These events were clustered between 2003 and 2005, likely representing a response to the SCO Group’s lawsuit against IBM in early 2003. This clustering of events makes it difficult to identify the size and significance of each on entry behavior. Consequently, we do not seek to separately identify the effects of The Commons from other elements of IBM’s IP strategy, instead treating the Commons as a proxy for IBM’s coherent IP strategy in support of OSS. The key empirical advantage of this proxy is that it allows us to identify the patents that are relevant to the activity of OSS developers by technology and—through our concordance—software product segments.
A particular concern for measuring the impact of IBM’s IP strategy on startup entry is that pledged patents could be correlated with unobserved market characteristics or technological opportunities that vary over time. Through a variety of robustness checks, we circumscribe the nature of unobserved heterogeneity that could influence our results. In particular, we show that the effects of IBM’s IP strategy do not appear
4 prior to its lawsuit with the SCO group; we also show that growth in the number of patents contributed to The Commons is not associated with increased entry from products that should not see entry costs fall, namely products offered under a proprietary license. Last, our baseline results point to the nature of unobservables that would be needed to generate our results; namely, those that appear only in markets with high cumulativeness and concentration.
2. Theoretical Framework
2.1. IP strategy in a private-collective model of innovation
Patent thickets are overlapping patent rights that require firms to obtain licenses from multiple patent holders in order to commercialize new technology (Shapiro 2001). They can increase at least three broad types of sunk costs of entry for start-ups: (1) the costs of inventing around existing patents; (2) the costs of infringement, which may include the costs of licensing the infringed technology and the costs of litigation such as acquiring a defensive patent portfolio as well as injunction and damages; and (3) the transaction costs of acquiring patents owned by others.
While firms that have a large patent portfolio may be able to navigate the patent thicket through cross-licensing their own patents with those of other IPR holders, this strategy will be harder to implement for small firms appropriating value from OSS. Firms that rely on the OSS community for innovation inputs need to conform to the norms of the OSS developers, who are often philosophically opposed to software patents, considering them antithetical to the spirit of freedom that imbues OSS development (Marson 2004, Schultz and Urban 2012, Stallman 2011).7 Further, the costs of writing and administering patents may be too high for small firms relative to their benefits. For example, they may have insufficient resources to hire legal staff.
As has been noted elsewhere, incumbent firms with significant patent portfolios and who use traditional appropriability mechanisms to commercialize new technologies in other settings will sometimes also contribute to open source communities under a so-called “private-collective model of innovation” (von Hippel and von Krogh 2003). Under this model, incumbent firms may contribute to public goods such as OSS. While they may be unable to appropriate value directly from the public good, they may be able to create and appropriate value from complementary products and services such as downstream application software that interfaces with open source or support for OSS.8 While such firms may be able to navigate patent thickets by using their own patent holdings in cross-licensing agreements, the inability of other small
7 OSS firms may even fear the existence of patents that are even pledged to the community for purely defensive purposes; while
the initial motivates may be altruistic, it remains possible that the original patent holder may have a change in strategy, in particular a change in ownership or management may initiate a change in how patents are used within the organization (e.g., Schultz and Urban 2012).
8 For example, Fosfuri et al. (2008) find that firms will be more likely to produce OSS products when they have large stocks of
5 firms to similarly navigate the thicket may reduce the extent of complementary innovation and in so doing reduce the value of the public good.
We explore whether a large firm’s IP strategy can reduce the costs of patent thickets and so stimulate complementary innovation. One institutional mechanism that these incumbents can use is to pledge patents for use within the OSS community; that is, to promise not to assert their IPR against products produced under an OSS license. Such patent pledges can be used by large private-collective (p-c) innovators to prevent competing proprietary firms from exercising their IPR against p-c innovation and thereby limit production of the public good (Alexy and Reitzig 2013). The incentives to pledge increased on March 7, 2003, when the SCO Group filed a $1 billion lawsuit against IBM, asserting some of its copyrighted UNIX software was wrongly copied into Linux by IBM.
These contributions go beyond the requirement that contributors to OSS products automatically grant a license to use, modify, and redistribute contributed code to all other legitimate users of the code. They also extend to complementary technologies that may be used in conjunction with existing OSS products. Besides the foregone profits from not enforcing the patents, if the contributors want to continue using the patents to support OSS but exclude proprietary firms, they would also bear an explicit cost of maintaining and renewing the patents.
Patent pledges can have direct and indirect benefits to the OSS community. For the start-up firms that we study (i.e., those that intend to enter into a market with OSS products), one direct benefit will be the reduction in expected invention and licensing costs related to the contributed technology. Instead of inventing around, start-ups can directly use the technology contributed by incumbents. Moreover, as more patents are made available, it is more likely that the start-ups will use the pledged patents to substitute for protected technologies that may block entry but are not pledged. This sometimes reduces the costs of transacting and negotiating, especially if the blocking patents are held by many different holders. Further, an increase in incumbents’ contributions will signal their commitment to generate profits as a p-c innovator through the production of complementary goods and services, rather than through direct enforcement of IPR. While the contributor retains the right to enforce other patents not included in the contribution, doing so would harm its reputation to the OSS community, decreasing its ability to create and appropriate value as a p-c innovator. As a result, the perceived threat of litigation will decline, or, to use a widespread terminology among software industry practitioners, there will be less “fear, uncertainty, and doubt” (FUD,
cf. Auza 2011).
There may be other indirect benefits. Pledging patents may encourage reciprocal behavior from other industry participants that may benefit p-c innovation (Alexy and Reitzig 2013). For example, other firms involved in p-c innovation may also choose to pledge patents for use by the community, and may acquire additional patent rights to prevent proprietary innovators from acquiring the same and using them
6 against the community. As more patents in a technology area are pledged, it is more likely to create norms of non-enforcement and encourage other p-c innovators’ contribution. One way to view this result is through the lens of public goods. The contribution of patents represents a commitment not to assert IPR with the goal of fostering the development of new software by entities who are unable to protect themselves against IPR enforcement by traditional means. This goal is more likely to be accomplished when contributions are made by multiple firms. However, in an asymmetric information environment, firms have an incentive to under-contribute (Coase 1960). To provide the public good, actors with high valuations must contribute more than those with lower valuations (Mailath and Postlewaite 1990). In our setting, this corresponds to firms with large patent holdings, and who can appropriate more value through complementary innovation, contributing more than other firms. Thus, the likelihood of forming a sufficient public good of pledged patents will be increasing in the large firm’s initial contribution.
An incumbent’s IP strategy may include other measures to help other firms to navigate patent thickets and to stimulate complementary innovation. For example, IBM took several measures after the SCO Group filed its initial lawsuit in March 2003. IBM provided a detailed point-by-point answer to SCO’s complaint as early as April 2003. It then filed a countersuit against the SCO Group in August 2003, stating in its complaint that “These counterclaims arise from SCO’s efforts to wrongly assert proprietary rights over important widely used technology by the open-source community” (The SCO Group, Inc. v. IBM 2003). These actions had broader support within the Linux community (Krazit 2003). Another significant event was IBM Senior Vice President Nick Donofrio’s announcement made on August 4, 2004 that IBM would not assert its patents against the Linux kernel (Scannell 2004).9 IBM, in collaboration with the Open Source Development Labs, also created an OSS legal defense fund in January 2004 to indemnify customers of OSS who were targeted by the SCO Group (Rooney 2004).
Other major Linux distributors also took action around the same time period. Red Hat filed a lawsuit against the SCO Group, alleging the SCO Group spread FUD about Linux and requesting a permanent injunction restraining the SCO Group from representing that Red Hat’s Linux products and/or the Linux products of Red Hat’s customers and partners violated any of the SCO Group’s IP or trade secrets rights (Red Hat, Inc. v. The SCO Group, Inc. 2003). Similar to IBM, Red Hat also set up a legal fund to defray costs incurred by the OSS community (Novell 2004; Red Hat 2006), and promised to indemnify its customers against litigation related to the use of covered OSS products (Shankland and Kanellos 2003).
In sum, we expect that patent pledges and other IP actions in support of OSS will effectively reduce licensing costs and litigation threats for the OSS community, including the start-ups that intend to enter into a market with new OSS products and their potential customers. These benefits will be increasing in the
9 It is believed that this announcement was made in response to a finding by the Open Source Risk Management organization that
7 amount of legal resources that are made available to the OSS community. It is also worth noting that these positive effects on OSS entry will be reinforced as firms enter and produce complementary OSS products. These complementary products would create a platform of interlocking components, which increases the value of OSS products and services to potential buyers and thus further facilitate entry.
2.2. How the impact of IP strategy varies with market characteristics
In the previous section we showed how a firm’s IP strategy can promote OSS entry by reducing expected invention costs or by alleviating infringement costs and transaction costs of negotiating with patentees. In this section we explore market circumstances where the effects of such a strategy on reducing entry costs, and so encouraging entry, will be greatest.
A body of literature has attempted to quantitatively characterize patent thickets in specific technology areas and examined their implications for innovation and competition (Hall et al. 2012, von Graevenitz et al. 2011, Ziedonis 2004). We focus on two observable dimensions of patent thickets that influence the ex-ante costs of entry. The first is the cumulativeness of innovation, which has been defined as the extent to which an innovator builds on prior developments and discoveries (e.g., Green and Scotchmer 1995, Scotchmer 2004: 127). In an environment with high cumulativeness, the boundaries of potential blocking patents are usually blurred. This makes it difficult to build upon existing patents and leads to high costs of inventing around. Further, the presence of many cumulative innovations also suggests high infringement and transaction costs, as start-ups could easily infringe and may need to obtain licenses for a large set of related patents to enter into a technology space.10 Therefore, because patent pledges and associated actions could reduce these costs, their effects on OSS entry will be greatest in environments where these ex-ante costs are highest, as is the case for environments with cumulative innovations.
The second market characteristic that we study is the concentration of patent ownership within a software market, defined as the extent to which patents are distributed across different holders. Two views have recently been set forth about how patent ownership influences the costs of licensing negotiations. One view holds that increases in fragmentation of patent ownership (i.e., decreases in concentration of patent ownership) will increase the transaction costs of licensing patents, creating an “anti-commons” effect (Heller and Eisenberg 1998). Under this view, when there are many small exclusionary patents held by many firms, the transaction costs of coming to terms with many patent holders will influence a firm’s strategic response to potential expropriation risks. For example, firms may patent more aggressively when
10 It is worth noting that the “cumulativeness of innovation” in our context is different from the “royalty stacking” discussed by
Lemley and Shapiro (2007). Royalty stacking refers to situations in which a single product potentially infringes on many patents, and thus the royalty rate to one patent holder is affected by the rates to the holders of other patents reading on that product. While high cumulativeness also suggests an innovation is built upon many others, it does not focus on the interaction among the potential licensee and many patent holders, and the resulting royalty rate. We will focus on this in the next paragraph—how the ownership of existing patents affects the costs of licensing negotiations faced by a start-up.
8 patent ownership is fragmented (Ziedonis 2004). In sum, under this perspective, the transaction costs of acquiring patents owned by others are particularly high when patent ownership is fragmented.
Recent work has challenged the anti-commons view. Under this view, concentration of patent ownership increases the value of the negotiation for the patent holder, resulting in an increase in incentives to litigate (Galasso and Schankerman 2010, Lichtman 2006). Alternatively, when the innovator needs to obtain licenses from a large number of patentees, the value at stake in each negotiation is smaller so licensors are less likely to litigate (Lichtman 2006). Galasso and Schankerman (2010) formalize this intuition, showing in the context of a bargaining game that fragmentation reduces the negotiation value of a patent that is potentially infringed and reduces the time to settlement in a patent dispute. In short, under this second view, the expected costs of infringement are highest when patents are highly concentrated, and patent pledges and associated actions in support of OSS will have a particularly strong effect in reducing entry costs. We will allow the data to inform which of these alternative views shapes our results, and so indirectly contribute to the ongoing debate on fragmentation of patent holdings and litigation risk.
3. Research Setting
As noted above, the context for our study is IBM’s IP strategy and its implications for innovation in OSS between 1999 and 2009. IBM’s IP strategy over this period is consistent with its overall strategy of support of OSS that started toward the end of the 1990s (Campbell-Kelly and Garcia-Swartz 2009, Capeck et al. 2005, Samuelson 2006). IBM initially announced its commitment to Linux in 1999, and in 2001 announced that it would invest $1 billion over the following three years to make Linux more suitable for enterprise applications (Campbell-Kelly and Garcia-Swartz 2009). Since then, IBM has made all of its hardware platforms compatible with Linux, released Linux versions of its software products, and developed Linux-focused service capabilities. IBM explicitly supports OSS to promote open standards in areas that are complementary to its profitable businesses (Capek et al. 2005). Over time, it has focused less on operating systems that might compete with open source alternatives, and focused more on developing and marketing middleware or application software. IBM’s business model now focuses on selling high end hardware, proprietary software running on top of Linux, and systems integration and other customized services to enterprise customers (Samuelson 2006).
As noted above, there are several events that capture IBM’s explicit legal IP support for OSS throughout our sample period (1999 to 2009, as explained below). While these events are expected to have some value for producers and users of OSS software, most of them are ambiguous about the extent of IBM’s commitment to specific software markets. This creates both uncertainty for market participants about the value of these commitments, as well as difficulty for the econometrician in measuring the effects of IBM’s IP strategy on software markets.
9 contributions to the Open Source Development Labs’ Patent Commons project (commonly referred to as “The Commons”). In January 2005, IBM pledged access to 500 software patents to “any individual, community, or company working on or using software that meets the Open Source Initiative (OSI) definition of open source software now or in the future.” Subsequent to IBM’s action, several other incumbents pledged an additional 29 patents to The Commons.11 “Pledge” in this context means that “patent holders agree they will not, under certain terms and conditions, assert patent rights against third parties who are engaging in activities that might otherwise give rise to a claim of patent infringement.”12 IBM announced in its press release that it believed this was the largest patent pledge of any kind. All pledged patents are explicitly listed on an online public database, and users of the technologies embedded in the patents are not required to sign any formal agreement with The Commons.
Our choice of The Commons as the focus of our analysis is guided by several factors. The Commons specifies contributed patents at a very detailed level, listing each of their patent numbers. Thus, it provides a quantifiable measure of IBM’s commitment to different software markets. The Commons is economically important in the sense that it comprises a large collection of patents across multiple software technology markets, allowing us to use variation over time within software markets for identification. Further, The Commons was introduced in 2005, allowing sufficient time to observe changes in entry behavior after its introduction. In short, our focus on The Commons constitutes a measurement strategy for the implications of IBM’s IP strategy on innovation in a market.
4. Data 4.1. Sample
Our sample consists of 2,054 start-up software firms from the 2004 and 2010 editions of the CorpTech Directory of Technology Firms13 (denoted as CorpTech 2004/2010 hereafter) that primarily operate in the US prepackaged software industry. As noted above, the focus of our study is on start-up firms. As a result, we restrict our sample to firms that were founded after 1990 and that have fewer than 1000 employees and less than $500 million in annual sales.14 Our sample period is from 1999 to 2009, with 6 years before the establishment of The Commons and 5 years after. We believe this time window is sufficiently long to capture the impact of The Commons on OSS entry.
4.2. Identifying software markets and the matching patent classes
11 Example companies include Computer Associates International Inc. and Open Invention Network, LLC. 12 For more details, see http://www.patent-commons.org/resources/about_commitments.php.
13 Our choice of 2010 CorpTech data reflects a constraint with the data—we have contacted CorpTech and there are no historical
data from 2005 to 2009, the core years of our sample period. The combined use of CorpTech 2004 and 2010 is meant to address potential survivor bias.
14 If the sample firms are from CorpTech 2010 (2004) directory, the data on year founded, sales, and number of employees we used
to identify start-up firms are directly obtained from CorpTech 2010 (2004) directory. Our results are robust to the use of alternative thresholds for inclusion in our sample. For example, our results are robust to an alternative sample of start-ups that includes firms founded after 1990 that have fewer than 500 employees and less than $100 million annual sales.
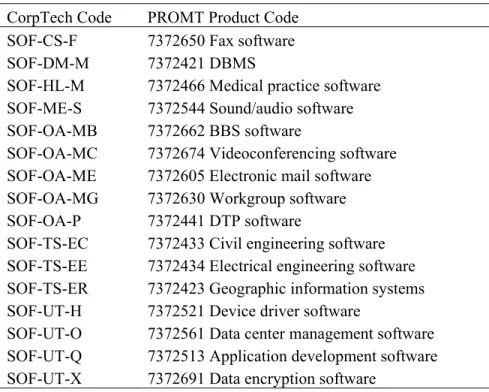
10 We use the product code classification system embedded in the Gale database “PROMT” (Fosfuri et al. 2008) as our primary source to define software markets. Because of certain drawbacks of only relying on the PROMT classifications (we describe these in further detail in Appendix A), we further match PROMT’s software-related product categories with CorpTech’s “SOF”product classes to create a PROMT-CorpTech concordance so that each PROMT software product code is associated with a detailed set of keywords. The keywords for each product class are used to (i) manually assign PROMT product codes to PROMT news articles with missing codes and (ii) match software markets with the most relevant patent classes as described below.
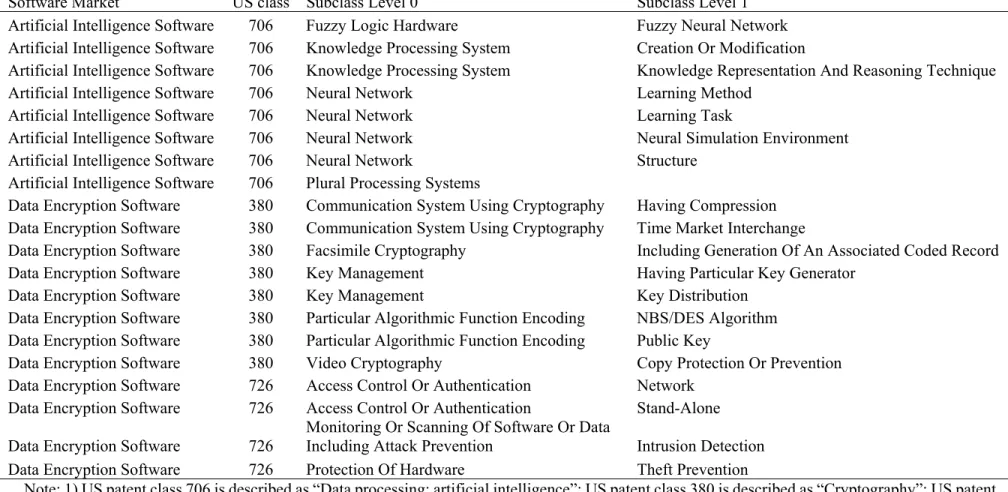
An important part of our data construction involves matching product markets to patents. This allows us to identify both the cumulativeness of innovation and the concentration of patent ownership in a software market. As is well-established in the literature, this type of matching is difficult (e.g., Griliches 1990, Silverman 1999). We follow Cockburn and MacGarvie (2006, 2011) and match software patents to CorpTech “SOF”product classes to create a patent-CorpTech concordance. Because our software markets are classified through PROMT categories, in order to create the final mapping between software markets and patent classes, we then combine the PROMT-CorpTech concordance and patent-CorpTech concordance to form the PROMT-patent concordance. The final concordance that we use in the empirical analysis consists of 33 software markets matched to 422 patent class-subclass combinations (see Appendix A for a detailed discussion of our data construction process).
5. Measures
5.1. Dependent variable: OSS entry
We measure OSS entry for software market j in year t as the number of events in which start-ups
introduce their first OSS product into that market and year. We use a three-step procedure to identify OSS entry in a software market based on the press releases of the 2,054 firms in the PROMT database. First, following the work by Fosfuri et al. (2008) and Bessen and Hunt (2007), we search for a set of keywords within PROMT articles to identify articles related to OSS. Appendix A includes the full set of keywords. Second, we manually read all search results that included words from the first step to identify new OSS
product introductions. We consider an article as an introduction of a new OSS product when the article indicated that either of the following took place: (i) the introduction of a new software product that offered one or more of its module(s)15 under an open source license (we label such modules as open source
modules); and (ii) the introduction of a new version of an existing software product with open source
modules. Third, to identify OSS entry, we keep only the events in which the start-up introduced an open
15 In software, a module is a part of a program. A software product is composed of one or more modules that are linked together
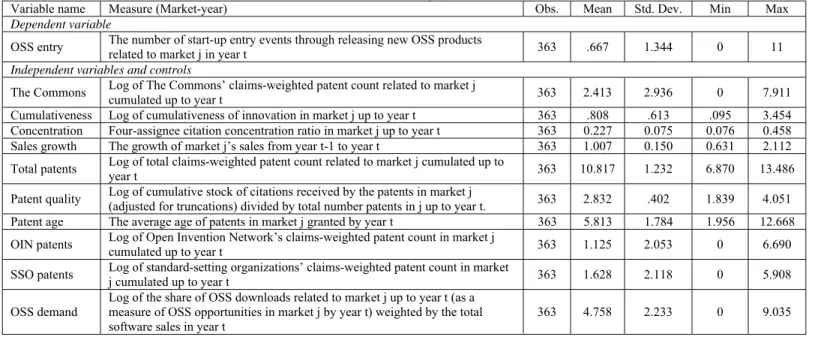
11 source module into a market in which it did not previously have OSS products. In total, we have 242 new OSS product entry events made by 85 start-up firms from 1999 to 2009.16 We aggregate these new OSS product entry events by software market and year. The data are structured as a balanced panel. Table 1 includes a brief description of measures and summary statistics for the main variables used in our empirical analysis.
Table 1: Summary Statistics
Variable name Measure (Market-year) Obs. Mean Std. Dev. Min Max
Dependent variable
OSS entry The number of start-up entry events through releasing new OSS products related to market j in year t 363 .667 1.344 0 11
Independent variables and controls
The Commons Log of The Commons’ claims-weighted patent count related to market j cumulated up to year t 363 2.413 2.936 0 7.911
Cumulativeness Log of cumulativeness of innovation in market j up to year t 363 .808 .613 .095 3.454
Concentration Four-assignee citation concentration ratio in market j up to year t 363 0.227 0.075 0.076 0.458
Sales growth The growth of market j’s sales from year t-1 to year t 363 1.007 0.150 0.631 2.112
Total patents Log of total claims-weighted patent count related to market j cumulated up to
year t 363 10.817 1.232 6.870 13.486
Patent quality Log of cumulative stock of citations received by the patents in market j
(adjusted for truncations) divided by total number patents in j up to year t. 363 2.832 .402 1.839 4.051
Patent age The average age of patents in market j granted by year t 363 5.813 1.784 1.956 12.668
OIN patents Log of Open Invention Network’s claims-weighted patent count in market j cumulated up to year t 363 1.125 2.053 0 6.690
SSO patents Log of standard-setting organizations’ claims-weighted patent count in market j cumulated up to year t 363 1.628 2.118 0 5.908
OSS demand Log of the share of OSS downloads related to market j up to year t (as a measure of OSS opportunities in market j by year t) weighted by the total software sales in year t
363 4.758 2.233 0 9.035
5.2. Independent variables
The Commons. This variable is equal to the log of claims-weighted patent counts in The Commons related
to software market j in year t. We use the claims-weighted count to measure the size of The Commons for
several reasons. First, since one potential effect of The Commons is to reduce invention and licensing costs for start-ups, using a claims-weighted measure may more precisely capture the scope of technologies contributed by the incumbent. In particular, as noted in Cohen and Lemley (2001: p. 6), “the scope of a patent is defined by its claims, which set out each element of the invention”.17 Moreover, since patent claims reflect an inventor’s effort to make the patent more resistant to invalidation challenges (Allison et al. 2004, Bessen 2008), the number of claims may serve as a proxy for patent value. In short, by weighting by claims, we will be able to better capture variance in the value and scope of patents contributed to The Commons. We further take the logged value of this variable to reduce skewness.
Cumulativeness. This variable refers to the cumulativeness of innovation within market j in year t.
We use patents’ backward citations, which provide information about “existing ideas used in the creation
16 This procedure implicitly assumes there is no OSS entry by firms prior to 1999. We believe this assumption is supported by
empirical evidence. For example, SourceForge, a major repository of OSS, was started in November 1999.
17 While we use patent claims as a proxy for patent scope, we by no means argue that the correlation is necessarily positive. For
12 of new ideas” (Caballero and Jaffe 1993) and indicate “some form of cumulative technological impact” (Jaffe et al. 1998). Following Clarkson (2005), we measure it based on the average propensity for patents in market j and year t to backward cite patents within the same market j. This is roughly similar to the way
economists have measured the cumulative nature of innovation at the firm level, e.g. using the extent to which firms self-cite their own patents (Hall et al. 2005). In our setting, we proceed as follows. If we sort the N patents within a software market j chronologically (with m=1 being the oldest patent and m=N being
the youngest), the cumulativeness for each patent n (i.e., the propensity for patent n to cite preceding patents
within the same market) is calculated as C ∑ , where is a dummy variable equal to one if patent n back-cites patent m, and zero otherwise (with both patents belonging to the same market), (n-1) is
the total number of possible citations, and n>1, since C1 is undefined. In other words, the cumulativeness
of a focal patent in market j is based on the share of potential backward citations to patents belonging to the
same market that are actually cited by the focal patent. The cumulativeness of innovation for software market j is then the average of all N-1 patents’ cumulativeness: C ∑ ∑ . This measure varies
over time based on the grant year of the market j patents under consideration.18 Notice that the older patents
in a market tend to have greater cumulativeness since the potential number of patents that can be cited is smaller. As a robustness check, we also use an alternative weighting scheme, one that provides relatively lower importance to the cumulativeness measure of older patents. As in Clarkson (2005), it is calculated as C ∑ ∑ / . For both measures, we take the logged value to reduce skewness.
Concentration. This variable indicates the extent of concentration of patent ownership in a market.
Following Noel and Schankerman (2006) and Cockburn and MacGarvie (2011), we use the four-assignee citation concentration ratio to measure the concentration of patent ownership in a software market. Backward citations indicate the extent to which a technological area has already been covered by prior art, so the share of backward citations owned by an assignee suggests the extent to which the assignee holds existing patented technologies and therefore the importance of negotiating with the assignee. To construct this variable, we first calculate the number of citations made by patents in market j up to year t that are held
by the cited assignee n (denoted as ). Then we arrange in descending order. The total citations
owned by the four firms that received the top four largest number of citations made by patents in market j
in year t (i.e. the top four , where n=1,2,3,4) is ∑ .Thus, the four-assignee citation concentration
18 We acknowledge this measure also captures the extent to which knowledge is focused in a software market, which is slightly
different from how cumulativeness of innovation is defined in this study. As a result, there may exist some nuance in interpreting the empirical results based on this measure.
13 ratio for market j in year t is calculated as ∑_ , where total_citationsjt is the total number of
citations made by patents in market j up to year t.19
5.3. Control variables
Sales growth. One important factor that may correlate with both IBM’s IP actions and OSS entry
is the rate of market growth for software market j, which is proxied by the sales change from year t-1 to
year t in market j. Because we do not have CorpTech data between 2005 and 2009, we use the National
Establishment Time Series (NETS) Database to measure this variable. The NETS Database includes sales from over 100,000 US-based firms with primary SIC 7372. Roughly 4,500 software firms in the NETS data are assigned to one of the eight-digit SIC categories (e.g., 73729901) that correspond to eight broad categories in the software industry. We compute the yearly sales change for each of the eight SIC categories and then map them to our 33 software markets to approximate the overall sales growth for each market for a given year. Nevertheless, we acknowledge that one shortcoming of constructing sales growth in this way
is that because some of the broader SIC categories match to multiple markets, we are forced to assume the markets matched to the same SIC have the same growth rate each year.
Total patents. Although we are most interested in two of the most important features of patent
thickets—the cumulativeness of innovation and the concentration of patent ownership, the total number of patents related to a market has also been used as a measure of the density of patent thickets (Cockburn and MacGarvie 2011). We add this variable as an additional control and measure it using the cumulative number of granted patents that are not included in The Commons but related to software market j. To be consistent
with how we measure The Commons, we use the log of the claims-weighted patent count.
Patent quality. This variable is a control for the quality of patents in market j in year t. As has been
noted elsewhere, higher quality patents suggest superior technological capabilities possessed by existing incumbents in the market, which leaves less room for start-ups to innovate further. This variable is equal to the log value of the cumulative stock of citations received by the patents in market j (adjusted for truncations)
divided by total number patents in j up to year t.
Patent age. Given the way we measure cumulativeness, a market with older patents tends to have
higher cumulativeness. Therefore, we compute the average age of patents in market j granted by year t, and add this as a control.
Open Invention Network (OIN) patents. At the end of our sample period, another institution similar
to The Commons—OIN—was established. Similar to The Commons, OIN offers contractually royalty-free usage of its patents to OSS participants as long as users promise not to file suit against software associated with the Linux System. We do not focus on the implications of the introduction of this institution in our
14 main analysis as its late introduction during our sample period made it difficult to devise a statistical test with sufficient power. We measure this variable as the log of the claims-weighted patent count of OIN patents related to software market j cumulated up to year t.
Standard-setting organization (SSO) patents. As mentioned earlier, another important mechanism
to address the anti-commons problem is SSOs. Such institutions promote coordination of innovation by providing a forum for collective decision-making among firms, facilitating the introduction of standards (Rysman and Simcoe 2008). If any patent is incorporated into the standards, the patent owner can gain significant power to control the diffusion of such standards and even deter market entry (Shapiro 2001, Rysman and Simcoe 2008). To prevent this blocking effect, most SSOs require patent holders contributing to the standard to license their patents on “Fair, Reasonable, and Non-Discriminatory (FRAND)” terms. Firms can even choose to license their patents on royalty-free terms. We control for the incidence of SSO patents that are licensed royalty-free because we expect that such patents might also have some effect on OSS entry. Therefore, we collect all patents disclosed under royalty-free licenses by the major eight SSOs (e.g., IEEE, ITU) from 1971 to 2008 (Rysman and Simcoe 2008)20. We compute the claims-weighted patent count of the SSO patents that are distributed under royalty-free licenses and are related to software market
j cumulated up to year t.
OSS demand. While Sales growth controls for general market growth, the market demand for OSS
products may deviate from the demand for proprietary software products. Measurement of economic activity generated by OSS is difficult, as OSS is unpriced and economic value may frequently be generated in service, support, and complementary software production activity (Greenstein and Nagle Forthcoming; Lerner and Schankerman 2010). One potential source of data on investment and use of OSS would be to use OSS downloads at SourceForge.net (SourceForge). SourceForge, as the world's largest repository for OSS projects, provides more than 300 thousand OSS applications for free download. Such OSS applications are usually affiliated with one or more categories such as Business & Enterprise, Software Development, Database, etc. However, because SourceForge downloads are unpriced, they provide little indication of the potential economic value being created and the economic opportunity for entrants. Therefore, instead of using downloads directly as our measure of OSS demand, we use them as a way of weighting total economic activity in software.
In particular, we first manually match the categories defined by SourceForge to our 33 software markets. Based on this matching, we are able to map over 0.2 million OSS applications to the 33 markets. We then measure the share of OSS application downloads related to market j by year t by dividing the
cumulative downloads for the OSS applications related to market j by year t by the cumulative downloads
20 We are grateful to Tim Simcoe and Christian Catalini for allowing us to use their SSO patent data set. These data are available
15 for all OSS applications matched to the 33 markets by year t (denoted as Share of OSS downloadsjt). Second, the total economic activity in software in year t is measured by the total sales (in Million) from the NETS
database of firms that have primary SIC codes matched to the 33 markets in year t (denoted as Software Salest). Thus, OSS demand for market j in year t is equal to the log of Software Salest multiplied with Share
of OSS downloadsjt.
6. Empirical Strategies and Results
As noted above, we use IBM’s contributions to The Commons as a proxy for its commitment to supporting innovation in OSS. It is important therefore to assess the quality of these contributions. In this section, we first investigate the quality of patents in The Commons relative to comparison groups as well as how IBM allocated its contributions across different markets. We then document the characteristics of software markets that are associated with few or many of The Commons’ patents, and examine whether these characteristics differ before and after the formation of The Commons. Next, we try to measure the effects of IBM’s IP strategy by establishing a baseline relationship between OSS entry and the size of The Commons, and demonstrate how this relationship is influenced by the level of cumulativeness of innovation or patent ownership concentration in a market. We then show that our baseline results are robust to a variety of robustness checks.
6.1. Characteristics of software markets and patents in The Commons
We first compare patents in The Commons to similar market patents. Following the matching method employed by Thompson and Fox-Kean (2005), we pair each patent in The Commons with a randomly selected control patent that matches the primary classification of The Commons’ patent at the subclass level and that was applied for in the same year or within a one year window. As shown in Table 2a, there is no statistically significant difference between the two groups in terms of forward citations or backward citations. The patents in The Commons have lower number of claims than other market patents, suggesting The Commons may be less resistant to invalidation challenges (Bessen 2008).
We next compare the quality of The Commons’ patents contributed by IBM with other patents in IBM’s portfolio, using the same procedure described above. As shown in Table 2b, there is no significant difference in forward citations between the two groups. Consistent with the comparison with similar market patents, the patents in The Commons have a slightly lower number of claims than IBM’s other patents. The patents in The Commons also show a lower number of backward citations, which may suggest these patents are less derivative than comparable IBM patents (Lanjouw and Schankerman 2004). Nevertheless, the lower number of backward citations made by The Commons’ patents could also imply they are more subject to the challenges by prior art they possibly missed (Bessen 2008). In general, these comparisons suggest that while patents in The Commons may be less resistant to invalidation challenges, they have similar quality and may be somewhat less derivative.
16
Table 2a: Patents in The Commons compared to other similar market patents
Patents in The Commons Other similar market patents T-test
Obs. 517 517
Forward citations as of Dec 2004 Mean (Std.Err.) 11.393 (.683) 12.334 (.788) -0.903
Backward citations Mean (Std.Err.) 9.718 (.314) 9.739 (.394) -0.042
Claims Mean (Std.Err.) 17.321 (.496) 19.400 (.686) -2.458***
Note: 1) For each of the patents in The Commons, we randomly selected a control patent from all market patents that matched the primary classification of The Commons patent at the subclass level and that were applied for in the same year or within a one-year window of The Commons patent. 2) To eliminate the possibility that contributions to The Commons may result in an increase in forward citations, we only use forward citations that were received by December 2004 (i.e., prior to the initiation of The Commons in January 2005). Because 57% of the patents in The Commons were granted before 1998 and 97% of the patents were granted before 2002, we believe that concerns of truncation bias in citations will not be a major issue in this setting. 3) ***: significant at 1%.
Table 2b: IBM’s Patents in The Commons compared to IBM's other similar patents
IBM’s Patents in The Commons IBM’s other similar patents T-test
Obs. 407 407
Forward citations as of Dec 2004 Mean (Std.Err.) 11.044 (.784) 10.341 (.702) 0.668
Backward citations Mean (Std.Err.) 9.683 (.358) 11.545 (.509) -2.992***
Claims Mean (Std.Err.) 16.813 (.501) 18.646 (.612) -2.319**
Note: 1) For each of IBM’s patents in The Commons, we randomly selected a control patent from all of IBM’s patents that matched the primary classification of the focal patent at the subclass level and that were applied for within a one-year window of The Commons patent. 2) To eliminate the possibility that contributions to The Commons may result in an increase in forward citations, we only use forward citations that were received by December 2004 (i.e., prior to the initiation of The Commons in January 2005). Because all of IBM’s patents in The Commons were granted in year 1993, 1997, or 2001, we believe that concerns of truncation bias in citations will not be a major issue in this setting. 3) ***: significant at 1%, **: significant at 5%.
To investigate whether IBM’s IP support to OSS is consistent with its proprietary IPR portfolio, we then examine the distribution of The Commons’ patents pledged by IBM across 33 software markets, and compare it with the distribution of IBM’s proprietary patents holdings. Figure 1 suggests the two distributions are quite similar: IBM made the greatest number of contributions to the markets such as operating systems and utilities, disk/file management, and database software, followed by software development tools and system management software. Similarly, IBM’s proprietary patent holdings are also concentrated in those markets. In the online Appendix we also present data on the extent of cumulativeness and concentration across market segments (Figure B-1 and B-2).
17
Figure 1: Distribution of IBM’s patents in The Commons and IBM’s proprietary patent portfolio by market
Note: 1) For “IBM’s total patent portfolio”, the numbers on the horizontal axis are the percent of IBM’s proprietary patents that belong to one of the 33 markets in our data; for “Patents in the Commons”, they are the percent of IBM’s patents in The Commons that belong to one of these markets.
Last, we examine the characteristics of markets where the number of claims-weighted patents in The Commons is small (below the 25th percentile) and where it is large (above the 75th percentile), before and after The Commons was introduced. As reported by Table 3, in markets where The Commons patents are well represented, OSS entry is greater during both the pre-Commons and post-Commons period. However, during the pre-Commons period the sales growth is lower in markets where IBM was about to pledge a large number of patents to The Commons; it became greater in these markets after The Commons was established. In markets where The Commons patent are well represented, cumulativeness of innovation and patent quality are lower while patent ownership concentration and total number of market patents are greater, and these markets also contain younger patents. These differences persist before and after The Commons was introduced.
0% 5% 10% 15% 20% 25%
Electronic mail software Telephone management software Insurance industry software Geographic information systems Medical practice software Video server software Accounting, financial and business practice…
Videoconferencing software Fax software Foreign language translation software Printer support software Manufacturing and business process software Network security software Peripheral device drivers Image analysis Artificial intelligence software Engineering and scientific software Personal productivity Data encryption software Network software Voice communications software Computer data transfer software Personal multimedia productivity Internet software Desktop utilities Workgroup software Graphics software Network management software Systems management software Software development tools Database software Disk/file management software Operating systems and utilities
18
Table 3: Market characteristics in pre-Commons and post-Commons periods
Pre-Commons (1999-2004) Post-Commons (2005-2009)
Markets Where The Commons is small
Markets Where The
Commons is large T-test
Markets Where The Commons is small
Markets Where The
Commons is large T-test
OSS entry .278 (.100) 1.389 (.273) 3.823*** .155 (.055) 1.844 (.330) 5.045*** Cumulativeness 1.506 (.107) .552 (.045) -8.188*** 1.091 (.094) .326 (.029) - 7.745*** Concentration .213 (.011) .295 (.007) 6.729*** .182 (.012) .256 (.007) 5.557*** Sales growth 1.051 (.013) .985 (.021) -2.616*** .978 (.020) 1.041 (.028) 1.801** Total patents 9.392 (.154) 11.262 (.118) 9.667*** 10.286 (.136) 12.207 (.115) 10.806*** Patent quality 3.253 (.054) 3.121 (.031) -2.116** 2.665 (.045) 2.553 (.026) -2.156** Patent age 5.112 (.254) 4.448 (.181) -2.131** 6.495 (.350) 5.923 (.165) -1.475*
Note: 1) Markets where The Commons is small (large) are those where the number of claims-weighted patents in The Commons is below the 25th percentile (above the 75th percentile). 2) The definitions of these market characteristics are shown in Table 1. 3) ***: significant at 1%, **: significant at 5%.
6.2. Descriptive evidence
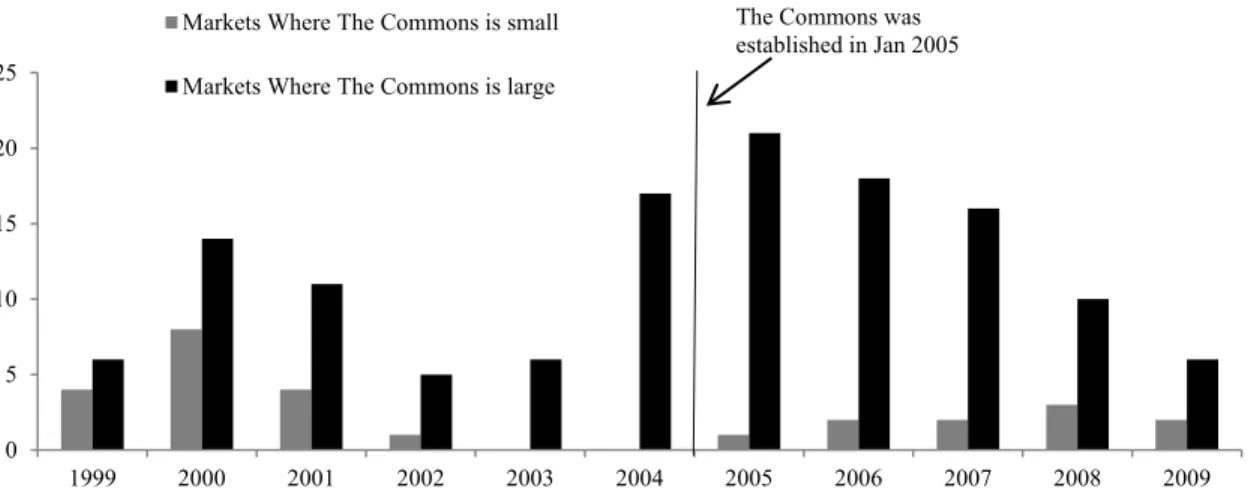
Before turning to our regression estimates, we first provide some descriptive evidence on patterns of entry in markets characterized by different levels of patents contributed to The Commons. Figure 2 shows that there is significant OSS entry after introduction of The Commons in markets where the number of claims-weighted patents in The Commons is large, while there is no change in OSS entry in other markets. Figure 3 motivate our results demonstrating differential benefits for The Commons in markets with high cumulativeness and concentration. Figures 3a and 3c show that there is little growth in OSS entry after the introduction of The Commons in all markets where The Commons has few patents. Figures 3b and 3d examine growth in entry in markets where The Commons is well represented; Figure 3b shows that the introduction of The Commons is associated with greater OSS entry but only in markets where innovation is cumulative, while Figure 3d shows that growth in entry post-Commons is higher in markets with high IPR concentration.
These results provide preliminary evidence that market segments with a large number of Commons contributions are associated with greater growth in entry, and this is particularly the case in markets with high cumulativeness and concentration. Of course, these results could reflect unobserved market-specific factors that are correlated both with contributions to The Commons and with OSS entry. For this reason we next turn to our model-based results.
6.3. Baseline results and robustness checks
Our baseline empirical strategy seeks to establish whether increases in the size of The Commons are associated with increases in OSS entry in related markets. The estimation framework is motivated by recent research that has studied how patent thickets influence market entry in the software industry (e.g., Cockburn and MacGarvie 2011). We model OSS entry using count data models with conditional fixed effects. Suppose the number of OSS entry events in software market j in year t (denoted as Yjt) follows a Poisson process with parameter λjt taking the form λjt = exp(Xjt’β). Also suppose αj is a market-specific and time-constant variable that incorporates unobserved heterogeneity across markets. Thus, the baseline
19 specification can be written as E(Yjt | Xjt , αj) = λjt = αj exp(Xjt’β), where Xjt’β = β1The Commonsjt + γ1PatentThicketjt-1+ γ2SalesGrowthjt + γ3MarketPatentsjt-1 + τt (1)
Figure 2: Average OSS entry by claims-weighted patents in The Commons
Notes: 1) Markets where The Commons is small (large) are those where the number of claims-weighted patents in The Commons is below the 25th percentile (above the 75th percentile). 2) Pre-Commons period: 1999 to 2004; Post-Commons period: 2005 to 2009. “Average OSS entry” is the average across all years in the pre- and post- period. 3) In markets with large size of The Commons, the t-test statistic for the mean difference between pre-Commons and post-Commons OSS entry is 1.313 with p-value 0.1.
Figure 3: Average OSS entry by claims-weighted patents in The Commons and cumulativeness of innovation/patent ownership concentration
Notes: 1) Markets where The Commons is small (large) are those where the number of claims-weighted patents in The Commons is below the 25th percentile (above the 75th percentile). 2) Pre-Commons period: 1999 to 2004; Post-Commons period: 2005 to 2009. “Average OSS entry” is the average across all years in the pre- and post- period. 3) Low vs. high cumulativeness/concentration is defined based on the median split for those variables. 4) For Figure 3b, in markets with high cumulativeness, the t-test statistic for the mean difference between pre-Commons and post-Commons OSS entry is 1.970 with p-value 0.04; for Figure 3d, in markets with high concentration, the t-test statistic for the mean difference between pre-Commons and post-Commons OSS entry is 1.311 with p-value 0.1.
The vector PatentThicketjt-1 includes the two patent thicket variables cumulativenessjt-1 and
concentrationjt-1; the vector MarketPatentsjt-1 includes Total patentsjt-1, Patent qualityjt-1, Patent agejt-1.The two vectors are lagged by one year to allow for any lagged effects on OSS entry. τt includes 10 year dummies to control for time-varying factors that may influence OSS entry. In the analyses that follow, we will consider the vectors PatentThicketjt-1, MarketPatentsjt-1, and the variable SalesGrowthjt to be our set of baseline controls. While OSS demandjt, OIN patentsjt, and SSO patentsjt may have a significant effect on OSS entry, these variables could themselves be correlated with omitted variables influencing entry. In particular, OSS demandjt, may be correlated with unobserved market characteristics that encourage IBM to
0 2 4 6 8 10 12 14
Pre‐Commons Post‐Commons
0 2 4 6 8 10 Low cumulativeness High cumulativeness Low cumulativeness High cumulativeness Pre‐Commons Post‐Commons
0 2 4 6 8 10 Low concentration High concentration Low concentration High concentration Pre‐Commons Post‐Commons
Figure 3a: Markets where The Commons is small
Figure 3b: Markets where The Commons is large
Figure 3c: Markets where The Commons is small
Figure 3d: Markets where The Commons is large
Markets where The Commons is small
Markets where The Commons is large
20 promote OSS development, such as future growth prospects in OSS or rapid technical change in specific types of OSS. Further, like The Commons, OIN patentsjt, and SSO patentsjt will reflect efforts by software firms (including, but not limited to, IBM) to lower transaction costs related to IPR infringement, and so may be affected by similar concerns about omitted variable bias as The Commons. As a result, these variables are excluded when estimating the baseline results. However, for all of the empirical models employed below, we test the robustness of the results by adding these controls and the regression results are included either in the paper or in the Online Appendix.
The baseline specification (1) is estimated using maximum likelihood with robust standard errors clustered at the market level. We are interested in the estimate for β1 which, if positive, will be consistent with our hypothesis. As noted earlier, we view The Commons as a proxy for IBM’s integrated IP strategy in support of open source, and our results should be viewed in that light.
In a perfect world, we could observe how random assignment of IBM patents to The Commons influenced entry across software market segments. Unfortunately, we do not have access to such an experiment. Ultimately, in our setting, IBM chooses both the timing of contributions to The Commons as well as their distribution across markets. As such, our regression estimates represent the equilibrium outcome of IBM’s contributions and the entry decisions of software firms. A particular concern, but not the only one, is that IBM may allocate its contributions to software markets that are expected to experience high growth.
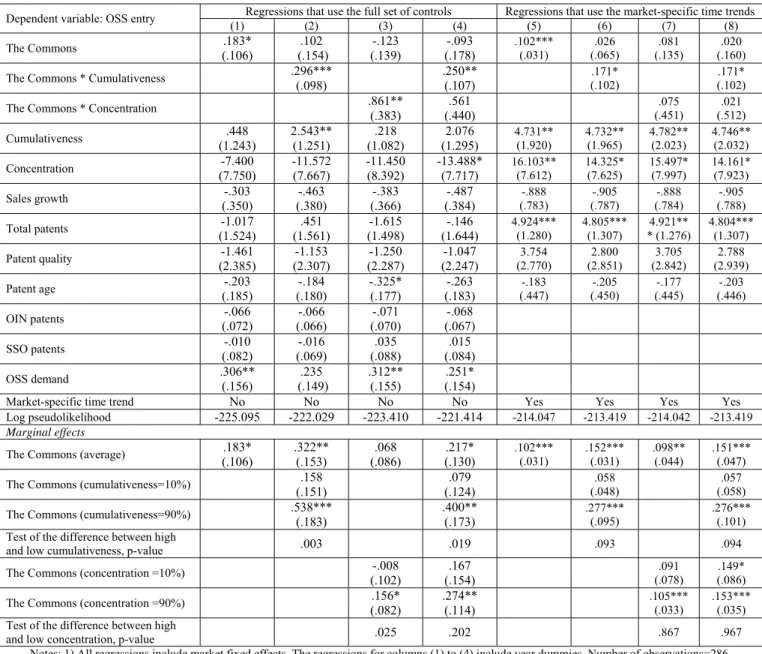
We provide additional evidence that is consistent with the interpretation that IBM’s IP strategy increased the net benefits to entry for potential OSS firms. We augment our regressions with a set of market-specific time trends to control for market growth and other time-varying market-level factors that may be inadequately addressed by our controls. We further study whether the effects of our proxy for IBM’s IP strategy, The Commons, appears when and where we would expect if we were to ascribe an interpretation where this strategy influenced entry behavior. We show that the timing of the measured effects of The Commons appears coincident with a series of actions that IBM took in support of OSS and in reaction to
the SCO v. IBM case in 2003. That is, the effects of The Commons do not appear prior to the initiation and
implementation of IBM’s integrated IP strategy. Further, we show that the market segments that are affected by The Commons are consistent with an interpretation of an IP strategy that sought to increase OSS entry. Namely, we show that increases in The Commons are associated with an increase in OSS entry but are not correlated with an increase in similar products offered under a proprietary license. Despite these efforts, we exercise caution when interpreting our results, as we do not possess a true exogenous variable that shifts contributions to The Commons.
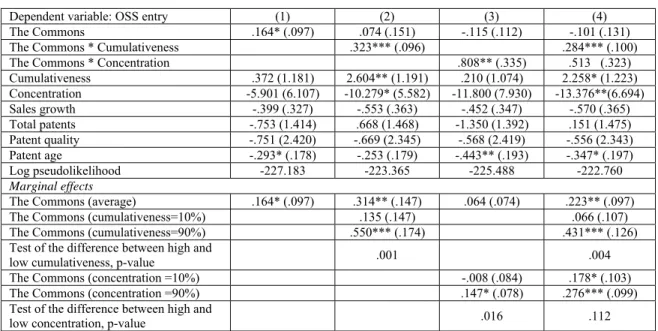
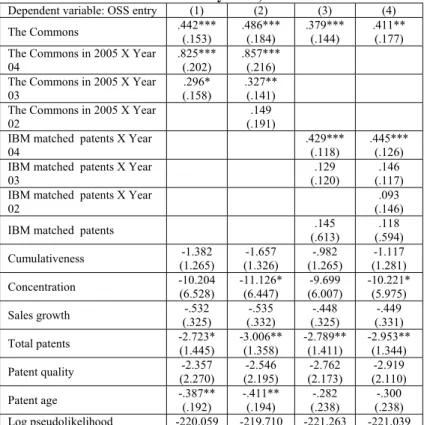
Column (1) in Table 4 reports the estimation results for specification (1) which includes baseline controls SalesGrowthjt, PatentThicketjt-1, and MarketPatentsjt-1 as well as market and year fixed effects. The
21 coefficient suggests that a 10% increase in The Commons’ patent claims related to a software market is associated with a 1.6% increase in OSS entry in that market.
We next investigate how the relationship between OSS entry and The Commons is influenced by the extent of cumulativeness of innovationand patent ownershipconcentration in a market. We begin by examining whether an increase in the size of The Commons is associated with a greater increase in OSS entry when the cumulativeness of innovation in a market is high. The baseline specification for Xjt’β becomes: Xjt’β = β1The Commonsjt + β2The Commonsjt*cumulativenessjt-1 + γ1PatentThicketjt-1 + γ2SalesGrowthjt + γ3MarketPatentsjt-1 + τt. (2)
We note that the nature of identification challenges in this regression is somewhat different than that in equation (1). Namely, our key identification assumption here is somewhat weaker—that changes in the claims-weighted patents in The Commons are not correlated with unobservable factors that influence entry that are differentially trending in markets with high cumulativeness and concentration. As shown in column (2) in Table 4, a 10% increase in the size of The Commons is associated with a 3% increase in OSS entry, with the effect computed at the average level of cumulativeness of innovation. Further, while an increase in the size of The Commons is not strongly related to an increase in OSS entry when cumulativeness is evaluated at the 10th percentile, a 10% increase in the size of The Commons is associated with a 5% increase in OSS entry when cumulativeness of innovation is at its 90th percentile. A test for the difference of the two marginal effects (at the 10th and 90th percentiles of cumulativeness) is statistically significant. As described earlier, we also constructed alternative measures of the cumulativeness of innovation and our results are robust to these changes.
We next explore how patent ownership concentration in a market affects the relationship between OSS entry and The Commons. The empirical results are in column (3) in Table 4. While The Commons is insignificantly associated with OSS entry when concentration is at its 10th percentile or at its mean value, a 10% increase in the size of The Commons is associated with a statistically significant 1.5% increase in OSS entry when concentration is at its 90th percentile. The test for the difference between concentration evaluated at the 10th percentile and the 90th percentile is statistically significant at the 5% level.
In column (4) of Table 4 we present the results of a specification including the interactions with both cumulativeness and concentration. In these models, a 10% increase in the size of The Commons is associated with a 4% increase in OSS entry when the cumulativeness of innovation is at its 90th percentile; a test of the difference between high and low level of cumulativeness is significantly different at the 1% level. In this specification, while there is no statistically significant difference between the marginal effects evaluated at the 10th and 90th percentiles of concentration, the sign for the interaction between The