ePrints Soton
Copyright © and Moral Rights for this thesis are retained by the author and/or other
copyright owners. A copy can be downloaded for personal non-commercial
research or study, without prior permission or charge. This thesis cannot be
reproduced or quoted extensively from without first obtaining permission in writing
from the copyright holder/s. The content must not be changed in any way or sold
commercially in any format or medium without the formal permission of the
copyright holders.
When referring to this work, full bibliographic details including the author, title,
awarding institution and date of the thesis must be given e.g.
AUTHOR (year of submission) "Full thesis title", University of Southampton, name
of the University School or Department, PhD Thesis, pagination
+
UNIVERSITY OF SOUTHAMPTON
Faculty of Engineering and the Environment
School of Civil Engineering and the Environment
A STUDY ON THE OPTIMAL PPP MODEL FOR TRANSPORT:
The Case of Road and Rail in South Korea
by
BYUNGWOO GIL
Thesis for the degree of Doctor of Philosophy
ABSTRACT
In recent decades the Public Private Partnership (PPP) has been widely regarded as an innovative way to construct transport infrastructures and to improve the quality of service. As the number of PPP cases has increased, many countries have tried to standardise PPP models to minimise the costs of trial and error. South Korea, where 426 PPP projects have been undertaken since 1994, usually preferred the BTO (Build-Transfer-Operate) model for transport. In the BTO model, the private sector recoups its investment by charging end users directly and hence should bear the traffic demand risk. However, the Korean
Government shared the demand risk through a minimum revenue guarantee to induce private sector involvement, and this led to many criticisms of the BTO model. Tariffs in the BTO case were much higher than those of public
operators, but the Government still had to pay large amounts of guaranteed revenue. Thus, BTL (Build-Transfer-Lease), where the demand risk is on the
public sector, has become an alternative model. The BTL is the “service sold to the public sector” model which is similar to the DBFO (Design-Build-Finance-Operate) in the UK. This thesis examines which of the BTO and the BTL PPP models is optimal to save governmental expenditure for transport
infrastructures such as road and rail. Appropriate traffic demand risk sharing, which a particularly controversial issue in South Korea, is explored. These research objectives are examined through five case studies: the Incheon Airport Expressway and the Oksan-Ochang Expressway cases for road PPP; the Incheon Airport Railway, the Daegok-Sosa Railway and the Seoul Metro 9 cases for rail PPP. Through a detailed literature review and five case studies, the thesis shows that the optimal PPP model, which is measured by the VFM (Value for Money) assessment, needs to satisfy the interests of public sector, private sector, and end users. Based on these assessments and including these three viewpoints, it is concluded that the optimal PPP model for road can be the BTL where the public sector can save expenditure or reduce the level of tariff. Traffic demand risk for roads is relatively low, so the public sector does not have to transfer it to the private sector with high profit rate. In the case of rail, the limited revenue and high cost make a project difficult to be financially free standing by the BTO model. However, the BTO can be a better option in urban rail if traffic demand risk is shared appropriately.
Table of Contents
ABSTRACT ... i
TABLE OF CONTENTS ... iii
LIST OF FIGURES ... ix
LIST OF TABLES ... xi
DECLARATION OF AUTHORSHIP ... xiii
ACKNOWLEDGEMENTS ... xv GLOSSARY ... xvii CHAPTER 1 INTRODUCTION ... 1 1.1BACKGROUND ... 1 1.2RESEARCH OBJECTIVES ... 3 1.3PREVIOUS STUDIES... 5 1.4RESEARCH SCOPE ... 8 1.5RESEARCH PROCEDURE ... 9
CHAPTER 2 THE PUBLIC PRIVATE PARTNERSHIP IN TRANSPORT ... 11
2.1INTRODUCTION ... 11
2.2THE CONCEPT OF THE PUBLIC PRIVATE PARTNERSHIP ... 12
2.2.1 Definition of the PPP ... 12
2.2.2 Advantages and disadvantages of the PPP/PFI ... 17
2.3THE MODELS OF THE PUBLIC PRIVATE PARTNERSHIP ... 21
2.3.1 The PPP models in the World ... 21
2.3.2 Classification of the PPP models... 26
2.4THE PUBLIC PRIVATE PARTNERSHIP IN TRANSPORT ... 28
2.4.1 The PPP projects for transport infrastructures ... 28
2.4.2 The PPP models for transport infrastructures ... 30
2.4.3 The appraisal for the PPP in transport ... 32
2.5CONCLUSION ... 34
CHAPTER 3 THE PUBLIC PRIVATE PARTNERSHIP IN TRANSPORT IN SOUTH KOREA 35 3.1INTRODUCTION ... 35
3.2TRANSPORT IN SOUTH KOREA ... 36
3.2.2 Investment plan for the transport infrastructure in South Korea... 39
3.2.3 Prospect of the PPP in transport in South Korea ... 40
3.3THE REGULATION OF THE PPP IN SOUTH KOREA ... 41
3.3.1 History of the PPP in South Korea ... 41
3.3.2 Regulation on PPP models ... 42
3.3.3 Regulation on the Minimum Revenue Guarantee ... 43
3.4THE PPP MODELS IN SOUTH KOREA ... 45
3.4.1 The BTO model ... 45
3.4.2 The BTL model ... 48
3.4.3 Difference between the BTO and the BTL model ... 49
3.4.4 Advantage and disadvantage of the BTO and the BTL model ... 51
3.4.5 PPP projects by model in South Korea ... 56
3.5FINANCIAL AND ORGANISATIONAL SUPPORT FOR THE PPP ... 57
3.5.1 Financial support for the PPP in South Korea ... 57
3.5.2. Organisational support for the PPP in South Korea ... 57
3.6THE APPRAISAL FOR THE PPP IN TRANSPORT IN SOUTH KOREA ... 58
3.7CONCLUSION ... 61
CHAPTER 4 RESEARCH METHODOLOGY ... 63
4.1INTRODUCTION ... 63
4.2AVAILABLE METHODOLOGY ... 64
4.3THE VALUE FOR MONEY ASSESSMENT ... 68
4.3.1 The concept of VFM assessment ... 68
4.3.2 Quantitative VFM assessment ... 69
4.3.3 Qualitative VFM assessment ... 74
4.3.4 Sensitivity analysis ... 78
4.4CASE STUDIES ... 81
4.4.1 The purpose of the case study ... 81
4.4.2 The selection of the case study ... 81
4.4.3 Methodological framework ... 84
4.5CONCLUSION ... 85
CHAPTER 5 CASE STUDY IN THE INCHEON AIRPORT EXPRESSWAY ... 87
5.1INTRODUCTION ... 87
5.2SUMMARY OF THE PROJECT ... 88
5.2.1 Details of the project ... 88
5.2.2 History of the project as a PPP ... 89
5.3QUANTITATIVE VFM ASSESSMENT ... 92 5.3.1 Basic assumption ... 92 5.3.2 Construction subsidy ... 93 5.3.3 Lease fee ... 93 5.3.4 Operating cost ... 95 5.3.5 Revenue ... 95
5.3.6 Summary of the analysis factors ... 95
5.3.7 Result ... 96
5.4QUALITATIVE VFM ASSESSMENT ... 98
5.4.1 Service quality ... 98
5.4.2 Contract and Management ... 99
5.4.3 Risk management ... 100 5.4.4 Operational flexibility ... 101 5.5SENSITIVITY ANALYSIS ... 102 5.5.1 Revenue ... 102 5.5.2 Stochastic analysis ... 105 5.6FINDINGS ... 108
CHAPTER 6 CASE STUDY IN THE OKSAN-OCHANG EXPRESSWAY ... 111
6.1INTRODUCTION ... 111
6.2SUMMARY OF THE PROJECT... 112
6.2.1 Details of the project ... 112
6.2.2 History of the project as a PPP ... 113
6.2.3 The appraisal of the project as a PPP ... 115
6.3QUANTITATIVE VFM ASSESSMENT ... 116 6.3.1 Basic assumption ... 116 6.3.2 Construction subsidy ... 116 6.3.3 Lease fee ... 118 6.3.4 Operating cost ... 119 6.3.5 Revenue ... 119
6.3.6 Summary of the analysis factors ... 120
6.3.7 Result ... 120
6.4QUALITATIVE VFM ASSESSMENT ... 123
6.4.1 Service quality ... 123
6.4.2 Contract and Management ... 123
6.4.3 Risk management ... 124
6.4.4 Operational flexibility ... 124
6.5SENSITIVITY ANALYSIS ... 125
6.5.2 Construction cost ... 127 6.5.3 Operating cost ... 128 6.5.4 Rate of profit ... 128 6.5.5 Inflation ... 129 6.5.6 Stochastic analysis ... 130 6.6FINDINGS ... 131
CHAPTER 7 CASE STUDY IN THE INCHEON AIRPORT RAILWAY ... 133
7.1INTRODUCTION ... 133
7.2SUMMARY OF THE PROJECT ... 134
7.2.1 Details of the project ... 134
7.2.2 History of the project as a PPP ... 135
7.2.3 The appraisal of the project as a PPP ... 135
7.3QUANTITATIVE VFM ASSESSMENT ... 137 7.3.1 Basic assumption ... 137 7.3.2 Construction subsidy ... 138 7.3.3 Lease fee ... 139 7.3.4 Operating cost ... 140 7.3.5 Revenue ... 140
7.3.6 Summary of the analysis factors ... 140
7.3.7 Result ... 141
7.4QUALITATIVE VFM ASSESSMENT ... 143
7.4.1 Service quality ... 143
7.4.2 Contract and Management ... 144
7.4.3 Risk management ... 144 7.4.4 Operational flexibility ... 145 7.5SENSITIVITY ANALYSIS ... 146 7.5.1 Revenue ... 146 7.5.2 Stochastic analysis ... 149 7.6FINDINGS ... 154
CHAPTER 8 CASE STUDY IN THE DAEGOK-SOSA RAILWAY ... 157
8.1INTRODUCTION ... 157
8.2SUMMARY OF THE PROJECT ... 158
8.2.1 Details of the project ... 158
8.2.2 History of the project as a PPP ... 159
8.3QUANTITATIVE VFM ASSESSMENT ... 160
8.3.2 Lease fee ... 160
8.3.3 Operating cost ... 161
8.3.4 Revenue ... 161
8.3.5 Subsidy ... 162
8.3.6 Summary of the analysis factors ... 164
8.3.7 Result ... 165
8.4QUALITATIVE VFM ASSESSMENT ... 167
8.4.1 Service quality ... 167
8.4.2 Contract and Management ... 168
8.4.3 Risk management ... 169 8.4.4 Operational flexibility ... 169 8.5SENSITIVITY ANALYSIS ... 170 8.5.1 Revenue ... 170 8.5.2 Construction cost ... 172 8.5.3 Operating cost ... 172 8.5.4 Rate of profit ... 173 8.5.5 Stochastic analysis ... 174 8.6FINDINGS ... 176
CHAPTER 9 CASE STUDY IN THE SEOUL METRO 9 ... 177
9.1INTRODUCTION ... 177
9.2SUMMARY OF THE PROJECT... 178
9.2.1 Details of the project ... 178
9.2.2 History of the project as the PPP... 179
9.2.3 The appraisal of the project as a PPP ... 181
9.3QUANTITATIVE VFM ASSESSMENT ... 183 9.3.1 Basic assumption ... 183 9.3.2 Construction subsidy ... 183 9.3.3 Lease fee ... 184 9.3.4 Operating cost ... 185 9.3.5 Revenue ... 185
9.3.6 Summary of the analysis factors ... 185
9.3.7 Result ... 186
9.4QUALITATIVE VFM ASSESSMENT ... 188
9.4.1 Service quality ... 188
9.4.2 Contract and Management ... 189
9.4.3 Risk management ... 190
9.4.4 Operational flexibility ... 191
9.5.1 Revenue ... 192
9.5.2 Stochastic analysis ... 195
9.6FINDINGS ... 199
CHAPTER 10 THE ANALYSIS OF CASE STUDIES ... 201
10.1INTRODUCTION ... 201
10.2THE MAIN FEATURES OF THE PPP MODELS IN ROAD AND RAIL IN SOUTH KOREA ... 202
10.2.1 The features of the PPP models in the view of the public sector ... 204
10.2.2 The features of the PPP model in the view of the private sector ... 206
10.2.3 The features of the PPP model in the view of the end user ... 207
10.2OPTIMAL PPP MODEL FOR ROAD IN SOUTH KOREA ... 209
10.2.1 Quantitative features of PPP models in road cases ... 209
10.2.2 Qualitative features of PPP models in road ... 212
10.3.3 Optimal PPP model for road in South Korea... 215
10.4OPTIMAL PPP MODEL FOR RAIL IN SOUTH KOREA... 216
10.4.1 Quantitative features of PPP models in rail ... 216
10.4.2 Qualitative features of PPP models in rail... 219
10.4.3 Optimal PPP model for rail in South Korea ... 221
10.5APPROPRIATE TRAFFIC DEMAND RISK SHARING ... 224
10.5.1 Role of traffic demand risk sharing in transport PPP ... 224
10.5.2 Appropriate traffic demand risk sharing in the BTO model ... 225
10.6POLICY RECOMMENDATION FOR SOUTH KOREA GOVERNMENT ... 228
10.6.1 Introduction of the BTL model for road ... 228
10.6.2 New approach to the BTO model for urban rail ... 228
10.6.3 Recommendation for an appropriate traffic demand risk sharing ... 229
10.6CONCLUSION ... 230
CHAPTER 11 CONCLUSIONS ... 231
11.1INTRODUCTION ... 231
11.2MAIN CONCLUSIONS ON THE RESEARCH OBJECTIVES ... 232
11.3CONTRIBUTION OF THE THESIS ... 237
11.4LIMITATION OF THESIS AND FUTURE RESEARCH ... 238
APPENDIX 1 Transport PPP projects in the UK ... 241
APPENDIX 2 Korean PPP projects ... 244
APPENDIX 3, 4 Summary and result of Interview on the PPP in South Korea ... 250
APPENDIX 5 Forecasted and actual traffic in rail of South Korea since 2000 ... 272
APPENDIX 6 Monte-Carlo Simulation by MS Excel 2003 ... 273
List of figures
Figure 1.1Research procedure ... 10
Figure 2.1Step by Step Guide to the PFI Process ... 16
Figure 2.2 Contractual structure of the PFI ... 20
Figure 2.3 PPP projects by transport sector in developing countries ... 28
Figure 2.4 Annual trends of PPP projects in transport in developing countries 29 Figure 2.5 The PPP models for transport infrastructures ... 30
Figure 3.1 Length of road in South Korea ... 36
Figure 3.2 Passengers and the length of urban rail ... 37
Figure 3.3 National rail systems including the high speed rail in South Korea 38 Figure 3.4 The plan for transport network in Korea in 2020 ... 39
Figure 3.5 History of PPP regulation of South Korea ... 41
Figure 3.6 Procedure of solicited BTO project ... 46
Figure 3.7 Procedure of unsolicited BTO project ... 47
Figure 3.8 Procedure of BTL project ... 48
Figure 3.9 Concepts of the BTO and BTL ... 50
Figure 3.10 Investment for PPP projects in Korea ... 56
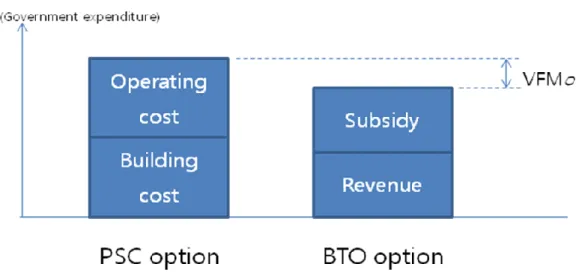
Figure 4.1 Basic concept of the VFM in the BTO model ... 71
Figure 4.2 Basic concept of the VFM in the BTL model ... 72
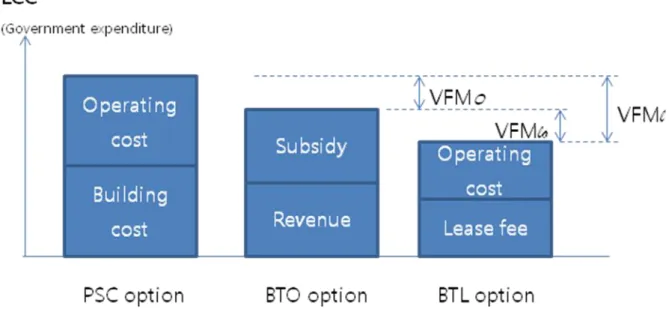
Figure 4.3 Basic concept of the VFM for comparing the BTL with the BTO option ... 72
Figure 4.4 Location of case studies ... 82
Figure 4.5 The methodological framework ... 85
Figure 5.1 Incheon Airport Expressway route map ... 88
Figure 5.2 Yeongjong Grand Bridge ... 90
Figure 5.3 Sensitivity analysis of the VFM to traffic ... 104
Figure 5.4 Inaccuracy of traffic forecast in expressway of South Korea ... 105
Figure 5.5 VFM by the probability of traffic forecast in the BTO with MRG option ... 106
Figure 5.6 VFM by the probability of traffic forecast in the BTO without MRG ... 107
Figure 6.1 The Oksan-Ochang Expressway line map ... 112
Figure 6.2 Toll gates in the PSC and the BTO option ... 114
Figure 6.4 VFM by the probability of traffic forecast in the BTO without MRG
option ... 130
Figure 7.1 Incheon International Airport Railway line map ... 134
Figure 7.2 Sensitivity analysis of the VFM to passenger ... 148
Figure 7.3 Inaccuracy of traffic forecast in rail of South Korea ... 150
Figure 7.4 Inaccuracies of traffic forecasts in 27 rail projects, 1969-1998 .... 151
Figure 7.5 VFM by the probability of traffic forecast in the BTO with MRG option ... 152
Figure 7.6 VFM by the probability of traffic forecast in the BTO without MRG option ... 153
Figure 8.1 The Daegok-Sosa railway line map ... 158
Figure 8.2 Status of BTO projects decided to proceed in Korea after 2006 ... 168
Figure 8.3 VFM by the probability of traffic forecast in the BTO without MRG option ... 175
Figure 9.1 The Seoul Metro route map ... 179
Figure 9.2 Upgraded facility and service of the Seoul Metro 9 ... 181
Figure 9.3 Life cycle cost of each PPP option by actual traffic ... 195
Figure 9.4 Frequency of VFM by the probability of traffic forecast in the BTO without MRG model ... 196
Figure 9.5 Frequency of VFM by the probability of traffic forecast in the BTO with MRG model ... 197
Figure 9.6 Frequency of LCC of the BTO case with the current MRG condition and the MRG of 56.5% condition ... 198
Figure 10.1 Probability of VFM by the traffic forecasting risk in South Korea 212 Figure 10.2 Probability of VFM by traffic forecast risk in the Incheon Airport Railway ... 218
Figure 10.3 Probability of VFM by the traffic forecast risk in the Seoul Metro 9 ... 219
Figure 10.4 Change of the LCC of the BTO and the BTL option by actual revenue ... 226
List of tables
Table 2.1 Potential advantages and disadvantages of the PPP/PFI ... 18
Table 2.2 PPP models by the stage of the project... 23
Table 2.3 PPP models by the ownership of facility ... 25
Table 2.4 Classification of PPP models by the way of repayment ... 27
Table 2.5 The PPP of European countries ... 31
Table 3.1 Private investment in national infrastructures in South Korea ... 40
Table 3.2 Change of MRG regulation ... 44
Table 3.3 Tax on the BOT and BTO model ... 45
Table 3.4 Difference between the BTO and the BTL ... 50
Table 3.5 Bidding status in BTO projects ... 53
Table 3.6 Bidding status in BTL projects ... 53
Table 3.7 Advantage and disadvantage between the BTO and BTL ... 55
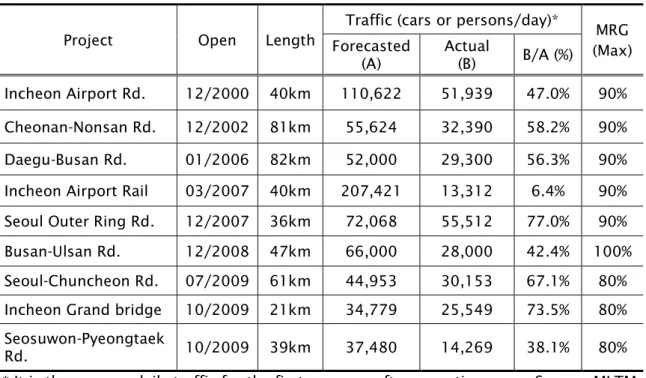
Table 3.8 Traffic forecast and MRG in transport PPP projects of the MLTM ... 59
Table 3.9 Tariff level of the PPP (BTO) expressways ... 60
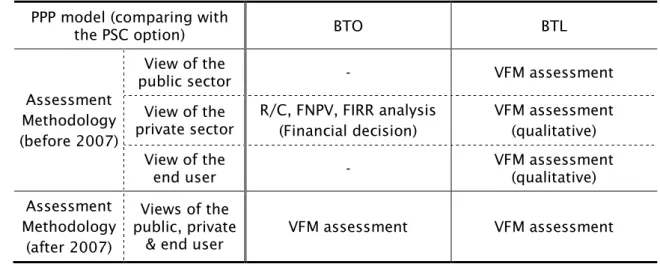
Table 4.1 Assessment methodology of the feasibility of the PPP in South Korea ... 67
Table 4.2 Summary of capital expenditure ... 70
Table 4.3 Issue and questions in the qualitative VFM assessment for the PPP 75 Table 4.4 Issue and questions in the qualitative VFM assessment for comparing the BTL with the BTO option ... 77
Table 4.5 Main features of five case studies ... 84
Table 5.1 Traffic volume of the Incheon Airport Expressway ... 91
Table 5.2 Toll prices of Public Expressway and the Incheon Airport Expressway ... 91
Table 5.3 Quantitative VFM assessment in the Incheon Airport Expressway ... 96
Table 5.4 Sensitivity of VFM to traffic in the BTO without MRG option ... 103
Table 5.5 Sensitivity of VFM to traffic in the BTO with MRG option ... 103
Table 6.1 Profit rate of expressway BTO projects proposed in the mid of 2000s ... 114
Table 6.2 Traffic forecast at the proposed toll level ... 117
Table 6.3 Building cost in the BTO, and the BTL case ... 118
Table 6.4 Traffic forecast considering toll price in the BTO and PSC ... 120
Table 6.6 VFM of various PPP options compared with the PSC ... 122
Table 6.7 Sensitivity of VFM to traffic ... 125
Table 6.8 Sensitivity of VFM to construction cost ... 127
Table 6.9 Sensitivity to operating cost ... 128
Table 6.10 Sensitivity to rate of profit (BTL) ... 129
Table 6.11 Sensitivity to rate of profit (BTO) ... 129
Table 6.12 Sensitivity to inflation ... 129
Table 7.1 Passengers of the Incheon Airport Railway ... 136
Table 7.2 Quantitative VFM assessment in the Incheon Airport Railway ... 142
Table 7.3 Out-turn value of construction and operation cost ... 146
Table 7.4 Sensitivity of the VFM to passenger without MRG... 147
Table 7.5 Sensitivity of the VFM to passenger with MRG ... 148
Table 8.1 Rate of profit of BTO road project in South Korea ... 162
Table 8.2 Rate of profit of BTO rail project in South Korea ... 162
Table 8.3 Construction subsidy from the government ... 164
Table 8.4 Quantitative VFM assessment in the Daegok-Sosa Railway ... 166
Table 8.5 Sensitivity to revenue ... 171
Table 8.6 Sensitivity to construction cost ... 172
Table 8.7 Sensitivity to operating cost ... 173
Table 8.8 Sensitivity to the rate of profit (BTL) ... 173
Table 8.9 Sensitivity to the rate of profit (BTO) ... 174
Table 9.1 Population density of major cities in OECD countries ... 178
Table 9.2 Project cost and construction subsidy for the Seoul Metro 9 PPP ... 180
Table 9.3 Comparison of operational employees and cost in the Seoul Metro 9 ... 181
Table 9.4 Quantitative VFM assessment in the Seoul Metro 9 ... 186
Table 9.5 Sensitivity to revenue in case without MRG ... 193
Table 9.6 Sensitivity to revenue in case with MRG ... 194
Table 10.1 Main interests of three stakeholders of the PPP in South Korea ... 203
Table 10.2 VFM of case studies in road ... 209
Table 10.3 Details of input factors in road case studies ... 211
Table 10.4 VFM of case studies in rail ... 216
Table 10.5 Rate of profit in rail cases ... 216
DECLARATION OF AUTHORSHIP
I, Byungwoo Gildeclare that the thesis entitled
A Study on the Optimal PPP model for Transport: The Case of Road and Rail in South Korea
and the work presented in the thesis are both my own, and have been generated by me as the result of my own original research. I confirm that:
this work was done wholly or mainly while in candidature for a research degree at this University;
where any part of this thesis has previously been submitted for a degree or any other qualification at this University or any other institution, this has been clearly stated;
where I have consulted the published work of others, this is always clearly attributed;
where I have quoted from the work of others, the source is always given. With the exception of such quotations, this thesis is entirely my own work; I have acknowledged all main sources of help;
where the thesis is based on work done by myself jointly with others, I have made clear exactly what was done by others and what I have contributed myself;
none of this work has been published before submission
Signed: ………..
Acknowledgements
It was a big challenge for me to do the Ph.D in England with my family after leaving the university in 1997 though I had been involved in several academic projects related with my work in transport field. It could be difficult to
complete my Ph.D thesis without the support of many people in England and South Korea.
Firstly, I would like to express my gratitude to Professor John Preston, my supervisor. His invaluable comments and advices on my research were always helpful, and I will not forget his kind supervision.
I also thank my family: My wife, Jisu Ahn, who recommended doing the Ph.D course and helped me lovely; my children, Changhyun and Yeonho, who helped me to be energetic as they were with me; my parents, Jeonggun Gil and Sukjin Song, who gave birth to me, my parents-in-law; Youngchan Ahn and Sukhee Heo, who loved me as a son. Especially, I would like to express my respect and gratitude to my father who has loved me and given endless energy regardless of his sickness.
There are many colleagues I have to thank. Dr. Taebyung Kim, Dr. Yongwook Lee, Dr. Heekyu Jung, Dr. Myungseop Lee, M.Phil Junhong Park, MSc. Seokju Bae, and Ph.D candidate Jihong Park helped me not only in study but also in life in England. I would like to thank Dr. Youngin Kwon in the Korea Transport Institute who helped me academically, and all members of TRG in the
University of Southampton. Miss Hong from MLTM helped to check my thesis as an English proof reader.
Finally, I would like to thank the Korean government which gave me a big chance to study abroad and supported my research. As a government official, I could access many essential data of the PPP projects in South Korea, and it was a big advantage to study deeply. In particular, I am thankful to all the people of MLTM who encouraged me to complete this thesis. I also give thanks to Ilchi Lee, who made the Dahn Yoga, and Jungeun Son, who is the Great Master of Suntao. Thanks to them, I could overcome many obstacles in my study and life.
GLOSSARY
ADB Asia Development BankAHP Analytic Hierarchy Process BBO Buy-Build-Operate BLOT Build-Lease-Operate-Transfer BOD Build-Operate-Deliver BOL Build-Operate-Lease BOO Build-Own-Operate BOT Build-Operate-Transfer BOOST Build-Own-Operate-Subsidize-Transfer BOOT Build-Own-Operate-Transfer BROT Build-Rehabilitate-Operate-Transfer BRT Build-Rent-Transfer
BRT Bus Rapid Transit BTL Build-Transfer-Lease BTO Build-Transfer-Operate CBA Cost Benefit Analysis
DBFO Design-Build-Finance-Operate DBO Design-Build-Operate
DBOM Design-Build-Operate-Maintain DBOT Design-Build-Operate-Transfer DCMF Design-Construct-Manage-Finance
DEDPI Detailed Engineering and Design Plan for Implementation EIB European Investment Bank
ESCAP Economic and Social Commission for Asia and the Pacific (UN) FBOOT Finance-Build-Own-Operate-Transfer
FI Finance Investor
FIRR Financial Internal Rate of Return FNPV Financial Net Present Value IRR Internal Rate of Return KDI Korea Development Institute KOTI Korea Transport Institute KRW Korean Won
LCC Life Cycle Cost
LDO Lease-Develop-Operate LBO Lease-Build-Operate LOO Lease-Own-Operate
MCDA Multi-Criteria Decision Analysis
MLTM Ministry of Land, Transport and Maritime affairs
MOCT Ministry of Construction and Transportation (now MLTM) MOSF Ministry of Strategy and Finance
MRG Minimum Revenue Guarantee NAO National Audit Office
NGO Non Governmental Organisation NPV Net Present Value
OJEU Official Journal of EU PFI Private Finance Initiative
PIMAC Public and private Infrastructure investment Management Center PPI Private Participation in Infrastructure
PPP Public Private Partnership PSC Public Sector Comparator ROT Rehabilitate-Operate-Transfer ROOT Rehabilitate-Own-Operate-Transfer RTL Rehabilitate-Transfer-Lease
R/C Revenue/Cost
RFP Request for Proposal SPC Special Purpose Company SPV Special Purpose Vehicle
SMG Seoul Metropolitan Government VFM Value for Money
CHAPTER 1
Introduction
1.1 Background
In recent decades the Public Private Partnership (herein after PPP) has been widely regarded as an innovative way to cope with rapidly increasing public demands on social infrastructures. Transport, which needs huge investment for construction in a short period, is one of the most invigorated sectors for the PPP (UN ESCAP, 2006). Moreover, the public services under the PPP scheme are expected to achieve higher quality of service by transferring risks and
responsibility to the sector which is more effective to control them (HM Treasury, 2008).
For this reason, more than 100 countries in the world have used the PPP for public services (PPIAF, 2011). In South Korea, the PPP has been used since 1994 when the PPP Act was legislated, though several public projects had been individually constructed by the private sector before 1994.
Though the aims of the PPP are similar, the forms of PPP vary from country to country according to their social and economic circumstances. As the number of PPP cases has increased, many countries have tried to standardise PPP models to minimise the costs of trial and error. The PFI (Private Finance Initiative) of the UK seems one of the most famous PPP schemes in the world, and some countries and researchers use that term as a synonym with the PPP (Chiu and Bosher, 2005, Drapak, 2009). South Korea also has a unique PPP scheme which is named the PPI (Private Participation in Infrastructure). With regard to the PPP models, which model to choose depends on the
circumstances of each country and the characteristic of a project. In the PPI scheme of South Korea, where 426 PPP projects have been
(Build-Transfer-Lease) models were mainly used for transport infrastructure projects (see Chapter 3). The BTO is a PPP model where the private sector builds a facility, transfers its ownership to the public sector and operates it for a specific period with the permission from the public sector. In the BTO model, the private sector recoups its investment by charging end users directly with the traffic demand risk. However, the Korean government shared the demand risk through a Minimum Revenue Guarantee (herein after MRG) to induce the private sector involvement, and this led to much criticism of the BTO model. The Incheon Airport Railway, which was the first BTO project for rail in South Korea, was sold to the public operator only after one year of operation because of low traffic demand. The Yongin Light Railway is in court because of a
discrepancy in demand risk sharing. The Busan-Gimhae Light Railway and the Uijeongbu Light Railway are anticipated to be in trouble with the same reason (Vivant, 2011). The recent global financial crisis affected the PPP market
negatively and it was worse for the BTO model where the demand risk is on the private sector (see Chapter 2).
Thus, the BTL (Build-Transfer-Lease), where the demand risk is on the public sector, is now suggested as an alternative model of the BTO for transport in South Korea. The BTL is a PPP model that the private sector builds a facility and transfers the ownership to the public sector. However the public sector gives the right to use it to the private sector for a specific period and the private sector leases it to the public sector again. In the BTL model, the private sector recoups its investment by the fee from the public sector for leasing. It is usually used for the public service with little income from the end user, so it was introduced to facilities like school without enough revenue for the private sector to make a profit (KDI, 2009b). The BTL model has not been used for road PPP, but the NABO (National Assembly Budget Office) of Korea suggested using the BTL model for road instead of the BTO model (Lee, 2005).
This thesis examines which PPP model out of the BTO and the BTL is optimal to save the governmental expenditure and to provide higher quality of service to the end users for road and rail in South Korea. For this examination, a method is newly suggested to compare the BTO and the BTL model. It also suggests the optimal traffic demand risk sharing, which is a key issue for the BTO model with MRG in South Korea.
1.2 Research Objectives
The purpose of this research is to find out an optimal PPP model between the BTO and BTL for road and rail in South Korea. Here, the meaning of ‘optimal’
can vary according to a view point. The PPP model saving the life cycle cost of the public sector, which reflects on the interest of tax payers, can be optimal to the public sector such as a government. On the other hand, the model giving higher return with lower risk can be optimal to the private sector. The model providing higher quality of service with lower tariff can be optimal to the end users of the service.
For a successful PPP, these three points of views from the public sector, the private sector, and the end users need to be satisfied. Among these, the view from the end user is mostly covered by the public sector, because the end users cannot directly attend the negotiation table for a PPP contract which is concluded between the private and public sectors. With regard to the view of the private sector, the involvement of the private sector is decided in the PPP market and various conditions of each company are difficult to be theoretically considered in the thesis. Also, since such public service using the PPP scheme has been provided by the public sector, the public sector usually has the initiative in the PPP market. Thus, the public sector needs to offer an attractive PPP model which is acceptable to the private sector by employing methods such as appropriate risk sharing.
This research aims to provide a guide for the public sector to choose an optimal model between the BTO and the BTL in road and rail in South Korea. An optimal PPP model needs to save the life cycle cost and to provide higher quality of service with lower tariff. This model should meet the interest of the private sector and offer an appropriate risk sharing to raise the feasibility of a PPP project itself. Especially, traffic demand risk is the key issue for the
transport PPP in South Korea, so it needs to be considered mainly in terms of risk sharing. For this purpose, four research objectives are set out as follows:
To identify the features of the PPP models in transport in South Korea The appraisal on the BTO model is provided and the characteristics of the BTL, as an alternative PPP model, are discussed through the literature
review. In South Korea, these two PPP models were regarded proper for different areas: the BTO for transport with incomes from the end users; and the BTL for the service without enough income such as a school and sewage facility. In this context, this research objective examines the possibility to use the BTL instead of the BTO for transport and which model is better for road and rail;
To develop a detailed methodology to compare the BTO and the BTL Comparing the BTO and the BTL models for a transport project has not been tried before, so a new methodology will be developed. Quantitative and qualitative approaches will be developed to explore ways to compare the life cycle cost (LCC) and the quality of service of different procurement models;
To examine the optimal PPP model for road and rail in South Korea Through the quantitative and qualitative comparison between the BTL and the BTO models in both road and rail cases in South Korea, better PPP model is explored to save governmental expenditure and to provide better quality of service; and
To determine the appropriate demand risk sharing in road and rail The public sector in South Korea still prefers the BTO model for saving the LCC spent from the public sector (government expenditure) on transport, so the discussion is needed as to whether the BTO model can be optimised through an appropriate traffic demand risk sharing instead of using the BTL model which is more risky to the public sector. This will require a
probabilistic approach to determine risk. In addition, a method to determine the optimal Minimum Revenue Guarantee (MRG) will be developed for the BTO model.
The thesis will make significant contributions to knowledge by making detailed comparisons of BTO and BTL PPPs for the road and rail sectors for the first time. A new approach in which qualitative methods are used to supplement quantitative methods will assess the impact of service quality. This methodology will also be used to develop new guidelines for revenue risk sharing in BTO contracts.
1.3 Previous Studies
The private involvement in the public service area could broadly be shown throughout the history of the World. However, the PPP has boomed since the 1990s when the PFI was first introduced to the UK and many developing countries have tried to use the PPP for an early procurement of the
infrastructures (Chen, 2010, Estache, 1999). As many countries introduced the PPP to cope with the increasing fiscal burdens and to improve the quality of public service, many researches about the PPP have been undertaken to suit the circumstances of each country.
Though the details of the PPP are different according to the characteristics of a project, the PPP basically needs to be designed to allocate obligations or risks to the sectors which are best able to manage them (ADB, 2008). Through the appropriate risk management or obligation allocation, the public sector aims to minimise costs while improving the quality of public service. In short, the purpose of the PPP can be understood to maximise the value for money through optimal risk or obligation allocation.
Thus, many issues of the PPP research have been mainly about risk allocation, value for money, and financial costs. Corner (2005) pointed out the real success of PFI projects depended on the degree to which risk was genuinely transferred from the public to the private sector and optimally shared through the qualitative and quantitative indicators. Clifton and Duffield (2006) explored the improved governance of the PFI/PPP in Australia through the contract
structure between the private and public sectors, and risk management. Galilea and Medda (2010) studied the influence of the political and economic contexts such as a country’s experience, corruption and democratic accountability on the success of the transport PPP. In specific, they argued that the inexperience and corruption in developing countries affected the success of the PPP
negatively, so the multilateral lenders like the World Bank should support these countries to set up a regulatory frame work for the PPP. Debande (2001)
analysed the PFI cases in transport infrastructures from the UK experience, and argued that though the transfer of risks made it possible to reduce the
construction cost, transaction costs were relatively high. He also suggested that the optimal PPP take into account two phases of the transport projects: the
design-construction and operation of the infrastructure. To evaluate the PPP projects, it looks necessary to test the VFM (Value for Money).Forshaw (1999)
explored the UK’s traditional public procurement and PFI through the VFM concept.Heald (2003) suggested the necessity of a framework for the best VFM under the UK accounting regulation. He argued that though the VFM analysis should be considered with total risk, the accounting treatment decision was mainly judged by the sharing of risk, so the best VFM should cover the risk such as construction risk where the private sector had a responsibility beyond the accounting treatment.
As the PPP cases increase, many governments are making a standard form for the PPP to minimize the cost of trial and error such as the transaction cost and time for negotiation. Such standard form of the PPP is called a PPP model, and it is designed to suit the characteristics of a project or to fit the social and economical circumstances of each country through the optimal risk allocation. The PPP model is based on a regulatory or legislative framework of each
country, and it is best able to reflect the situation of PPP market of that country. Thus, the research on the PPP models seems the most practical way to allocate risks and to maximise the value for money.
However, research on the PPP model has not been broadly invigorated in the World because of the flexibility of the PPP context and the ambiguity in terms and conditions across countries and across sectors (Galilea and Medda, 2010, Delmon, 2010). Thus, studies on the PPP models mainly focus on general features of the PPP model and comparative studies at a country level or at the various sector levels such as transport and water services.
Palmer (2000) analysed the contract issues and financing between the DBFO model and the DBO model. He argued that the DBO model was different from the DBFO model in that the government was responsible for financing, so the DBO model would be more cost effective and quicker than the DBFO model. Vickerman (2003) analysed the characteristics of different types of PPP in the UK. The full privatisation, the PFI scheme, and the PPP scheme were explored through some UK transport cases such as the Channel Tunnel, Railtrack, PFI road, etc. He also argued that the private sector involvement required projects to be discrete and clearly defined PPP. Chiu and Bosher (2005) explored the
risk sharing mechanism by looking at the various types of PPP arrangements for water and wastewater services. In the transport sector, researches on the PPP model are much related with the payment mechanism. The BOT (Build-Operate-Transfer) model, which is one of the most prevalent PPP models in the road sector, uses actual toll collected from the end user. The DBFO model, which is common in road in the UK, uses shadow toll or availability payment. Thus, several studies focus on a comparison between real toll and shadow toll
(Aziz, 2007, Faivre d’arcier, 2003, House of Commons Transport Committee,
2005, Bain and Wilkins, 2003a).
In South Korea, the BTL model was newly introduced in 2005 and used to some railway projects from 2006. In the case of the rail BTL projects, the first project is still under construction. Thus, there are few studies on the BTL model for transport and most research on the BTL model was about general features and the sectors such as the school, military accommodation, and environment facilities (Park, 2011b, Ahn et al., 2011, Koo, 2011, Cho et al., 2009).
With regard to the comparison of the BTL and the BTO models of Korea, Shin (2006) tried to compare both PPP models for the Incheon Airport Railway from the perspective of financial cost. However, he ignored the qualitative factors and various risks in the financial analysis. Since this study did not consider various characteristics of the BTL model, it might not seem to sufficiently examine the use of the BTL model for transport as an alternative to the BTO model. Kwak et al. (2009) suggested the risk-integrated feasibility analysis model of the BTL and the BTO project for the military residence building. They tried to use both models for a single military project by dividing it into two parts which are suitable for the BTL and BTO respectively.
Though several studies examined the characteristics of each PPP model, an optimal PPP model for transport has not been studied enough. Especially, since the BTL model has not been used for road in South Korea yet, there is still doubt on the BTL model for rail. Thus, this thesis aims to suggest new methodology to compare the BTO and the BTL models not only for saving government expenditure and improving the quality of service, but also for identifying the optimal PPP model for transport infrastructures specified in road and rail.
1.4 Research Scope
Since there are many PPP models worldwide and they sometimes can be tailored to the circumstances of each country, it might be difficult to compare all the possible PPP models. However, many countries make an effort to standardise the PPP model to reduce the cost and time for negotiation when making a contract with the private sector. These efforts make it possible to compare the characteristics of each standardised PPP model. This study focuses on the BTO and BTL model in South Korea as a practical research for solving the current problems with the BTO model in South Korea.
This research deals with the PPP for transport infrastructures, especially road and rail. These two transport modes are the most prevalent users of PPP schemes not only in South Korea but also all over the World including the UK (see Chapter 2). Seaport and airport also represent important portions in the PPP fields, but this study primarily focuses on road and rail.
The stakeholders of PPP are the public sector, the private sector and the end user. These three sectors hold different views on the PPP. In other words, the government has the main interest in budget savings and providing public service on time. The private sector always wants to make a profit. On the other hand, the end users do not care who provides transport infrastructure. What they are only interested in is the quality of service and fee if there is one. However, in most cases the government makes a decision to use the PPP after taking various views into account because the government has to be in final charge of providing the public service. Thus, many parts of this study are mainly focused on the government view while several characteristics of the PPP from different perspectives will be added to the qualitative analysis.
The PPP is very sensitive to the social and economic circumstances of each country. Not only financial status but also credibility of country or people’s
behaviour to the public service are important for the success of the PPP. Though the regional scope of this research is mostly limited to South Korea, the UK cases will be also studied to understand the newly introduced BTL model in Korea, which is basically using the concept of “service sold to the public sector” model in the PFI of the UK.
1.5 Research Procedure
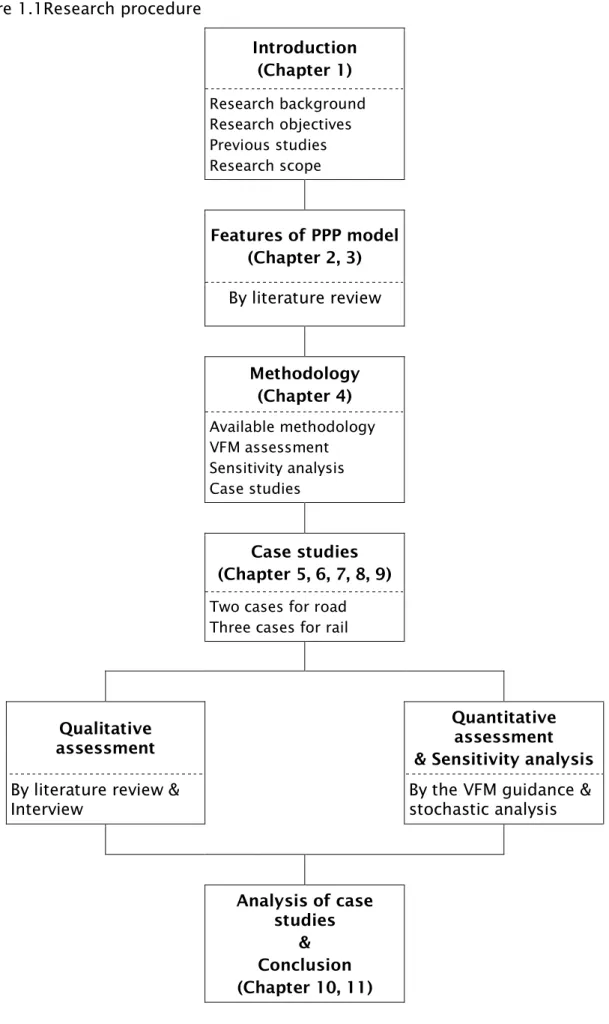
The research procedure for the optimal PPP model in South Korea consists of five steps with eleven chapters which cover the four research objectives.
The first step addresses the research background, research objectives, previous studies, research scope, and this research procedure as an introduction of the research (Chapter 1).
The second step reviews the general concept and models of the PPP. Definition, history, and the status of the PPP in the World including the UK, are mainly reviewed. The PPP models in the world are also introduced and classified. The trends in the PPP in transport are explored and the appraisal of PPP projects is reviewed. The regulation and models of the PPP in South Korea are also
reviewed and the PPP projects for transport in South Korea are explored (Chapter 2 and 3).
The third step studies the methodology to determine the optimal PPP for road
and rail in South Korea. In this step, the meaning of the “optimal PPP model” is clarified and available methodologies to find an optimal model are reviewed. The concept of the VFM (Value for Money) assessment, which is the most prevalent method to find whether the PPP is better than the direct public investment, will be studied. In addition, the case study as a research tool is reviewed and five cases are selected for further study (Chapter 4).
The fourth step is to determine the optimal PPP model that gives the highest VFM for different transport modes. This step takes five different cases in Korea which have already been implemented or are in negotiation. Through the VFM assessment and the sensitivity analysis, it will examine which PPP model is the most beneficial to government (Chapter 5 to 9).
In the fifth and final step, the results of the five case studies comparing the BTL and BTO models in South Korea are analysed. The optimal PPP model for road and rail in South Korea is concluded and the suggestions for the Korean government are explored. Lastly, the contributions and limitations of the thesis are discussed and a future study plan is added (Chapter 10 and 11).
Figure 1.1Research procedure Introduction (Chapter 1) Research background Research objectives Previous studies Research scope Features of PPP model (Chapter 2, 3) By literature review Methodology (Chapter 4) Available methodology VFM assessment Sensitivity analysis Case studies Case studies (Chapter 5, 6, 7, 8, 9)
Two cases for road Three cases for rail
Qualitative assessment
Quantitative assessment & Sensitivity analysis
By literature review &
Interview By the VFM guidance & stochastic analysis
Analysis of case studies
& Conclusion (Chapter 10, 11)
CHAPTER 2
THE PUBLIC PRIVATE PARTNERSHIP IN
TRANSPORT
2.1 Introduction
The PPP has been broadly used in various public service areas in the World including transportation for a long time, though names and types of the PPP have varied by time and country (U.S. Department of Transportation, 2004). Historically, some of current public services were originated from the private sectors or included to the private service area such as the turnpike in the 17th century in the UK and early rail industry in transport (Glaister et al., 2006). The PPP has become more prevalent since the PFI (Private Finance Initiative) of the UK was introduced in the 1990s. Many countries turned to PPP to seek higher efficiency and effectiveness in public service not only for budget savings but also for improved quality of service.
The broad context and variable types of the PPP make its concept and terms ambiguous. This ambiguity is a big obstacle to sharing the experience and knowledge of respective countries with researchers. Therefore it needs to clarify the concept of PPP models and to identify general characteristics of the PPP regarding the standardised model first.
In this chapter, general features of the PPP are reviewed for finding an optimal PPP model in transport. For this, the concept of the PPP which has many
definitions and characteristics should be reviewed first. Then various PPP models in the World and their classification are explored. Lastly, the history of the PPP for transport infrastructure, PPP projects in transport and their
2.2 The Concept of the Public Private Partnership
2.2.1 Definition of the PPP The Public Private Partnership
It seems difficult to define PPP clearly due to blurred boundary between the public and private sectors. In recent years, relations between the public and private sectors got more complicated and connected to each other. Also, there are too many different forms and variations in the PPP. Grimsey and Lewis (2005) said that “… (PPP is what) fills a space between traditionally procured
government projects and full privatization”. HM Treasury (2009) defined PPP as follows: “Public private partnerships (PPPs) are arrangements typified by joint
working between the public and private sectors. In the broadest sense, PPPs can cover all types of collaboration across the interface between the public and
private sectors to deliver policies, services and infrastructure.”
Standard and Poor’s (2005) defined that the PPP is a long-term relationship between the public and private sectors to deliver public service by sharing risks and using skills, expertise and finance of each sector. The European
Commission (EC, 2004) also used the term as a form of cooperation between the public authorities and the private businesses of funding, construction, renovation, management and maintenance of a social or economic
infrastructure.
According to an OECD report on the PPP (2008), these unclear definitions may be due to a broad space between the public and private sectors in a
partnership or cooperation to deliver public services. Trying to clarify the meaning of partnership and the difference with the concession, the OECD defined that the PPP is an agreement between the government and private partners where the private partners provide the service in such a way that the service delivery objectives of the government are aligned with their profit objectives through a sufficient risk transferring to them.
Though the definition of the PPP is broad and sometimes it looks unclear, several common factors can be discussed. Allan (1999) found some common factors in various definitions of PPP as follows:
• A cooperative between the public and private sectors, built on the expertise of each partner, which best meets clearly defined public needs through the appropriate allocation of resources, risks and rewards. • An arrangement between two or more entities that enables them to work cooperatively towards shared or compatible objectives and in which there is some degree of shared authority and responsibility, joint
investment of resources, shared risk taking and mutual benefit.
Based on Allan’s common factors, it seems that three factors are important
commonly to understand the PPP clearly: Resource, Risk, and Benefit. The definition of Standard and Poor’s and the European Commission shows the resources are skills, expertise and finance for construction, renovation,
management and maintenance. Risks are transferred to the private sector by a contractual agreement and the public sector tends to transfer them as many as possible (OECD, 2008). Benefit of each sector looks different. In the view of the private sector, the benefit from the PPP is making a profit while the benefit to the public sector is to achieve high service quality and save the cost the public sector has to burden to provide the public service. In these three factors, the most important thing looks the benefit of each sector in that such benefit is the key factor to initiate and improve the partnership between the public and the private sectors. Resources and risks are just negotiated and shared between the public and the private sectors to maximise the benefit of each sector. It means that resources and risks are tools for the PPP to meet the interest of each sector in the PPP.
Therefore, the PPP can be defined as a cooperative working between public and private sectors to provide high quality public services which are affordable to the public sector and are profitable to the private sector by sharing skills, expertise, finance of each sector and risks from construction to operation.
The Private Finance Initiative (PFI) was introduced by the Conservative
government of the UK in 1992 (Allen, 2001). For the initial periods, the PFI did not boom. In 1997, the Labour government renovated the PFI to benefit all participants and transparently deliver better value for money. The basic
motivation to introduce the PPP was to cope with increasing the government’s
investment demands for infrastructures (Chege and Rwelamila, 2001). However, the main reason for developing the PFI was to adopt private creativity and
competition to public services (HM Treasury, 2009). This characteristic seems to stand for the PFI and impact many other countries trying to find more effective way to deliver the public service. In other words, the PFI focused not only on the efficiency in finance but also on the effectiveness in public service when compared to previous efforts to use private financing.
The definition of the PFI is quite clear, because this is created by the UK government with intentions as mentioned above.
Scottish Parliament defines the PFI as follows (1999);
PFI is a means of using private finance and skills to deliver capital
investment projects traditionally provided by the public sector …. Instead of the public sector body directly procuring capital assets and subsequently owning, operating and regulating them, PFI generally involves the private sector owning and operating, but the public sector having a larger role in regulation.
However, in this definition, it is difficult to find the reason why the PFI got developed in the UK differently with previous private involvement in the public sector.
To this question, HM Treasury (2009) explains as follows:
The PFI is based on its commitment to efficiency, equity, accountability, and the PFI is only used where it can meet these requirements and deliver clear value for money. Where these conditions are met, PFI delivers a number of important benefits. By requiring the private sector to put its own capital at risk and to deliver clear levels of service to the public over the long term, PFI helps
to deliver high quality public services and ensure that public assets are delivered on time and to budget.
Hence, the PFI mainly emphasizes on a process to guarantee these benefits compared with traditional procurement. In short, the PFI can be defined as a means of using private finance and skills for high quality public services to be delivered on time and to budget, based on the commitment to efficiency, equity and accountability.
Difference of the PPP and PFI
The PFI was a creation of the Conservative government of the UK in the early 1990s and the Labour government has expanded the PFI to the PPP from 1997 (McNulty, 2002, Higton, 2005). The PPP and PFI seem to be used
interchangeably in the UK and other countries, although the PFI is also described as one of the PPP types in many papers (Cartlidge, 2006, Alshawi, 2009). HM Treasury (2009) also explained the PFI as the most common form of the PPP in the UK. More specifically, the PPP and PFI have the same aim to improve mutual benefits in public services through allocation of resources and risks. However, since the PPP has no regular formation, the process and
scheme of each country or project can be different. The PFI has formatted process to deliver the public service effectively. Figure 2.1 shows the procedure of the PFI from clarifying the objectives of the PFI to awarding contracts and managing them. Especially, while project financing rests mainly on the private sector (Hardcastle and Boothroyd, 2003) and the Special Purpose Vehicle (SPV) is usually made to distribute high risks of the private sector in the PFI, it is more flexible in the PPP (see section 2.2.3). Therefore, the PFI can be understood as a particular method with a substantial process for the private sector to design, build, finance and operate facilities. The PPP is a generic term used to describe partnerships with more various methods (Hale et al., 2004).
For this reason, the PFI can be distinguished from various PPP models such as BOT, BLT, BOO, etc. The most common PFI model is a DBFO (Davies and Fairbrother 2006), but other models can be also used in the PFI scheme.
Figure 2.1Step by Step Guide to the PFI Process
Clarify objectives by establishing business need
↓
Appraise the options
↓
Produce outline business case and outline PSC (Public Sector Comparator)
↓
Assemble project team
↓
Decide tactics for selection Stage
↓
Invite bids by issuing contract notice in OJEU(Official Journal of EU)
↓ Prequalification of bidders ↓ Selection of bidders (short listing) ↓
Reappraise business case and refine the PSC
↓
Invitation to negotiate
↓
Receipt and evaluation of bids
↓
Selection of preferred bidder and final evaluation
↓
Award contract and financial close
↓
Manage contract
Source: Based on Treasury Taskforce, Step by Step Guide to the PFI procurement
2.2.2 Advantages and disadvantages of the PPP/PFI
Though the definition and spectrum of the PPP are not unified and the contents and terms are sometimes ambiguous, several common characteristics are discovered in the PPP. Specifically, five elements are shown in several researches as the general characteristics: two or more participants; the principal role in negotiation of each participant; enduring and stable
relationship; resources able to be transferred to the partnership; and shared responsibility for outcomes (Li and Akintoye, 2003, Grimsey and Lewis, 2004).
By introducing the PPP having these general characteristics to the public service, the PPP has several advantages. Li and Akintoye (2003) described six benefits of the PPP: enhance government’s capacity to develop integrated
solutions; facilitate creative and innovative approaches; reduce the cost and time to implement the project; transfer certain risks to the private sector; attract larger, potentially more sophisticated, bidders to the project; and
access advanced skills, experience and technology. However, these advantages can be controversial in other view points. Yescombe (2007) summarised
debates about avoiding limitations on the budget of the public sector without additional demand on budget, risk transfer instead of higher financing cost of the private sector, the complexity of the PPP, the flexibility of the public sector, etc. The disadvantages of the PPP are also compared with advantages in many researches. Stainback (2000) explored advantages and disadvantages of the PPP based on respective views of the private and the public sectors. In the view of the public sector, there were such advantages as reduced risks on the
ownership, development and operation, utilising the expertise and creativity of the private sector, reducing the investment of the public sector, generating long term investment of the private sector, etc. Disadvantages were the
reduced level of control over the design and building quality, the possibility of inappropriate risk sharing and legal dispute, the economic return to the public sector depending on the private sector, the predevelopment process open to the public by media, etc. In the view of the private sector, advantages were the chance to use the government owned real estate, the shared risk with the public sector, etc. while disadvantages were the complicated process, more time in predevelopment process, the affection of the political stability, etc. Corner (2005) summarised the advantages and disadvantages based the PFI
deals of the UK. There are many other discussions of the advantages and disadvantages of the PPP when compared with the direct investment of the public sector. They can be summarised by the stage of a project as seen in Table 2.1.
Table 2.1 Potential advantages and disadvantages of the PPP/PFI
Stage Advantages Disadvantages
Plan Greater price certainty
Integrated plan covering whole
life cycle of facility
Uncertainty of planning for
long-term period (political risk, regulation change, etc.)
Contract Clear aim of delivering public
service
Performance measurement and
incentives for upgrading the quality of service
Competition among the private
sectors for the public service
Long (re)negotiation time to get
an agreement
Late response to the demand for
the change of the contract
Limitations of terms and
conditions to allocate risks well
High transaction cost (consulting
fee, more resources in the private and the public sectors)
Design Innovation and creativity in
design
Design considering life cycle
Possibility of overdesign to push
up prices in construction
Finance Long-term investment of the
private sector
Reduction of spending of the
public sector for public service
Restriction of future budget
(depends on PPP model)
Financing at commercial rates
which tend to be higher than government borrowing rates
Construction On time construction
On budget construction
Existence of unexpected
problems (e.g. natural disaster which cannot be forecasted)
Operation Timely delivery of service
No involvement of the public
sector in none core service
Inflexibility of operation for a
long term period (20-30 years)
Source: (1 Stainback, 2000, 2 Herpen, 2002, 3 Li and Akintoye, 2003, 4 Yescombe, 2007, 5 Thomson and Goodwin, 2005)
2.2.3. Risks of the PPP and risk allocation Risks of the PPP
Risks of the PPP are various and following lists are regarded as risks in the PPP: site acquisition risk, feasibility study risk, acquiring planning approval risk, design risk, construction risk, commissioning risk, operating risk, demand (revenue) risk, obsolescence/technology risk, residual value,
legislative/regulation risk, taxation risk, bid process/complicated negotiation risk, political risk, corruption risk, consortium structure risk, local partners risk, project management ability, existing infrastructure risk, raw material (supply, availability, etc), financing risk, force majeure risk, market competition risk, inflation risk, and foreign exchange risk (Private Finance Panel, 1995, Birnie, 1999, Salzmann and Mohamed, 1999).
Risks can be classified by a different perspective and some risks are more relevant than others for each project (NAO, 1999). They are affected by the economical or political circumstances of each country. Thus, it is important to identify appropriate risks for a project. According to NAO (1999), in the case of transport (especially for road), key risks were expected to be demand, design, construction and maintenance.
Risk allocation
Risks should be allocated to the sector which is best able to control them (HM Treasury, 2008). The reason of using the PPP in the viewpoint of the public sector is to provide the public service effectively and efficiently, but it is for making a profit to the private sector (ADB, 2012). Thus, risks can be
successfully allocated when it satisfies each sector and is agreed between two sectors (Li et al., 2005a). Some researchers prefer to allocate risks to three stakeholders: the public sector sponsor, the private sector and the end users (Arndt, 1998). However, the public sector covers the interest of the end users in most cases, so risks can be assigned to the public sector and the private sector or shared between the two sectors (NAO, 1999).
Risks should be allocated by a rational systematic manner, because some of them can be overlooked (Wang et al., 2002). Risk allocation is conducted through the negotiation process between two sectors and it is finally concluded by making a contract (Li et al., 2005a, NAO, 1999).
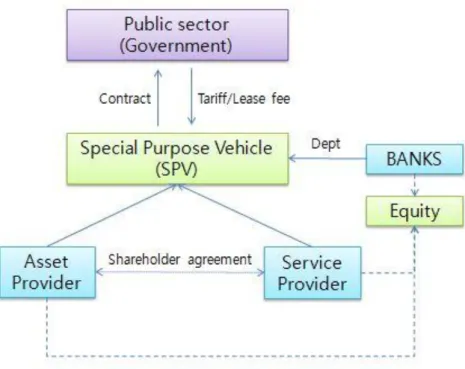
Contractual framework for risk allocation
Usually the private sectors make a Special Purpose Vehicle (SPV), which is a key feature of most PPPs, to share risks between private sectors (ESCAP, 2011). The SPV undertakes a project and negotiates contract agreements with the public sector. It is used for the PPP project implementation in limited or non-recourse situations, where the lenders depend on the cash flow and security over its assets to recoup its investment. An SPV has whole risks of the private sectors and each private sector is partly responsible for its shares. Thus, it is good to manage a mega project with high cost and risks.
Figure 2.2 Contractual structure of the PFI
2.3 The models of the Public Private Partnership
2.3.1 The PPP models in the World
A PPP project can be launched by making a contract through the agreement between the private and the public sectors and it is much affected by the characteristic of each project and circumstances of each country (ADB, 2008). There are a lot of ambiguity and difference in making a PPP contract and these increase transaction cost1 which is one of the most significant negative factors (Li et al., 2005a, Ezulike et al., 1997). In here, transaction cost includes not only cost for negotiation between the private and the public sectors, consultant, and education for officers but also time to get an agreement (House of Lords, 2010). Many countries made their own PPP models having unique processes and standard forms to be suitable for their countries (see table 2.3 and 2.4), so the PPP model can be defined as the standardised form with a substantial process.
Every country has socially and economically different circumstances, so many PPP models are made and changed by the needs of each country. In South Korea, several PPP models are listed as examples in the PPP Act which was legislated in 1993, but the most predominant PPP models are the BTO (Build Transfer Operate) and the BTL (Build Transfer Lease) models. In the UK, the DBFO model is common in transport (especially in road). These PPP models can be diversified by the following functions: design; build; finance; operate;
maintain; own; transfer; lease; develop; and buy (Menckhoff and Zegras, 1999, Zhang and Kumaraswamy, 2001). These combinations make many models of PPP and each function implies various levels of responsibility and risk of the private sector (ADB, 2008). However, these models are not exclusive and there can be many variations (Steinmann, 2007). It is also possible that each project can have their own model by selecting benefits from different models of PPP, and these models can be expressed by two ways. One is focusing on the stage of project such as a design (D), build or construct (B or C), rehabilitate (R), operate (O), maintain, and manage (M). The other way is focusing on the
1 The cost in the process of negotiating contracts because of legal, financial, and
ownership of the facility, which is expressed as transfer (T), own (O), lease (L), etc. For example, the BOT, BTO, BOO, BROT, BTL, BLT, etc. are the most
common models.
PPP models by the stage of project
Following PPP models are diversified by the stage of project where the private sector has a responsibility.
DBO (Design-Build-Operate)
In DBO model, the private sector is in charge of design, build and operate. The public sector owns and finances the construction of new facility. Generally, the private operator is taking no financing risk and is paid a sum for construction cost and operating fee by the procurement authority (PPP IRC, 2011).
DBFO (Design-Build-Finance-Operate)
DBFO is the PPP model where the private sector undertakes the design, build and operate a facility with its own finance for a contracted period, mostly 25 or 30 years. It is generally for the PPP/PFI roads (Scottish Future Trust, 2011).
DBOM (Design-Build-Operate-Maintain),
Under DBOM model, the private sector is responsible for the design,
construction, operation, and maintenance of the facility for a contracted period. The private sector should meet all agreed performance standards relating to physical condition, capacity, congestion, and ride quality (U.S. Department of Transportation, 2007).
DCMF (Design-Construct-Manage-Finance)
This model is very similar to DBOM or DBFO and it is generally for the PPP prison projects. The main difference is that the majority of services are provided by private sector employees unlike PPP schools where the facility is