© 2018, IRJET | Impact Factor value: 6.171 | ISO 9001:2008 Certified Journal | Page 2473
Risk Management Maturity Model for Road Construction Projects: Case
Study
Ashish S. Bhosale
1, K. Ravi
2, S. B. Patil
31
PG Student, Civil Engineering Department, Ashokrao Mane Group of Institution Vathar, Maharashtra, India.
2Professor, Civil Engineering Department, Shaikh Engineering College, Belgaum, Karnataka, India.
3
Assistant Professor, Civil Engineering Department, Ashokrao Mane Group of Institution Vathar,
Maharashtra, India.
---***---Abstract
–In developing country like India there is huge development in technology especially in road construction projects, but still there is less risk management practices in road companies and contractors. This paper aims to evaluate current risk management practices of road construction companies and contractors by using Risk Management Maturity Model (RMMM). Also these papers validate this model using a case study. Finally paper concluded that there is a very poor risk management practice by road construction companies and especially in road contractors. As per results of case study risk management maturity model will help companies and contractors to improve their risk management practices and awareness on it.Key Words
:
Risk, risk management, current practices,maturity model, risk management maturity model (RMMM), analytical network process (ANP).
1. INTRODUCTION
Indian construction industry is one of the largest industries in the country. It gives huge contribution to the development of Indian economy and present India as higher technology country in world. As we know the development of a country is indicated by development of their road network and India have a world largest road network (Ashish. S. Bhosale et. al; 2017). As per the latest report of Indian brand equity foundation (IBEF, 2018) India has 115,530 k.ms length National highways, 176,166 k.ms length of state highways and 5,326,166 k.ms district and rural roads. This figure indicates the rapid growth of road construction industry. As there is rapid growth in road construction industries, on the other hand there is still unawareness about risk management practices in companies and contractors. Today, if question of risk management practices is not new to practitioners but there answer is essential to the highly growing road construction industries for avoiding future losses. Many of researcher and practitioners are study on the question of finding appropriate approach to evaluate risk management practices. They find various descriptive and analytical approaches to evaluate risk management practices. A maturity model is an accurate and appropriate tool to evaluate risk management practices. This paper proposed Risk Management Maturity Model (RMMM) for evaluating risk management practices and trying to find out current risk management practices with the help of questionnaires survey.
2 RESEARCH OBJECTIVES
1) To study the current risk management practices in road construction projects.
2) To decide suitable analytical approach to evaluate risk management practices in road construction project.
3) To validate risk management maturity model (RMMM) using case study and survey.
2.1 Scope of study
This study is carried out in Western Maharashtra and some part of konkan region in Maharashtra State.
3. LITERATURE REVIEW
3.1 Risk
Risk is an uncertain event that either has a positive or negative impact (Project Management Institute, 2008). A risk may also represent opportunities, but the fact that most of the risk usually has negative results has led individuals to only consider the negative side of risk (Baloi and Price, 2003). In general risk is a situation where lack of some aspect can cause a threat to the project.
3.1.1 Sources of risk
There is various risk occur in road construction some of the widely occurs risk are gathered below; (B. A. K. S. Perera et. al; 2009).
Technical and contractual risks. Economic, financial and political risks. Managerial risks.
External and site condition risks.
3.2 Risk management
© 2018, IRJET | Impact Factor value: 6.171 | ISO 9001:2008 Certified Journal | Page 2474 from their business. Risk management is about making
decisions that contribute to the achievement of an organization’s objectives by applying it both at the individual activity level and in functional areas.
3.4 Current risk management practices
From past decade there is most of construction companies are starting to become aware about the risk management process and practices, but are still not using proper framework and techniques aimed for managing risks. According to literature study and research survey current practices by practitioners for each of risk management process step are given below;
3.4.1Risk Identification
As per research survey brainstorming and checklist are mostly used by practitioners. In addition to this some of the leading companies take suggestion from consulting professionals also used diagramming technique and SWOT analysis.
3.4.2 Risk Analysis
In most of small and medium sized construction projects qualitative analysis are used (Risk probability and impact assessment, Risk rating matrix). In quantifying techniques diagramming technique – decision trees, sensitivity analysis is mostly used by practitioners. But as per survey practices of risk analysis is very low.
3.4.3 Risk response
It is difficult element in the process of risk management because it addresses that what action is to be taken on identified and analyzed risks. Survey indicates under the four different strategies construction companies mainly prefer to avoid risk and transfer risks.
3.4.4 Risk monitoring
As the risk monitoring is one of the important part of whole process, but there is less practice done in it. Some of the construction firms have mentality that once the respond to risks then no need to monitor it. But some of construction companies are agreed to importance of risk monitoring and they used “Periodic document review” and “Risk audit” as a tool.
3.4.5 Risk report
In practices reported risks are used with hard copies and mostly soft copies and saved it for future projects. Various systematic frameworks are made by construction companies for reporting risk.
3.5 Various analytical approaches to evaluate risk management practices in road construction projects For finalizing appropriate approach we studied some evaluating technique are as follows,
3.5.1 Six sigma:
Six sigma is a quality improving technique which is based on statistics. This approach is more suitable when the current design of the products, service and process are correct and satisfactory regarding to requirement of customer (Sarathkumar K; Loganathan R, 2016). For evaluate risk it can be used with Failure Model and Effect Analysis (FMFA). FMEA identifies “failure modes” as way in which processes could fail. For each process step the project team evaluates what could go wrong. As failure modes are identified, they are evaluated across three different dimensions, typically on a scale of one to five;
The severity of failure. The likelihood of occurrence.
The probability anyone would detect the failure.
These three numbers are then multiplied to calculate a risk priority number (RPN);
RPN = Severity * Occurrence * Detection.
Failure modes are prioritized descending order based on their RPN. Those with higher RPN are put into top of list. Either process is re-engineered or a control plan is put in place to mitigate the risk (Ted Theodoropoulos, 2014).
A] Limitation of implementing six sigma technique in construction industry
According to Heidi Wiesenfelder (2017), time frame and appropriate training to employees before implement six sigma is needed this training can take several week may be period of months or more therefore, this not feasible in construction industry. Also there is lack of knowledge related six sigma in construction industry. Initial implementing cost is more which is not feasible for medium and small scale construction firms and contractors.
3.5.2 Risk management index (RMI):
Risk management index (RMI) are developed to evaluate risk management performance and effectiveness in construction practices. It provides a qualitative measure of effective management based on benchmarks that risk management efforts should aim to achieve in construction industry. Risk management index established a scale of achievement levels, also it construct groups or defining a require attributes. In which each group or attribute have their related indicators, these serve to characterize risk management performance (M. L. Carreno, O. D. Cardona etc.; 2007).
A] Limitation of implement risk management index Complex framework to understand.
© 2018, IRJET | Impact Factor value: 6.171 | ISO 9001:2008 Certified Journal | Page 2475 Absence of stepwise improvement process.
Unused for small scale projects.
Need qualify technical person to implement it.
3.5.3 Knowledge based approach:
Knowledge is an important factor in realizing and improving risk management in construction projects. It allows construction organization, contractors, and client to develop risk management function based on best practices (Adeleke A.Q; Ahmad Y. Bahaudin etc; 2015). If we see risk is surrounded with us in our personal and professional lives; to execute a task or process successfully it needs to have appropriate knowledge that helps us to make right decision (Samer Ahawari, L. Karadsheh etc; 2012). Knowledge based approach assist manager in decision making process and helps in achieving organizational objectives. But some of the limitation that we find by literature study is cultural setting which is one of the major issues to implement this approach.
There is lack of knowledge about risk management practices so needs to motivate people to share their knowledge, to reuse and apply consistently to improve risk management practices. Knowledge based approach also used maturity model as base for preparing and applying conceptual knowledge framework.
3.5.4 Maturity model
A concept of maturity models are process models (measurement tools) that are developed to evaluate the maturity of organization (can also be business unit, or department) processes and practices to identify opportunities for improvement and find out strengths and weaknesses. The concept is built on “Quality products are a result of quality processes” [(Chrissis, Konrad, Shrum, 2003), (Paulk, et.al, 1993)]. Capability maturity model is first maturity model developed by Software Engineering Institute (SEI) which is base of today’s maturity model. A first model for risk management is developed by Hillson in 1997 name is “Risk maturity model” this model contain four levels which are, Level 1: Naïve, Level 2: Novice, Level 3: Normalized and Level 4: Natural. These four attributes are Culture, Process, Experience, Application (Adeleke A.Q. et. al; 2015). By taking base of above to models various models are developed by researcher such as Project Management Maturity Model (PMMM) having five levels and model define five components of risk management: Risk identification, Risk Quantification, Risk Response, Risk Control, Risk Documentation (Begum Ongel, 2009). Risk Management Maturity Model (RM3) is advance developed model of risk maturity model by Hillson 1997, its also have four levels and four attributes develop by PMI (2002). By studying various model we developed one conceptual model (Risk Management maturity Model) which evaluate risk management practices in road construction projects. This risk management maturity model (RMMM) contains four levels name as initial, define, and managed, continuous improvement level.
Fig. No. 1 Conceptual model (RMMM).
Also model contains two main key area name as Organization management (OM) and Risk management process (RMP) Refer (table no. 1)
4. RESEARCH METHODOLOGY
For conducting survey we has first finalized zone. We select western Maharashtra and some part of kokan for our research. In this selected zone we first conduct pilot study to overview of current risk management practices and design questionnaires for final survey. After conducting pilot study we attained final questionnaire survey in which we divide questionnaire set in two parts first questionnaire for organization management and second for risk management process the result of these questionnaire survey gives us score of survey. On the result of distribute questionnaire we get satisfactorily response from respondent with 14 filled questionnaire from companies and 18 from contractors with no missing data. Simultaneously weights of attributes (Organization management and Risk management process) are taken by using analytical network process (ANP) which is multi-criteria decision making system. For this purpose a weights questionnaire is separately design and asked experts in companies to fill this. Questionnaires are validating with Cronbach’s alpha and analyzed by PSPP software.
4.1Case Study
© 2018, IRJET | Impact Factor value: 6.171 | ISO 9001:2008 Certified Journal | Page 2476 Table no. 1 Proposed Risk management maturity model (RMMM) (Ashish. S. Bhosale et. al; 2017)
Key
Area Element Key Initial Level Defined Level Managed Level Continuous Improvement Level
O rg an iz at ion M an ag em en t ( O M ) O rg an iz at ion S tru ct ur e Sup po rt .
-No Top management
Support
-One way communication only
-Unawareness about risk management in project / company.
-Awareness about risk
management but lack of top management supports to risk management in projects. -Two way communication as per need.
-Risk priority basis structure support system is their (Priority only to large project).
-As the benefit of risk management Understood at company level although not always consistently achieved.
-Two way communication for decision making purpose.
- Involvement of all department heads and some time internal stakeholder (staff) for solving risk related problem.
-Effective strategic planning for risk management to achieving goal with effective software and updated data base.
-Good Space for both way
communication in decision making - Involvement of internal (staff) and external stakeholder solving risk related problem. R es ou rc e M an ag em en
t - Do not consider as resource management is risk factor
while planning and
identifying process of risk management.
-No any strategic planning for resource management in company / organization.
-Resource management is
effectively considered as risk factor for risk management planning.
- Poor management for resource planning.
-Lack of proper documentation process.
-Proper scheduled management for planning and implementing resource management.
-Use of related software for assigning and tracking resources.
- Proper documentation process and use of related software.
-Preparing long term – short term planning for resource like (money, material, equipments, labour). -Scheduled planning and implementing with project stage basis.
-Proper monitoring and controlling to avoid risk.
- Audit of documentation and database is done periodically.
St ak eho ld er M an ag em en
t -Unawareness of stakeholder
management in company / organization and their impact on project.
-No any planning or strategy to deal with stakeholders and their expectation.
-Define awareness about
stakeholder’s importance in project.
- Lack of policy to identification project stakeholder’s
-Lack of proper planning to deal with stakeholder’s
- Improper implementation of system.
-Proper policy to identify project stakeholders.
- Well define strategy for managing each key stakeholder expectation and need.
-Involving
Stakeholder’s while decision making process in projects.
- Proper documentation process and database.
-Well define policy for identification of stakeholders in project.
-Performing stakeholder analysis for a project (analyzing their interest, involvement, impact).
-Two way communication with each stakeholder.
-Standard documentation process analysis of report.
-Periodic audit is done for proper stakeholder management. R is k C ul tur e
-No any risk culture policy
defines for company
/organization.
-Lack of knowledge about risk culture in top management and staff
-No any risk related practices run in company (Knowledge sharing, training).
-Risk culture is considered in company / organization policy but unawareness in top management.
-Lack of implementation of risk related practices (e.g: training
program) due to poor
management.
-Top management has proper knowledge and awareness about risk culture.
-risk related practices properly run with strategic planning.
- Staff engagement and motivational plans has run by company /organization.
-Standardize risk culture policy is define for all projects.
-Benchmark is developed to assess past and current changes in risk culture in company.
-Periodic risk culture audit is done for improve management policy. -Effective training program is run under external experts.
- Reward system considered in program to encourage project team.
R is k M an ag em en t P ro ce ss ( R M P) R is k Id en tif ic at ion / Id en ti fy
-No any awareness about risk
management in top
management.
-No any format to deal with risk or uncertainty. -No any specific tool used for identification of risk in project.
-Identification is at individual level
-Little bit awareness about risk management in higher authority but consider only large projects. -Basic level identification tools are used but only for large projects.
-Input from key stakeholder is considered for risk identification purpose.
-Awareness about risk management in higher authority consider for most of projects.
-Proper documentation process and standardized respective tools are used for identification of risk. -Integrated process and practices with stakeholders and resources.
-Full of awareness about risk management in whole company /organization.
-An improved standardizes process for identification tools are used in each and every project.
R is k A na ly si s / A ss es sm en t
-No any assessment process or format to dealing with identified risks.
-Analysis of risk at individual level but no any standard format for assessment.
-Basic level format for analysis of identified risk.
- Top of risks in selected and large projects is analyzed with help of external consultant. -Risks are prioritized based on singe factor.
-Standardized process used to analysis of identified risks. -Multiple criteria used to prioritized risks items.
-Analyzed data preserve in proper documentation.
-Software are used to analysis as per possible.
-Advanced standardize process used for analysis of identified data. -Analyzed data preserve in soft copy format used for future projects. -Risks in various parts of company/ organization are also considered for analysis.
© 2018, IRJET | Impact Factor value: 6.171 | ISO 9001:2008 Certified Journal | Page 2477
R
is
k
R
es
po
n
se
-Risks are considered as they arise.
-There is no any proper mitigation strategy. -No any contingency plan for future and present projects.
-Risk response plans for selected and large projects.
-Improper gathering of
strategies to deal with risk evens.
-Contingency plan and risk mitigation strategies developed only for large and selected projects.
-Risk response plans for most of projects.
-Proper documented process with integrated strategies planning. -Contingency and mitigation plan prepare for most of projects.
-Risk response plans are run on each and every project.
-Well defined documentation process with advanced integrated strategies planning at all and every project of company.
R
is
k
M
on
it
orin
g
-No any monitoring process and practices.
-Monitoring of risk is on individual level.
-No any documentation process.
-Basic format prepare for monitoring risk but lack in practices.
-Monitoring and further process work for selected and large projects.
-Standardize and formal process for monitoring risk.
-Practices run on most of projects with good planning.
-Review period is determined by the operating environment.
-Milestone and benchmark for success and warning sign for failure are identified and stored (risk register and risk assessment sheet).
-Periodic review is included at company environment.
-Monitoring tool and techniques are improved as per type and size of project.
R
is
k
R
ep
or
t
-No any risk reporting process.
-Reporting of risk is on oral basis.
-Impact factor and level are not considered.
-Risk reporting is done but only large projects.
-Reporting depend upon on risk level and impact factor. -For small scale projects oral basis reporting is there.
-Risk reporting is done on most of projects.
-Impact factor and level of risk are considered for reporting as per size of project.
-Quick reporting process for sudden risk.
-Time to time review by higher authority.
-Important report is preserve for future project.
-Reporting framework establish by company /organization.
5 RESULTS
[image:5.595.36.567.38.330.2]Weights questionnaire asked to filled experts from companies and average of their result for organization management (OM) are given in table no.2 and risk management process (RMP) in table no.3
Table no. 2 Key area weight for organization management.
Weights for Organization
Management Normalized Limiting Rank
1 0.266666
Organization Structure Support 0.394059 0.1048203 1
Resource Management 0.159087 0.0435340 3
Stakeholder Management 0.145052 0.0387876 4
Risk Culture Support 0.301803 0.0795244 2
According to above table we can see that experts give first preference to organization structure support and next to risk culture then to further one.
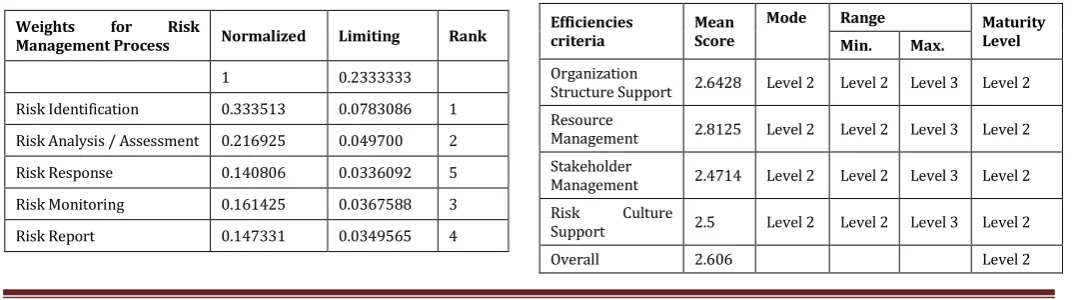
Table no. 3 Key area weight for risk management process.
Weights for Risk
Management Process Normalized Limiting Rank
1 0.2333333
Risk Identification 0.333513 0.0783086 1
Risk Analysis / Assessment 0.216925 0.049700 2
Risk Response 0.140806 0.0336092 5
Risk Monitoring 0.161425 0.0367588 3
Risk Report 0.147331 0.0349565 4
Above result show that expert’s gives first preference to risk identification and risk analysis which is very important for any of project to avoid future problem. They give last preference to risk response.
[image:5.595.32.288.452.561.2]A] Companies survey score
Table No. 4 Averages mean score of companies in key area organization management.
Organization Management [Company Survey
Score] Average Mean Avg. Std. Dev. Average Variance Cronbach’s Alpha
Organization
Structure Support 2.6428 1.0838 1.3534 0.6292
Resource
Management 2.8125 1.1582 1.5006 0.8240
Stakeholder
Management 2.4714 0.9975 1.1329 0.7836
Risk Culture Support 2.5 0.9189 0.9807 0.7936
Table No.5 Maturity levels of companies in key area organization management.
Efficiencies
criteria Mean Score
Mode Range Maturity
Level Min. Max.
Organization
Structure Support 2.6428 Level 2 Level 2 Level 3 Level 2
Resource
Management 2.8125 Level 2 Level 2 Level 3 Level 2
Stakeholder
Management 2.4714 Level 2 Level 2 Level 3 Level 2
Risk Culture
Support 2.5 Level 2 Level 2 Level 3 Level 2
[image:5.595.33.571.632.782.2]© 2018, IRJET | Impact Factor value: 6.171 | ISO 9001:2008 Certified Journal | Page 2478 According to table no. 4 and 5 maturity level of companies
[image:6.595.36.290.205.338.2]for key area organization management is at level -2 in which efficiencies criteria risk culture is very low with mean score 2.5 this indicate level of practices for risk culture is very poor. Again for resource management mean score is 2.8125 that nearer to level-3 which shows that companies having satisfactory practices in it.
Table No. 6 Averages mean score of companies for key area risk management process.
Risk Management Process [Company survey
score] Average mean Average std.dev. Average variance Cronbach’s Alpha
General question 3.0357 1.4090 2.0027 0.7441
Risk Identification 2.2857 0.4584 0.2115 0.9226
Risk Analysis
/Assessment 2.2142 1.0375 1.2032 0.7448
Risk Response 2.2857 1.3134 1.8873 0.9162
Risk Monitoring 2.4642 1.1712 1.5082 0.7920
[image:6.595.34.290.379.512.2]Risk Report 2.5714 1.1467 1..4340 0.7916
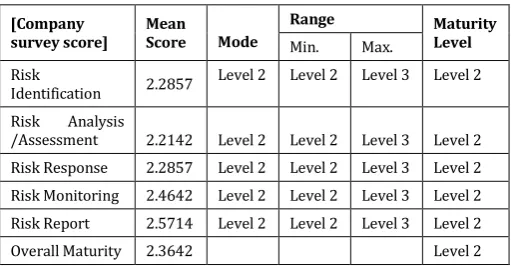
Table No. 7. Maturity levels of companies in key area risk management process.
[Company
survey score] Mean Score Mode
Range Maturity
Level
Min. Max.
Risk
Identification 2.2857 Level 2 Level 2 Level 3 Level 2
Risk Analysis
/Assessment 2.2142 Level 2 Level 2 Level 3 Level 2
Risk Response 2.2857 Level 2 Level 2 Level 3 Level 2
Risk Monitoring 2.4642 Level 2 Level 2 Level 3 Level 2
Risk Report 2.5714 Level 2 Level 2 Level 3 Level 2
Overall Maturity 2.3642 Level 2
Companies score of key area risk management process indicate that risk reporting and risk monitoring practices are good with score 2.5714 and 2.4642. Risk analysis practices is very low with score 2.2142. Considerable point is that practices for risk identification are not good as per importance given by experts for these efficiencies criteria. If we see overall maturity for risk management process is at level-2 (Define level).
B] Contractor’s survey score
Table No. 8 Averages mean score of contractors for key area Organization Management.
Organization Management [Contractor
Survey Score] Average Mean Average Std. Dev. Average Variance Cronbach’s Alpha
Organization Structure Support
2.0371 1.1007 1.3355 0.647
Resource
Management 2.2638 1.2525 1.6919 0.9033
Stakeholder
Management 1.9333 0.9609 1.047 0.869
Risk Culture
Support 1.7222 0.8529 0.8316 0.8492
Table No.9 Maturity levels of contractor’s in key area Organization Management.
[Contractor Survey Score]
Mean
Score Mode Range Maturity Level Min. Max.
Organization Structure
Support 2.0371 Level 2 Level 2 Level 3 Level 2
Resource
Management 2.2638 Level 2 Level 2 Level 3 Level 2
Stakeholder
Management 1.9333 Level 1 Level 1 Level 2 Level 1
Risk Culture
Support 1.7222 Level 1 Level 1 Level 2 Level 1
Overall 1.9891 Level 1
According to contractors survey key area organization management practices for efficiencies criteria resource management are considerable with score 2.2638; also resource management having higher value of Cronbach’s alpha (0.9033). On the other side practices level of remaining efficiencies criteria is very low especially risk culture is at level-1 with score 1.7222. Contractor’s practices for stakeholder management are also at initial level (level-1). Therefore overall maturity level of contractors for key area organization management is low (level-1) with score 1.9891.
Table No.10 Averages mean score of contractor’s for key area Risk Management Process.
Risk Management Process
[Company survey
score] Average mean Average std.dev. Average variance Cronbach’s Alpha
General Question 2.5833 1.48 2.9111 0.721
Risk Identification 1.5 0.5064 0.2565 0.8487
Risk Analysis
/Assessment 1.555 0.7843 0.8431 0.5961
Risk Response 1.5277 0.9085 0.9526 0.7064
Risk Monitoring 1.555 0.8973 0.9542 0.5825
Risk Report 2 1.0289 1.3235 0.75
Table No. 11 Maturity levels of contractor’s in key area Risk Management Process.
[Company survey score]
Mean
Score Mode Range Maturity Level
Min. Max.
Risk Identification 1.5 Level 2 Level 1 Level 2 Level 1
Risk Analysis
/Assessment 1.555 Level 2 Level 1 Level 2 Level 1
© 2018, IRJET | Impact Factor value: 6.171 | ISO 9001:2008 Certified Journal | Page 2479 Risk Monitoring 1.555 Level 2 Level 1 Level 2 Level 1
Risk Report 2 Level 2 Level 1 Level 2 Level 2
Overall Maturity 1.6275 Level 1
Survey score indicates that risk reporting have higher practices with average mean score (2.00), with standard deviation (1.0289) and level of maturity is level-2 (Defined Level). Practices of other efficiencies criteria are nearby same score with different average mean score. Only risk reporting practices can reach up to level-2 (Define level) otherwise practices for any other criteria is very poor. Therefore overall maturity of contractors for risk management process is also very low with maturity score 1.6275. It is very important to see that maturity level of contractors is at initial level.
C] Case study
Risk management maturity model are implemented on Case study “A” and most of suggestion given by us are implemented and trying to run as regular practices on project “A”. Analyzed result of questionnaires before implemented maturity model and after implemented are given below. Weight’s for key areas and there efficiencies criteria are also given below.
Key area weight of organization management Table No.12 Key area weight’s of organization
management for case study “A”.
Weights for Organization
Management Normalized Limiting Rank
1 0.333333
Organization Structure
Support 0.34395 0.114651 1
Resource Management 0.22351 0.074504 3
Stakeholder Management 0.16083 0.053609 4
Risk Culture Support 0.27171 0.090569 2
Above result of weights questionnaires indicates that organization structure support have highest weights (0.34395) and next priority given to risk culture support having weights (0.2717). Lowest weights are given to the stakeholder management by experts of case study “A” which is (0.16083).
Key area weight of risk management process Table No. 13 Key area weight’s of risk management
process for case study “A”.
Weights for Risk
Management Process Normalized Limiting Rank
1 0.1666667
Risk Identification 0.30333 0.050556 1
Risk Analysis / Assessment 0.23945 0.039909 2
Risk Response 0.15338 0.025563 4
Risk Monitoring 0.15416 0.025693 3
Risk Report 0.14968 0.024947 5
Experts’ results for weights questionnaires given in table no.13 experts gives second priority to practices of risk management process with weights (0.166667). In which experts gives highest weights to risk identification that is (0.30333) and second highest to risk analysis/ assessment (0.23945). Risk response and risk monitoring are somewhat similar weights (0.1533, 0.1541) expert’s gives lowest weights to risk reporting (0.14968).
Score of key area organization management (Before implementation)
Before implementation of risk management maturity model states of case study “A” for organization management practices are given in table no.14 and 15. For efficiencies criteria organization structure support mean score is (2) and maturity level is Defined Level and experts gives highest weights (0.3439).
Table No. 14 Mean score of key area organization management for case study “A”.
Organization Management
Mean Std. Dev. Variance
Organization Structure
Support 2 1.732051 3
Resource Management 2.125 1.5552 2.4107
Stakeholder Management 1.2 0.4472 0.2
Risk Culture Support 1.5 0.5773 0.3333
Table No. 15 Maturity levels of case study “A” for key area organization management.
Mean
Score Mode Range Maturity Level
Min. Max.
Organization
Structure Support 2 Level 2 Level 2 Level 3 Level 2
Resource
Management 2.125 Level 2 Level 2 Level 3 Level 2
Stakeholder
Management 1.2 Level 1 Level 1 Level 2 Level 1
Risk Culture Support 1.5 Level 1 Level 1 Level 2 Level 1
Overall 1.7062 Level 1
© 2018, IRJET | Impact Factor value: 6.171 | ISO 9001:2008 Certified Journal | Page 2480 Score of key area risk management process (Before
implementation)
If we refer table no.16 and 17 we strongly fill that for case study “A” there is very low practices for risk management process. According table no.16 risk identification practices are done regular basis having mean score. Also risk monitoring is under considerable level in practices with mean score 1.5. Other efficiencies criteria are having very poor practices with mean score 1. Therefore overall level of maturity for risk management process is at level-1 with mean score 1.15.
Table No. 16 Mean score of key area Risk Management Process for case study “A”.
Risk Management Process
Mean Std.dev. Variance
General Question 2.5 2.1213 2.121
Risk Identification 1.25 0.5 0.25
Risk Analysis/Assessment 1 0 0
Risk Response 1 0 0
Risk Monitoring 1.5 0.7071 0.5
Risk Report 1 0 0
Table No. 17 Maturity levels of case study “A” for key area Risk Management Process.
Mean
Score Mode Range Maturity Level
Min. Max.
Risk Identification 1.25 Level 1 Level 1 Level 2 Level 1
Risk Analysis
/Assessment 1 Level 1 Level 1 Level 2 Level 1
Risk Response 1 Level 1 Level 1 Level 2 Level 1
Risk Monitoring 1.5 Level 1 Level 1 Level 2 Level 1
Risk Report 1 Level 1 Level 1 Level 2 Level 1
Overall Maturity 1.15 Level 1
Score of key area organization management (After implementation)
Practices of key area organization management before implementing maturity model is at initial level (Level-1) having mean score 1.7062 as per table no. 15. After implementation of some plans and techniques in regular practices there level of maturity get improved up to level-2 (Define level). Great improvement we can see into efficiencies criteria stakeholder management the level of practices reach to level-3 (Managed level). This improvement is also we can see into organization structure support and resource management within mean score 2.667 and 2.750. Therefore overall levels of maturity get improved up to level-2 (Define level).
Table No. 18 Mean score of key area Organization Management for case study “A”.
Organization Management
Mean Std. Dev. Variance
Organization Structure Support 2.667 1.5275 2.3333
Resource Management 2.75 1.388 1.9285
Stakeholder Management 3 1 1
Risk Culture Support 2.25 0.9574 0.9166
Table No. 19 Maturity levels of case study “A” for key area Organization Management.
Mean
Score Mode
Range Maturity
Level
Min. Max.
Organization
Structure Support 2.667 Level 2 Level 2 Level 3 Level 2
Resource
Management 2.75 Level 2 Level 2 Level 3 Level 2
Stakeholder
Management 3 Level 3 Level 3 Level 4 Level 3
Risk Culture
Support 2.25 Level 2 Level 2 Level 3 Level 2
Overall 2.667 Level 2
Score of key area risk management process (After implementation)
Table No. 20 Mean score of key area Risk Management Process for case study “A”.
Risk Management Process
Mean Std.dev. Variance
General Question 4 0 0
Risk Identification 2 0 0
Risk Analysis /Assessment 2.6667 1.1547 1.3334
Risk Response 3.5 1 1
Risk Monitoring 3.5 0.7071 0.5
Risk Report 3 1.1442 2
Table No. 21 Maturity levels of case study “A” for key area Risk Management Process.
Mean
Score Mode Range Maturity Level
Min. Max.
Risk Identification
2 Level 2 Level 2 Level 3 Level 2 Risk Analysis
/Assessment 2.6667 Level 2 Level 2 Level 3 Level 2 Risk Response 3.5 Level 3 Level 3 Level 4 Level 3 Risk Monitoring 3.5 Level 3 Level 3 Level 4 Level 3 Risk Report 3 Level 3 Level 3 Level 4 Level 3
© 2018, IRJET | Impact Factor value: 6.171 | ISO 9001:2008 Certified Journal | Page 2481 For risk identification and risk analysis level of maturity goes
to increase with mean score 2 and 2.6667 within improved level-2 (Defined Level). A practices of risk response and risk monitoring is at level-3 with mean score 3.5, It’s very good improvement from level-1 by using regular practices. Overall level maturity is also very good it is highly closed to level-3 (Managed level).
6. SUGGESTIONS
Companies and contractor can improve their level of maturity by using risk management maturity model. Both of them have to consider risk culture in their company’s objectives and culture which will help them to develope a good risk management process and practices. Higher authorities from companies and contractor have to encourage the employee for improving risk management practices and using new tools and techniques. By using regular practices and updated database practitioners can improve their level of maturity.
CONCLUSION
On the study of various literature and by taking survey for current risk management practices we have concluded that companies in western Maharashtra and some part of kokan is at define level they known about risk management practices, tools and techniques but there is unawareness to implement in regular practices due to some problem like lack of support from higher authority, time limit, lack resources etc. Practices of contractors for selected zone are very poor it possible because of lack knowledge, lack of resources (Human, money, equipments). By studying various analytical approaches it’s concluded that maturity model is one of the best tool for evaluating risk management practices because it is very practical model. It gives scale of maturity which not only shows positive point but also gives negative point. Maturity model is such tool that practically feasible for any condition. Developed maturity model (RMMM) are validate by using a case study “A”. Result of it can show that model is effectively worked on given key areas (Organization management and Risk management process). After implementation of maturity model case study “A” improved their risk management practices especially for key area risk management process.
ACKNOWLEDGEMENT
I am very grateful to my project guide Dr. K. Ravi for giving their valuable time and guidance for completion of this paper.
I am also thankful to Asst. Prof. S. B. Patil of P. G. studies for their valuable suggestion.
REFERENCES
1) Adeleke A.Q, A.Y. Bahaudin, A.M Kamaruddeen, (2015), “Level of risk management practices in Nigeria construction industry from knowledge based approach”, Journal of Management, Marketing and Logistics, ISSN:2148-6670, Vol.- 2, Issue-1, pp. 12-23.
2) Ashish Suresh Bhosale., K. Ravi., S. B. Patil (2017), “A Conceptual Model of Risk Management Maturity For Road Construction Project”, International Journal of Research and Scientific Innovation–IJRSI, Vol.-4, Issue-9, pp.38-43.
3) B.A.K.S. Perera, Indika Dhanasinghe & Raufdeen Rameezdeen,(2009),“Risk management in road construction: The case of Sri Lanka, International Journal of Strategic”, Property Management(Taylor and Frances Group),Vol.-13, Issue-2, pp 87-102.
4) Begum Ongel (2009), “Assessing risk management maturity: A framework for the construction companies” Published by Middle East University, pp. 1-123.
https://etd.lib.metu.edu.tr/upload/12611457/index.p df
5) Chrissis, M. B., Konrad, M, and Shrum, S. (2003), “CMMI: Guideline for process integration and product improvement”. Addison Wesley.
https://resources.sei.cmu.edu/library/assetview.cfm? assetid=31054
6) Chrissis, M. B., Konrad, M, and Shrum, S. (2003), “CMMI: Guideline for process integration and product improvement”. Addison Wesley.
https://resources.sei.cmu.edu/library/asset-view.cfm?assetid=31054
7) Daniel Baloi, Andrew D.F. Price(2003),“Modeling global risk factors affecting construction cost performance” International Journal of Project Management, Vol.-21, pp. 261-269.
8) David A. Hillson (1997), “Towards a risk maturity model” The International Journal of project & Business Risk management, Vol.-1, No.-1, (Spring) pp.35-45.
9) Heidi Wiesenfelder (Sep. 2017), “Advantage and disadvantage of six sigma”, Article in bizfluent. https://bizfluent.com/facts-4760705-advantages-disadvantages-six-sigma.html
10) Indian brand equity foundation (January, 2018) report. https://www.ibef.org/download/Roads-Report-Jan-2018.pdf
11) MERN. A, T. and F. F. Al-Thani. (2008) “Corporate of risk management : An Organisational Perspective”. John Wiley and Sons Ltd. Chichester.
© 2018, IRJET | Impact Factor value: 6.171 | ISO 9001:2008 Certified Journal | Page 2482 13) Paulk, M. C. Curtis,B., Chrissis, M. B. and Webber, C.V.
(1993), “The capability maturity model for sotware, version1.1” Technical Report, Carnegie Mellon University, Software Engineering Institution, Pittsuburgh.
14) Project management Institute (2002), Risk management Maturity Level Development. PMI, London, UK.
http://www.pmi-switzeland.ch/fall05/riskmm. pdf Retrieved -10, Feb:2009.
15) Project management solution, (2008). “Advancing organizational project management maturity”.
Retrieved April 12, 2009.
http://www.pmsolutions.com/collateral/uploads/pdfs /white%20Paper_Advancing%20PM%20Maturity.pdf
16) Sarathkumar K. Loganathan R. (April 2016), “Evaluation of six sigma concepts in construction industry”, International Journal of Scientific and Engineering Research, Vol:7, Issue-4, pp. 202-207.
17) Samer Alhawari, L. Karadsheh, A.N. Talet, E. Mansour, (2012) “Knowledge-based risk management framework for information technology project”, International Journal of Information Management; Vol-32, pp.50-65.
18) Smith. N.J., Merna, T. and Jobbling P., (2006). “Managing Risk in Construction Projects”. 2nd edition Oxford: Blackwell Publishing.
19) Ted Theodoropoulos ( 2014), “Negate risk with six-sigma peer to peer fall”; Article.
http://acrowire.com/welcome/wp- content/uploads/2014/11/Negate-Risk-with-Six-Sigma-Peer-to-Peer-Fall-2014-reprint.pdf
20) Thomas L. Saaty “The analytical network process”. https://iors.ir/journal/article-1-27-en.pdf
BIOGRAPHIES
Mr. Ashish S. Bhosale is a P.G student of civil engineering department in Ashokrao Mane Group of Institution, Vathar,
Maharashtra, India.
Dr. K. Ravi is a professor of civil engineering department in
Shaikh Engineering College, Belgaum, Karnataka, India.