Comparison of Automatic Classifiers’ Performances
using Word-based Feature Extraction Techniques in
an E-government setting
Author: Alfonso Marin
Supervisor: Sumithra Velupillai
Examiner: Hercules Dalianis
Kungliga Tekniska Högskolan, Stockholm
Abstract
Nowadays email is commonly used by citizens to establish communication with their government. On the received emails, governments deal with some common queries and subjects which some handling officers have to manually answer. Automatic email classification of the incoming emails allows to increase the communication efficiency by decreasing the delay between the query and its response.
This thesis takes part within the IMAIL project, which aims to provide an automatic answering solution to the Swedish Social Insurance Agency (SSIA) (“Försäkringskassan” in Swedish). The goal of this thesis is to analyze and compare the classification performance of different sets of features extracted from SSIA emails on different automatic classifiers. The features extracted from the emails will depend on the previous preprocessing that is carried out as well. Compound splitting, lemmatization, stop words removal, Part-of-Speech tagging and Ngrams are the processes used in the data set. Moreover, classifications will be performed using Support Vector Machines, k-Nearest Neighbors and Naive Bayes. For the analysis and comparison of different results, precision, recall and F-measure are used.
From the results obtained in this thesis, SVM provides the best classification with a F-measure value of 0.787. However, Naive Bayes provides a better classification for most of the email categories than SVM. Thus, it can not be concluded whether SVM classify better than Naive Bayes or not.
Furthermore, a comparison to Dalianis et al. (2011) is made. The results obtained in this approach outperformed the results obtained before. SVM provided a F-measure value of 0.858 when using PoS-tagging on original emails. This result improves by almost 3% the 0.83 obtained in Dalianis et al. (2011). In this case, SVM was clearly better than Naive Bayes.
Keywords: E-government, machine learning, WEKA, SVM, Naive Bayes, kNN, Swedish, PoS-tagging, feature extraction, feature selection, automatic e-mail classification
Acknowledgments
Thanks to my supervisor PhD student Sumithra Velupillai, associate professor Hercules Dalianis and my fellow students Benjamin Kille, Yuanyuan Zhang and Alyaa Alfalahi for their support, new ideas and feedback. I would like to express my sincere gratitude to Jonas Sjöbergh for providing the already preprocessed data for this thesis.
Table of Contents
Abstract...I Acknowledgments...II Table of contents...III List of figures...IV List of tables...IV 1. Introduction...1 1.1 Background...2 1.2 Problem statement...3 1.3 Goal...3 1.4 Purpose...3 1.5 Method...3 2. Related Research...5 3. Method...9 3.1 Preprocessing...9 3.2 Feature selection...14 3.3 Classification...16 3.4 Evaluation...194. Data and results...22
4.1 Data...22
4.2 Results...23
4.2.1 Original Data...24
4.2.2 Stop words removed...28
4.2.3 PoS-tagged Data...31
4.2.4 Unigrams and bigrams...33
4.3 Analysis...34
4.3.1 Macro level...34
4.3.2 Micro level...35
4.4 Comparison with results obtained in Dalianis et al. (2011) ...36
5. Conclusion...39
6. Future Work...41
7. List of References...42
Appendix A - Glossary...46
Appendix B - Email content example...47
List of figures
Figure 1.1 IMAIL project workflow...1
Figure 3.2.1 CHI-square definition...15
Figure 3.3.1 Two-dimensional SVM example...17
Figure 3.3.2 Two dimensional kNN example...18
Figure 3.3.3 NB probability definition...19
Figure 3.4.1 Precision, Recall and F-measure definition...20
Figure 4.1.1 Email distribution in data categories...23
List of tables
Table 3.4.1 Confusion matrix definition...20Table 4.1.1 Email distribution in data categories...22
Table 4.2.1.1 Summed up results of table C.1...24
Table 4.2.1.2 Summed up results of table C.2...25
Table 4.2.1.3 Summed up results of table C.3...26
Table 4.2.1.4 Summed up results of table C.4...27
Table 4.2.2.1 Summed up results of table C.5...28
Table 4.2.2.2 Summed up results of table C.6...29
Table 4.2.2.3 Summed up results of table C.7...30
Table 4.2.2.4 Summed up results of table C.8...31
Table 4.2.3.1 Summed up results of table C.10...32
Table 4.2.4.1 Summed up results of table C.16...33
Table 4.3.1.1 Best classifiers’ overall results...34
Table 4.3.2.1 Best performance for each category...35
Table 4.4.1 Dalianis et al. (2011) classification results...37
1. Introduction
It is well-known that email is widely used by citizens to establish a communication with their governmental agencies. Knutsson et al. (2010) state that the deployment of electronic solutions for the services that a governmental agency can provide is a trend practice among all governments. The deployment and use of electronic solutions for the government services is called e-government. Through these solutions, the governments services become more available for the citizens, citizens are served more quickly and easily and governments save money by reducing office waste.
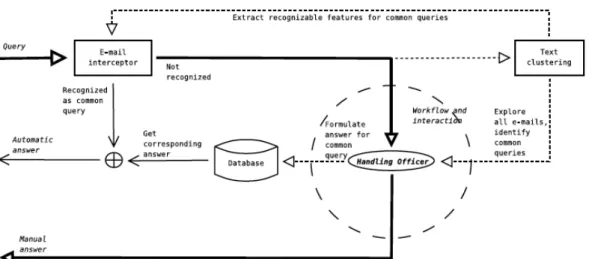
This master thesis, as the IMAIL project described in Knutsson et al.(2010), will focus on the communication between citizens and the Swedish Social Insurance Agency (SSIA)1. Every day, the handling officers of this agency have to write answers to emails from Swedish citizens regarding different subjects such as pension forecast, parental benefits like leave or loans or even people who ask how to get the European Union card. Although several queries about one same subject can be made, emails regarding one concrete subject are similar, hence handling officers’ efficiency and productivity could be improved. One approach for this improvement is the schema proposed by Knutsson et al. (2010), where an event interceptor could recognize certain email features that match with a concrete category or a common query and, eventually, even an automated email answering solution could be implemented. The workflow proposed by Knutsson et al. can be seen below in Figure 1.
1www.forsakringskassan.se
This master thesis aims to provide relevant information about how automatically classifying emails, as well as an email classifier that could be used in the email interceptor to recognize common queries.
1.1 Background
Since email communication is commonly used between citizens and governments, the use of automatic classification techniques could improve the efficiency of this communication. The Swedish Social Insurance Agency (SSIA) is one governmental agency where email communication could be improved since citizens use text to contact this agency. However, there are many approaches that could be useful for the problem of the email classification and besides classification, other work with the emails needs to be done.
Before the email classification, as Katakis (2006) state, the email data set has to be preprocessed, that is, transform the email data set in order to prepare the emails to be used and classified. In this master thesis context, since the data may contain private information of citizens, Knutsson et al. (2010) already did a de-identification task with the SSIA emails. This de-identification process consisted in removing the sensitive data that the citizen may have written in the email such as name, address, personal number, etc. However, some sensitive data is still present in the data set. Besides de-identification, other email preprocessing processes need to be done in order to get the features from the emails, such as the email category. Dalianis et al. (2010) describe previous work regarding the email preprocessing and the annotation of their category has been already done beforehand. When the data is prepared and the features of the emails have been extracted from the texts, an automatic classification can be performed.
Machine learning is the scientific discipline that focuses on extracting knowledge from empirical data using computers. Some of the algorithms designed and developed in this area have been used to approach different kinds of issues. Usually, automatic classification techniques from this area are used to perform any kind of automatic text categorization, as Sebastiani (2002) shows. Besides other kinds of texts, automatic classification techniques could be useful for email classification too. Ronnnie (2000) and Diao et al. (2000) used automatic classification techniques in order to build email filters.
Within the IMAIL project, a classification is performed in Dalianis et al. (2011) and results using both pattern matching techniques and automatic text classification are shown. They performed the classification with the data provided to this master thesis and using preprocessing techniques such as compound words split, lemmatization and chunking. However, other techniques are regarded in this thesis such as stop words removal, PoS-tagging and ngrams. Furthermore, in Dalianis et al. (2011) only Support Vector Machines and Naive Bayes classification techniques were performed, in this thesis, k-Nearest Neighbor classifier is also used. The preprocessing and classification techniques mentioned are discussed on chapter 2 and explained in chapter 3.
1.2 Problem statement
Email is used to communicate citizens and the SSIA, therefore, the classification of the emails could be a suitable solution that could improve the productivity of the handling officers through email classification since it could facilitate the answering process. One possible approach for the classification issue is the use of automatic classification techniques but it is still unknown which features of the email data set provide the best information about in which category the email should be classified as well as which automatic classification technique gives the best classification.
1.3 Goal
The goal of this thesis is to analyze how different kinds of features extracted from the email data set affects the classification made by automatic classification techniques.
1.4 Purpose
The purpose of this master thesis is to facilitate further research within the IMAIL project in order to make viable a future deployment of an automated email answering solution in the Swedish Social Insurance Agency.
1.5 Method
In the logical level, two models are proposed. The deductive approach consists in defining a hypothesis or theory which is proved or disproved by the work made. On the other hand, the inductive approach consists in working with empirical data and formulate a theory from the work done with the data. In this thesis’s context, the inductive approach suites better. The empirical data are all the emails from the Swedish Insurance Agency. All processes regarding features and all the
automatic classification techniques will give results that, once analyzed, will provide further information about the emails classification and hence new theories could be formulated.
As for the approach level, several data preprocessing, automatic classification techniques and classification evaluation measures will be used on all the available empirical data. Further information about all the processes and techniques used in the approach level can be found in chapter 3.
In the research method level, the literature review of other research regarding similar problems and projects is part of the research method level.
Finally, in the data analysis level, two models suite in this thesis. Statistical measures are from the different classification techniques performances as explained in section 3.4. In the first model, this quantitative data can be compared in order to determine which set of features and which classification technique provide the best classification. The comparison method will be regarded in section 3.4. A part from the quantitative analysis, a qualitative analysis can be also made. An assessment of the quality of the data and the classifications’ performances will be also made.
2. Related research
It is well-known that email is a common mean of communication nowadays and so is used by governmental agencies to communicate with their citizens. The IMAIL project described in section 1 aims to improve the efficiency of the Swedish Social Insurance Agency by providing them an automatic email classifier and answerer. Clustering and text processing has already been done with the emails from the Swedish Social Insurance Agency by Dalianis et al. (2010). They used a clustering technique called K-Means in order to cluster emails from the SSIA. This clustering technique groups into clusters emails regarding similar questions. In Knutsson et al. (2010) it is explained that a subset of emails were manually annotated with the common queries in order to work on other areas apart from clustering such as email classification.
The email classification problem is solved using several approaches that relate to different areas of computer science such as language processing, information retrieval and data mining. Thus, a large amount of research has been done within these areas to improve the classifications performances.
Katakis et al. (2006) state that the first step in email classification is to preprocess the data set in order to transform it and make its features1 comprehensible to the classification techniques.
Salton and Buckley (1988) state that working with a vector of terms instead of more elaborated text representations produce better results in information retrieval from texts. One example of these elaborated approaches is the representation of the dependence between words in the same text. The vector of terms representation of a text combined with any of its term-weighting approaches has produced better results than any other representation. These term-weighting approaches vary from using a boolean representation of a word when it appears in a text, to compute how often a word appears in the whole data set and use a number representation depending on this number and the number that the word appears in a single text. This vector of terms represented by either booleans or numbers provides, therefore, a proper and useful set of features extracted from the data set.
Joachims (1998) suggests that removing stop words (see section 3.1) and less frequent words reduces the number of features and improves the classification performance by decreasing the classification complexity. Their work show outstanding results when using these two techniques.
1 Features is the term used in this thesis, however, other terms such as characteristics or attributes are also
However, the results comparison when the techniques are used and when they are not is not provided. Support Vector Machines (see section 3.3) performs the classification with an accuracy1 of 86.4% when the stop words and low frequent words were removed as mentioned above. The data set used was Reuters-215782, it was split to 9603 training documents and 3299 testing documents. Also, it was carried out with 90 of the original 135 categories since those categories for which there was not a training and a test sample were removed.
Most part of the emails written to the Swedish Social Insurance Agency are obviously in Swedish thus compound words might appear in those emails. Compound words have a very high frequency in Swedish and they are one of Swedish relevant features. Swedish is a member of the Germanic family languages, which one of their characteristics is their richness in compound words. Hedlund et al. (2001) state that compound words should be split when processing Swedish texts. In Rosell (2003) it is shown how splitting compound words from news taken from Dagens Nyheter and Aftonbladet (both Swedish newspapers) improve their clustering around 10%. Rosell (2003) compared the clustering results to a previous news categorization and used this measure as an external quality measure of his clustering. In the same work, Rosell describes how stemming (see section 3.1) also improves the clustering results. Furthermore, the best cluster performance in Rosell (2003) is when a combination of compound words splitting and stemming is used, obtaining an improvement of 13% in the external quality measure when this approach results were compared to the original email clustering results.
Besides stemming, lemmatization is another similar approach which is used by Chrupała (2006) improving the results’ accuracy almost 30% using both Spanish and Catalan languages corpora. The difference between stemming and lemmatization resides in that stemming removes suffixes while lemmatization converts inflected words to their base form (explained further in section 3.1).
Rosso et al. (2004) used Part-Of-Speech tagging (PoS-tagging) in order to classify the Times Magazine corpus. The PoS-tagging process consists in attaching to each word in the data set morphological information and take both, the word and the morphological information, as one single feature (see section 3.1). Rosso et al. (2004) used this technique and achieved very low rates
1 Accuracy is a measure defined as the number of correctly classified instances divided by the total number
of instances
of misclassifications by PoS-tagging the data set. Besides PoS-tagged, the data was also stemmed. The classification was performed using 30-Nearest Neighbors (see section 3.3).
In Bekkerman and Allan (2004) a comparison between classifications using unigrams and bigrams1 is made. Their results suggest that the use of both unigrams and bigrams as the features for one single document can outperform classification in case the results on the data set were not good using unigrams alone. On the other hand, the use of unigrams and bigrams slightly influence on the results when using unigrams performs good enough. Bekkerman and Allan (2004) used both unigrams and bigrams to classify the Reuters-21578 corpus improving the 91.3% accuracy using just unigrams and achieving 91.8% using both.
Once the kind of features that will be extracted is known, they can be clustered in order to reduce the number of features and hence facilitate the email classification to the classification techniques. There are several approaches regarding features clustering.
Rissanen’s Minimun Description Length (MDL) is an approach for clustering features used by Verbeek (2000) using the 20-newsgroup2 data set. MDL is a technique that groups certain words according to the probability they have to classify one text in one certain class if they appear in the text. Applying MDL and combining it with other techniques such as stop word removal, Verbeek reduced the number of features from 1000 to almost 10. However, Verbeek (2000) state that one of the main problems of MDL is its computational cost.
Liao and Jiang (2007) propose to cluster words into 1500 concepts associated to Chinese sememes3, which will become the features, and select those concept features that provide better information for the text clustering afterwards. Liao and Jian showed that, in HowNet4 data corpus (in Chinese), clustering using word features provided a 87.67% of accuracy while concept features provided a 96.16%.
1 A bigram is the union between one word and its following. Examples of unigrams and bigrams on the
sentence “the yellow house”: the, yellow, house; the_yellow, yellow_house;
2http://people.csail.mit.edu/jrennie/20Newsgroups/ - Last access 09-01-2011 3 Sememe is a semantic language unit of meaning.
Besides the selection of concept features that Liao and Jiang (2007) propose, in Yang and Pedersen (1997) word feature selection techniques are compared and explained. The process of selecting features is used for both selecting those features which provide better information to the classifier and reduce the level of noise in the data by deleting those features that might lead the classifier to misclassify an email. They test and compare Document Frequency Thresholding, Information Gain, Mutual Information, CHI-square statistic and Term Strength, all of them different feature selection techniques. Their test consisted in classifying texts from the Reuters-22173 and Ohsumed1 corpora using these feature selection techniques and k-Nearest Neighbor and Linear Least-Squares Fit (LLSF), both automatic classification techniques. The comparison between the different results was made with the measures recall and precision (see section 3.4). Their final results concluded that CHI-squared, Information Gain and Document Frequency Thresholding results are correlated since they provide the same information. However, Document Frequency Thresholding does not use the absence of feature, which make this technique faster to compute than the other two.
Once the data set has been preprocessed, the features have been extracted from the texts and the significant features have been selected, the classifying techniques can be used. Yang and Liu (1999) make a comparison of some useful techniques for text classification The techniques used are Support Vector Machines (SVM), k-Nearest Neighbor (kNN), Neural Network (NN), Linear Least-Squares Fit (LLSF) and Naive Bayes (NB). They were tested using the Reuters-21578 and compared using precision, recall and F-score (see section 3.4) . In this test, SVM and kNN outperformed the rest of classifiers with an F-score of 85.99% and 85.67% while NB performed a 79.56%.
Regarding the comparison of the results of the different features sets and the different classifiers, Yang and Liu (1999) show a set of suitable measures as well. Precision, recall and F-score are used to compare results in both micro-level and macro-level (see section 3.4).
3. Method
This chapter aims to explain the methods choices that have been done during this master thesis. Explanations intend to clarify which were the suitable approaches that the related research suggested in all the master thesis’ steps as well as the reason why the choice was taken.
For most of the processes described in this section, the WEKA (Waikato Environment for Knowledge Analysis) tool will be used to perform them. WEKA is described in Hall et al. (2009) as “a project that aims to provide a comprehensive collection of machine learning algorithms and data preprocessing tools to researchers and practitioners alike.” WEKA is a General Public License (GPL) suite that can be freely downloaded, the version used to perform all the approaches mentioned is the stable GUI 3.6.3 version released on July 2010 1. A part from WEKA, R can be also be considered to perform this thesis as well. R is described in Hornik (2010) as “a system for statistical computation and graphics”. However, unlike WEKA, the preprocessing techniques used in this thesis are not implemented in R, hence it is disregarded.
3.1. Preprocessing
In this step, the related research suggested that several techniques could be applied to a data set in order to reduce the noise on it and, therefore, facilitate the subsequent automatic classification. The first choice made in this step was to focus just on one-word-based techniques instead of other representations such as word-dependences representations. On previous work, preprocessing and classifying one-word-based representations have given good results.
Although data is provided, before the preprocessing, it has to be transformed into a suitable file format for WEKA. Nevertheless, the WEKA community has already solved this problem and released a public solution that could be used in Kirkby (2002).
The previous chapter research suggest that several preprocessing techniques could be used in order to enhance the classification performance. Joachims’ (1998) work suggest that stop words removal, Rosso et al. (2004) suggest to work with a combination of unigrams and bigrams, Rosso et al. (2004) suggest the use of PoS-tagging techniques and Dalianis et al. (2011) already did a classification in the same context as this thesis using compound splitting, lematization and
chunking. From all the techniques suggested, only chunking was disregarded. Chunking and PoS-tagging are techniques aiming to add extra information to words in order to differentiate between the meanings that one single word can take depending on its position in a sentence. The results of classifying the PoS-tagged data were not known before this thesis since Dalianis et al. (2011) performed chunking instead. Moreover, the work of Rosso et al. (2004)’s work suggest that PoS-tagging may improve the classification. Thus, PoS-PoS-tagging is regarded in this thesis instead of chunking.
Stop Words removal
Stop word is a concept introduced by Hans Peter Luhn in Luhn (1958). Stop words are those words used with a high frequency in natural language that do not contribute with extra information to the text classifier. Joachims’ (1988) work suggest that the stop words removal might be useful for the process of classification with this data set as well. The stop words removal will reduce the data sets dimensionality so that the key words left in the emails are identified more easily by the automatic classification techniques.
Since lots of public stop words list are available on the Internet, the words to be removed will be taken from a public list. From all the available lists, the list provided by Savoy (2005) was the list with the largest amount of words included in order to reduce the dimensionality and the noise on the data set as far as possible. The performance of the stop word removal consists in looking for the stop words in the chosen list and remove them from the text. This technique could be performed using scripting languages such as Java and Perl or the WEKA tool. The stop word removal will be performed using WEKA since it is already implemented.
Compound words split
Compound words are those that consists of more than one stem. Since the data set provided is in Swedish, compound words may appear on emails from the data set. Herglund et al. (2000) briefly explain the Swedish compound system. The use of fogemorphemes1 in the compound words in Swedish complicate the correct split of one compound word into its component. Furthermore, there are some compound words which meaning is not related to their components, e.g., jordgubbe (strawberry, jord [ground], gubbe [hubby]) but, on the other hand, the meaning of some other compound words is strongly related to the last stem, e.g., högskola (university, hög [high], skola
[school]). Rosell (2003) improved his clustering when the compound words splitting was used in a Swedish data set. The compound words split may facilitate the classifiers to find relevant features in stems within the compound words since before the splitting these stems were not treated as single features. If relevant features are found in the stems forming compound words, the compound words split may also help the classifiers to improve their classification in this thesis’s work.
Compound word example, “s” between “arbete” and “givare” is a fogemorpheme:
Compound words were already split in the data set provided for this master thesis (see section 4.1) using the method proposed by Sjöberg and Kann (2004).
Stemming and Lemmatization
Stemming and Lemmatization are two similar processes but their differences should be pointed and understood before the choice’s explanation. Swedish is also a language with a large number of word inflections. For instance, nouns in Swedish are divided into five types depending on their plural suffixes, nouns in their definite form are expressed adding a suffix depending on their gender, e.g. (flicka (girl), flickan (the girl), flickor (girls), flickorna (the girls)). The stemming process consists in replacing words in one text to their stem form, which means that all the inflections present in the text are reduce to their stem form. In the previous example, all the appearances in one text of flicka, flickan, flickor and flickorna would be replaced by flick. The difference between stemming and lemmatization is that lemmatization replaces words with their base form while stemming only removes their inflections. For example, the words “caring” and “cars” in English would be reduced to “car” in a stemming process whereas in a lemmatization process they would be replaced by “care” and “car” respectively.
Both techniques aim to match a set of inflected words into a single one which represents them all as a feature. Therefore, both techniques also reduce the dimensionality on the data set without loosing relevant information. The example of the words “caring” and “cars” given above show that lemmatization avoids ambiguous reductions of some inflected words, hence lemmatization’s replacement could be considered more correct. Lemmatization is a technique commonly used in text classification in order to improve classifiers’ results (e.g. Chrupala (2006)). Lemmatization has
also been applied on the data set before this master thesis started by Dalianis et al. (2010) using Granska. Granska is described in Domeij et al. (1999) as “a system for checking Swedish grammar”.
PoS-tagging
Part of Speech tagging consist in marking all the words in a text with their morphological category. As in English, for example “saw”, in Swedish, words can represent several morphological categories as well. Thus, the morphological category of a word which appears in one text may depend on the position it has in a sentence. Preprocessing the text and tagging words with their morphological category give additional information that may help to establish a difference between these words. PoS-tagging is a linguistic technique applied to data sets since the 1960s. Herglund et al. (2000) also suggest that POS-tagging may be a useful technique for Swedish since Swedish has a large amount of words which meaning depend on their morphological category. For example, the word “för” have different meaning depending on whether it is a preposition (meaning because) or a verb (meaning bring). Rosso et al. (2004) is an example on how PoS-tagging words in a data set can improve their classification. In this thesis’ data set, it might be useful to make a difference between same words that could mean different thing depending on the place they have in their sentences.
The PoS-tagging process will be performed with the Granska tagger tool, described in Carlberger and Kann (1999). This tagger is based on Markov models and correctly tags a 97% of words. Granska tagger is freely available at Kann (2009).
Part-of-Speech tagging example (Granska tagger):
In this case, the word huvudarbetsgivare is a noun (nn) with utrum gender (utr), singular (sin), indefinite (ind) and nominative (nom). All the information regarding the tags and their meaning can be found on the “features” file in the “lex” folder of the Granska-tagger tool.
Since PoS-tagging is the only technique done outside the WEKA environment, after using the Granska-tagger, the data will need to be transformed into a file format which WEKA could
understand. However, the text collection to arff-conversion mentioned before is also useful in this case.
N-grams
An n-gram, in the context of this master thesis, is a set of n consecutive elements in a sentence, elements can be both words or punctuation marks. The results shown by Bekkerman and Allan (2004) suggest that the combination of unigrams (single words as features) and bigrams may help the classifiers to improve their results. By introducing bigrams as features, the combination of certain words, such as a verb followed by a preposition, could be noticed and hence regarded in the classification performance.
The unigram and bigram extraction and combination will be performed with WEKA (see section 3.4).
Unigram and bigram features example:
A part from the use of a single preprocessing technique, the work in Rosell (2003) and Dalianis (2011) suggest that combinations of these preprocessing techniques are also suitable approaches. In their work were used combinations of compound splitting with stemming (Rosell (2003)) or lemmatization (Dalianis (2011)). Moreover, in Dalianis (2011), chunking, which aims are similar to PoS-tagging, was also combined with compound splitting and lemmatization. Thus, the use of the preprocessing techniques is not exclusive and combinations between all of them can be made. However, the limitation of time for this thesis prevent the performance of all the potential combinations. In Herglund et al. (2000) it is stated that two of the main features of Swedish are the compound words and the number of inflections that a word can have. Furthermore, in Rosell (2003) and Dalianis (2011) there is already previous work on combining preprocessing techniques as mentioned above. Hence, on this thesis, compound splitting, lemmatization and both compound splitting and lemmatization will be combined with stop words removal, PoS-tagging and Unigrams and Bigrams. As a result, 16 different preprocessing approaches are regarded in this thesis:
3.2. Feature selection
When all the features have been extracted from the emails, a set of relevant and non relevant features is obtained. The feature selection step aims to remove non relevant features from the set in order to reduce the dimensionality of the data set and to provide to the classifiers the best features and hence facilitate their classification.
This step could also be skipped. However, the classification would become more complex and the results obtained would not relevantly variate from the results obtained with the feature selection process performed since the feature selection processes select only relevant features to the categorization. Nevertheless, the feature selection process could remove slightly relevant features that may be useful for the classification.
A part from the feature selection techniques, clustering techniques such as Rissanen’s Minimum Description Length and concept-based features were introduced in the second chapter. However, these techniques require more time than the available to be properly performed. There is no public implementation of the MDL algorithm, therefore if this technique was performed, the script described in Verbeek (2000) should have been developed from the start. Regarding concept-based features, concepts relevantly related to the categories should have been set and words that appear on the data set should have been grouped into these concepts. These two tasks were so time consuming that the use of concept-based features was disregarded as well.
For this step, Yang and Pedersen (1997) suggest several techniques that could be performed in a text mining context as stated in chapter 2: Document Frequency Thresholding, Information Gain,
9) Original emails
10) Compound split
11) Lemmatization
12) Lemmatization and compound split
13) Original emails
14) Compound split
15) Lemmatization
16) Lemmatization and compound split 5) Original emails
6) Compound split
7) Lemmatization
8) Lemmatization and compound split 1) Original emails
2) Compound split
3) Lemmatization
4) Lemmatization and compound split
Mutual Information, square statistic and Term Strength. From all these techniques, only CHI-square and Information Gain take into account both the appearance and the absence of one feature to determine whether if one feature is relevant or not, therefore, the rest of techniques were disregarded. Information Gain and CHI-square techniques show similar results in Yang and Pedersen (1997). Between Information Gain and CHI-square the choice was based on the fact that Information Gain theoretically favor some kinds of features above others. Thus, even if in this thesis only one kind of features is used, CHI-square statistic will be used and hence only this technique is explained.
CHI-square statistic
This technique introduced by Pearson (1900) is used to measure the independence between, in this thesis context, one feature and the category of the email where it appears. The CHI-square statistic is defined as:
Here, t denotes one feature, Pr denotes probability, c denotes one category, A denotes the number of times that t and c coincide, B is the number of times that t does not coincide with c, C is the number of times that c does not coincide with t, D is the number of times that neither of t and c occur and N is the total number of emails marked with the category c. Thus, the CHI-square formula express the dependence between one feature “t” and the category “c”. In this thesis context, CHI-square computes how much the category of one email depends on the absence or presence of a word in an email. A and D represent the number of emails that the presence or absence of the feature “t”
coincide respectively with a category “c” email or any other category. On the other hand, B and C respectively represent the number of times that the feature “t” appear in a non “c” email and the number of times that the feature “t” do not appear in a “c” email. The overall CHI-square measure
for one term is calculated as the weighted average of the CHI-square measures of the term and all the categories. CHI-square is calculated for all the terms that appear in the data set.
A naive example on how this feature selection process works on a data set is on this two sentences:
“That thing is a dog” and “That thing is a cat”. The word-based features to be considered with this two sentences are: “That”, “thing”, “is”, “a”, “dog” and “cat”. This two sentences could be classified as sentences related to dogs and sentences related to cats. Considering the categories, the words “that”, “thing”, “is” and “a” are not relevant to know the category. On the other hand,
“dog” and “cat” determine the category of the sentences where whether they appear or not.
Once this measure is calculated, a value of zero points out that the feature t is independent from all the categories and hence it can be removed from all the data set. On the example above, “that”, “thing”, “is” and “a” would have a zero CHI-square value and hence would be removed. On the other hand, values bigger than zero show that the feature t is dependent to one of the categories and hence it could help the classifier to classify emails, like “dog” and “cat” on the example above.
Hence, this techniques helps to reduce the features set into those which are relevant to the classification. Yang and Pedersen (1997) showed that this technique outperforms most of the techniques mentioned in that section. CHI-square also is easier to compute than Information Gain therefore this technique is chosen to perform the feature selection process. CHI-square measure can be also run on the WEKA tool, WEKA determines and order the features by the CHI-square value they have. Then, all the features from the first which has a zero value until the last one can be removed from the features set.
3.3. Classification
Once the features selection has been applied, the classifiers can perform quicker their classifications. Yang and Liu (1999) showed several automatic classifiers which could be used in this context as well: Support Vector Machines (SVM), k-Nearest Neighbor (kNN), Neural Network (NN), Linear Least-Squares Fit (LLSF) and Naive Bayes (NB). In Yang and Liu (1999) a comparison of performances of these classification techniques is made. The results show that SVM and kNN are the best classification techniques and NB the worst among all. Hence, SVM and kNN are two techniques to be regarded in this thesis’ work. Moreover, even if it does not show good results, NB is also to be considered since it is based in a completely different approach than SVM
and kNN. Thus, the three techniques regarded for this thesis have different approaches. The time limitation for this thesis prevents the use of more techniques.
Support Vector Machines
Support Vector Machines (SVM) is an approach for automatic classification proposed by Cortes and Vapnik (1995) originally conceived to binary classification problems. SVM builds an N-dimensional space and maps all the training (see section 3.4) set instances, emails in this context, into the space. Then the SVM techniques aims to look the maximum margin hyper-plane which separates the instances mapped in the space into their two categories.
In case of multiple categories in the data set, the problem could be reduced to binary by iteratively cluster all categories but one into a single one and hence SVM would classify iteratively whether one instance is from the single category or not.
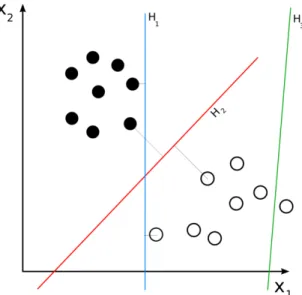
Figure 3.3.1 gives an illustrative example on how the instances would be mapped in a two-dimensional space. H1, H2 and H3 are vectors that could be built in this plane although H3 would be automatically disregarded since it does not separate instances. Between H1 and H2, the first one would be also disregarded since the margin provided by H2 is the maximum achievable margin (represented with discontinuous lines).
Yang and Liu (1999) showed that SVM is the best text classifier in their work and it is also known that through the high dimensional spaces that SVM build high dimensional data can be properly
Figure 3.3.1: two-dimensional SVM example. Source: Wikipedia (2008)
classified. Thus, SVM will be one of the three techniques performed in this master thesis. The SMO function implemented in Frank et al. (2008) in the mentioned WEKA implements a SVM classifier and will be used to perform this approach.
k-Nearest Neighbor
k-Nearest Neighbor is an approach that places all the training instances as vectors in a high-dimensional space and marks them with their category. k is a parameter that needs to be fixed and denotes the number of the nearest instances to a new instance. These k-Nearest instances’ categories will be the relevant information needed to make the classification. There are different measures of distance between instances nevertheless the typical Euclidean measure is usually used. Thus, the distance between the two instances in the space is given by the Pythagorean formula1.
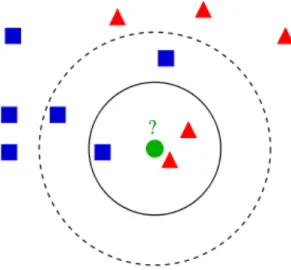
Figure 3.3.2 gives an illustrative example on how a new instance is classified depending on its nearest instances. Triangles and squares are the training instances already placed in a two dimensional space and the circle is the feature to be classified. In the figure is also shown the influence of k in the classification. While the circle would be classified as triangle with k =3, in case k = 5, it would be classified as square.
In the work of Yang and Liu (1999) kNN outperformed most of the approaches results and, a part from that, the kNN performance is usually tied to the homogeneity of the categories in the data set and hence kNN will provide information about the data set even though it does not provide an
Figure 3.3.2: two dimensional kNN example. Source: Ajanki (2007)
1 In a two-dimension space, the Pythagorean formula is: a2 + b2 = D2 , where “a” and “b” represent the
outstanding classification. The Ibk function in Inglis et al. (1991) implements the kNN classifier for WEKA and will be used to perform this approach
Naive Bayes
The Naive Bayes classifier is an approach based on the Bayes’ theorem. The reason why it is so-called Naive is because it assumes that every feature is independent from each other. Kamruzzaman and Rahman (2004) state that categorization in Naive Bayes is given by:
Where n denotes the number of features observed, fi denotes the features observed, p denotes probability and c denotes category. This formula is computed for all emails and for all the categories. To summarize, the NB technique determines given an email in which the features f1,..,fn appear, the category in which these features appear more frequently.
The Naive Bayes function available at Trigg and Frank (1995) implements a Naive Bayes classifier for WEKA and will be used to perform this approach.
3.4. Evaluation
Before building models, the training and test sets have to be defined. During the previous section has been introduced that the chosen classifiers need first a train set in order to build a model and classify the test set. Two approaches can be performed in this point. First, splitting the data set into two fixed subsets. One of them would become the training set, usually with the 60-70% of emails and the other one would become the test set. However, since the data set provided has not a large amount of emails and some categories have a very few number of emails annotated it is not recommended.
Therefore, the approach performed will be a k-fold cross-validation, which consists in dividing the data set in k folds. The process of training and testing is done iteratively k times in order to perform
the test with all folds once a time, thus, each iteration k - 1 folds are used to perform the training and one of them is regarded as the test set. This approach will ensure that all the emails have been tested once by the classifiers. The k will be fixed at 10. 10-fold crosss-validation can also be performed in the WEKA tool.
As Yang and Liu (1999) show in their work, the classifiers’ performances can be analyzed and compared by the measures obtained from the confusion matrix. Furthermore, both global results measures, which are also called macro level measures, and single categories measures, also called micro level, will be regarded. Next, in Table 3.4.1 and Figure 3.4.1 the measures used and how they are obtained from the confusion matrix.
Category 1 Category 2 Classified as 1 True Positive False Positive
Classified as 2 False Negative True Negative
Table 3.4.1: Confusion matrix definition
Figure 3.4.1: Precision, Recall and F-measure definition. Source: Wikipedia (2011)
The True Positives (“tp” in the formulae) and the True Negatives (“tn”) represent the correctly classified emails; the False Positives (“fp”) represent the emails that do not belong to a certain class but they are misclassified as if they were; the False Negatives (“fn”) represent the emails that belong to a certain class but they are classified as if they belonged to another one. The measures precision and recall are computed using these confusion matrix definitions. Therefore, Precision represents the rate of the correctly classified emails as a certain category from all the emails classified as this category. On the other hand, Recall represents the rate of correctly classified emails among all emails which belong to a category. F-measure is the mean of these two measures.
For computing the global measures, all categories in the data set will be considered. 11 in this thesis context. On the other hand, for computing the measures for each of the single categories, the confusion matrix is reduced into two dimensions. In this case, one of the two dimensions represents one category and the second dimension represents the rest of them.
The comparison of the performances of the approaches is made comparing the values of precision, recall and f-score. Since F-score is a measure that average precision and recall, F-score will be used to determine the best classification among all. The classification with the highest weighted F-score measure will be regarded as the best classification. However, precision, recall and f-measure for each category are also to be regarded since may give further information about the classifications.
4. Data and Results
In this chapter, an analysis of the original data will be made. Moreover, the results of the different methods used will be shown and analyzed, first individually, and, in the end, an overall approach analysis will be made in both macro and micro level. Finally, results obtained during this master thesis will be compared to Dalianis et al. (2011) work.
4.1. Data
The data provided for this master thesis had already been preprocessed in previous work. A de-identification process was performed by Knutsson et al. (2010). Both compound splitting and lemmatization were performed in Dalianis et al. (2011). Hence, the data was already deidentified and compound split, lemmatized and both compound split and lemmatized data was given. It consists of 4565 files which every single one of them contains one email written to the SSIA. Most of them are written in Swedish, however, some of them are also written in other languages. All the emails were also manually annotated in 11 categories as described in Dalianis et al. (2010).
Table 4.1.1 shows the number of emails annotated that each category has.
Category name #email
1. Change the taxation on my pension 39
2. When will you decide my housing allowance? 145
3. Questions in any other language 11
4. How many days of parental benefits remain? 104
5. When do I get the money? 610
6. Other questions 3222
7. Pension estimation 60
8. Child allowances 125
9. Want a beneficiary certificate 156
10. Want an EU card 32
11. Want a form 61
Total 4565
Figure 4.1.1 shows an histogram with the different categories that the emails are annotated with. #email 0 1000 2000 3000 4000 1 2 3 4 5 6 7 8 9 10 11
The numbers in Figure 4.1.1 represent the number of the category in table 4.1.1. Figure 4.1.1 shows the difference between the number of emails annotated in categories is noticeable. The numbers in the Table 4.1.1 show that there is an outstanding amount of emails annotated as number 6 (Other questions), from the numbers in Table 4.1.1 it can be calculated that 70.58% of emails belong to this category. On the other hand, there are categories such as numbers 3 (Questions in any other language) and 10 (Want an EU card) with very few emails annotated.
The emails provided have also been de-identified since they may include sensitive information that may attempt against the writer privacy. However, they are not fully identified. One email which does not give any sensitive information is shown as a sample in Appendix B.
4.2. Results
In this section, the results of the different classification techniques using different features will be shown. For each approach will be provided precision, recall and f-score considered relevant as well as the number of features, which will give an idea of the dimensionality and the classification cost.
In order to facilitate the reading, the following tables in this section summarize the results obtained from the approaches. The categories’ results shown in the tables are those which are regarded in the
analysis following the tables. Since category number 6 (Other questions) is the largest category in the data set, it will be regarded in all approaches. The complete tables can be seen at Appendix C.
4.2.1. Original data
The features used in this approach are extracted from the emails provided with no need to preprocess them. The data provided for this master thesis included the following:
1) Compound words split 2) Lemmatized emails
3) Compound words split and lemmatized emails at the same time.
Table 4.2.1.1 shows the results for the original data with no preprocessing.
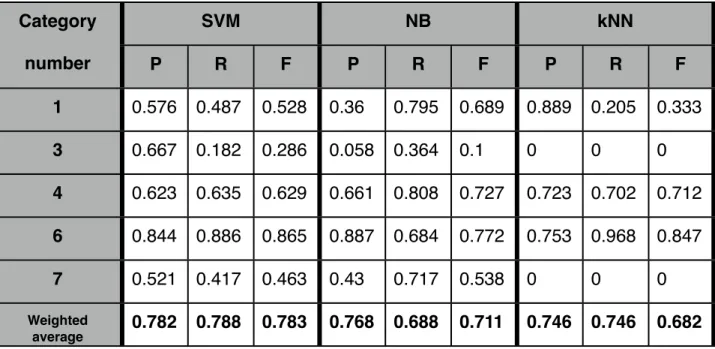
Category SVM NB kNN number P R F P R F P R F 1 0.576 0.487 0.528 0.36 0.795 0.689 0.889 0.205 0.333 3 0.667 0.182 0.286 0.058 0.364 0.1 0 0 0 4 0.623 0.635 0.629 0.661 0.808 0.727 0.723 0.702 0.712 6 0.844 0.886 0.865 0.887 0.684 0.772 0.753 0.968 0.847 7 0.521 0.417 0.463 0.43 0.717 0.538 0 0 0 Weighted average 0.782 0.788 0.783 0.768 0.688 0.711 0.746 0.746 0.682 Number of features:275
The results in Table 4.2.1.1 show that SVM performs better than NB and kNN using the original emails since SVM gets a better score in precision, recall and F-measure. However, NB global results are not far from SVM and in categories number 1 (Change the taxation on my pension), 4 (How many days of parental benefits remain) and 7 (Pension estimation) performs better than SVM. One reason for this to happen is that SVM works better than NB with high dimensionality but NB detects better which are the key words for determining whether if one emails is from a specific category or not. kNN shows worse results in this case than SVM and NB, this happens because for
Table 4.2.1.1: Summed up results of table C.1, with the categories which have relevant results. The categories numbers are defined in Table 4.1.1
most of the non significance categories, for instance categories 3 (Questions in any other language) and 7 (Pension estimation), kNN is unable to properly classify them. The reason is that category number 6 (Other questions) is so big that kNN classifies most of the emails of the other categories as this category’s emails. This difference induces kNN to find lots of similar emails in category number 6 (Other questions) and hence misclassify them.
Table 4.2.1.2 shows the results for the original data with the compounds words split.
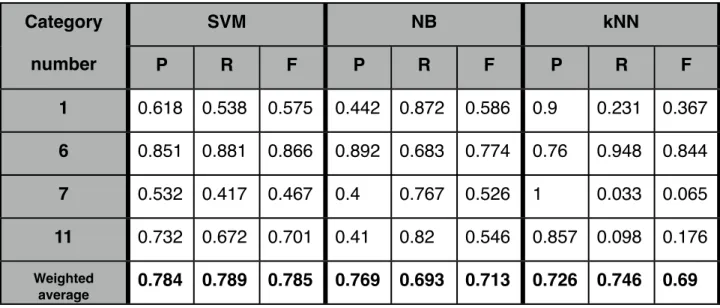
Category SVM NB kNN number P R F P R F P R F 1 0.618 0.538 0.575 0.442 0.872 0.586 0.9 0.231 0.367 6 0.851 0.881 0.866 0.892 0.683 0.774 0.76 0.948 0.844 7 0.532 0.417 0.467 0.4 0.767 0.526 1 0.033 0.065 11 0.732 0.672 0.701 0.41 0.82 0.546 0.857 0.098 0.176 Weighted average 0.784 0.789 0.785 0.769 0.693 0.713 0.726 0.746 0.69 Number of features:297
The first noticeable fact in Table 4.2.1.2 is that new features obtained from the compound words split are useful to the classification. The averaged precision, recall and F-score of SVM and NB slightly improve, moreover, recall and F-score also improve in kNN. Thus, new key words could help classifiers to classify the emails in the right category. Nevertheless, the three of the techniques slightly improve their results when using the compound split data set. Category number 6 (Other questions) is still the best classified by all the techniques used. Focusing on NB, the categories number 1 (Change the taxation on my pension) and 11 (Want a form) have improved their results. Compound words split facilitate these categories classifications, however, since they are not significant categories, the outperformance of these categories does not affect the global NB’s results. Regarding kNN, the results are still bad if they are compared to the other classifiers but it has slightly improved in some categories that previously kNN did not take into account when classifying, such as number 7 (Pension estimation) and 8 (Child allowances).
Table 4.2.1.2: Summed up results of table C.2, with the categories which have relevant results. The categories numbers are defined in Table 4.1.1
Table 4.2.1.3 below shows the results for the original data with all emails lemmatized. Category SVM NB kNN number P R F P R F P R F 1 0.622 0.59 0.605 0.431 0.795 0.559 0.769 0.256 0.385 2 0.564 0.641 0.6 0.507 0.772 0.612 0.718 0.352 0.472 4 0.61 0.615 0.612 0.656 0.827 0.732 0.724 0.683 0.703 6 0.848 0.883 0.865 0.883 0.692 0.776 0.779 0.946 0.854 7 0.532 0.417 0.467 0.557 0.65 0.6 0.778 0.117 0.203 Weighted average 0.783 0.79 0.785 0.777 0.696 0.722 0.752 0.763 0.717 Number of features: 247
In Table 4.2.1.3, the amount of attributes used in the classification has decreased, which means that this classification has a lower cost than the previous ones. Once again, SVM is the technique that classifies emails the best. The performances of NB and kNN are slightly better again if they are compared to the original (see Table 4.2.1.1), which means that lemmatization also helps to NB identify better some key words and facilitate kNN the comparison between emails. The results from categories provided are better if they are compared to the results shown in Table 4.2.1.1 which means that lemmatization improves the classification of the original emails.
Table 4.2.1.3: Summed up results of table C.3, with the categories which have relevant results. The categories numbers are defined in Table 4.1.1
Table 4.2.1.4 shows the results for the original data with all emails both compound words and lemmatized. Category SVM NB kNN number P R F P R F P R F 2 0.553 0.648 0.597 0.549 0.807 0.654 0.591 0.559 0.574 4 0.591 0.625 0.607 0.593 0.827 0.691 0.718 0.76 0.738 6 0.852 0.879 0.865 0.885 0.673 0.764 0.79 0.935 0.856 Weighted average 0.785 0.79 0.787 0.772 0.686 0.711 0.756 0.766 0.726 Number of features:278
Table 4.2.1.4 shows that the combination of lemmatized words and compound words split have improved the classification of both SVM and kNN but the results of NB are still the same than the results obtained from the original emails. The results show a special improvement in the categories shown when using kNN.
From the analysis of all the performances of classification techniques using al the original data provided (i.e. no preprocessing, compound words split, lemmatized and both compound words split and lemmatized), it can be stated that SVM has the best results. However, its results are stable in both micro and macro level and has the slightest improvement of all classification techniques. NB also has good results and in some certain categories, the classification improve when using the preprocessing techniques. However, NB overall results got worse when using compound words splitting and lemmatization. kNN is the technique which has improved most their results. The reason for this to happen is that the use of compound words splitting and the lemmatization of words makes the words found in the emails more uniform. Hence, kNN is able to compare better emails in the same category since emails in the same category usually contain the same words.
As for the results obtained from each category, the results provided by all three techniques for the category number 6 (Other questions) are outstanding, in particular SVM and kNN. However, since
Table 4.2.1.4: Summed up results of table C.4, with the categories which have relevant results. The categories numbers are defined in Table 4.1.1
this category is supposed to be a miscellaneous category, these results are not really significant. A part from that, the results show that the category number 3 (Questions in any other language) got a really bad classification result by all the techniques used. This happens due to the low amount of emails that are annotated with this category as well as the difference between the features of emails that are written in different languages. Regarding the rest of the categories, NB and SVM have stable results despite the changes made and kNN have bad results in all the non significant categories.
4.2.2. Stop Words removed
In this approach. the features used are the same as those used in the preceding section but all the stop words are removed from the data set before extracting the features. For a further explanation on stop words removal see section 3.1.
Table 4.2.2.1 shows the results for the original data with the stop words removed.
Category SVM NB kNN number P R F P R F P R F 3 1 0.364 0.533 1 0.273 0.429 0 0 0 4 0.523 0.221 0.311 0.478 0.423 0.449 0.438 0.067 0.117 6 0.814 0.903 0.856 0.853 0.778 0.814 0.75 0.963 0.843 8 0.685 0.608 0.644 0.457 0.72 0.559 0 0 0 11 0.756 0.557 0.642 0.565 0.574 0.569 0.938 0.246 0.39 Weighted average 0.756 0.772 0.757 0.755 0.729 0.737 0.707 0.741 0.678 Number of features:202
As can be seen in Table 4.2.2.1, removing stop words from the original emails has not improved the performance of SVM, however, NB and kNN results are better. Since the amount of features has decreased, the cost of the classification and the classification dimensionality. Thus, the classification is now easier for NB and kNN. Despite that, the best classifier is still SVM. With the
Table 4.2.2.1: Summed up results of table C.5, with the categories which have relevant results. The categories numbers are defined in Table 4.1.1
stop words removed, the level of noise in the data set has also decreased, hence the classification of some non significant categories such as 3 (Questions in any other language) and 8 (Child allowances) have increased its accuracy. On the other hand, some stop words removed from the data set were significant features for some categories. For instance, the word “kvar” (English: left) is included in the stop word list. Therefore, the classification of the category number 4 (How many days of parental benefits remain), which is related to the word “kvar”, get worse. The outperformance of NB in the classification of category number 6 (Other questions) compared to the previous classifications is also a sign that dimensionality and noise have decreased.
Table 4.2.2.2 shows the results for the original data with the stop words removed and the compounds words split.
Category SVM NB kNN number P R F P R F P R F 1 0.561 0.59 0.575 0.462 0.923 0.615 0.875 0.179 0.298 3 0.6 0.273 0.375 0.75 0.273 0.4 0 0 0 6 0.828 0.9 0.862 0.875 0.753 0.81 0.764 0.929 0.839 8 0.72 0.68 0.7 0.519 0.888 0.655 0.813 0.104 0.184 Weighted average 0.77 0.783 0.772 0.769 0.73 0.741 0.706 0.737 0.692 Number of features:225
Table 4.2.2.2 shows that the global results of using stop words removal in the compound split data set improves the preceding global results of all automatic classification techniques. However, SVM classified best without the stop words removal. In this case, the compound words splitting facilitate the classification of the category number 1 (Change the taxation on my pension) for all techniques as well as the classification of the category number 8 (Child allowances) for the kNN classification. The only significant decrease in the classification accuracy has been in the SVM classification of the category number 3 (Questions in any other language).
Table 4.2.2.2: Summed up results of table C.6, with the categories which have relevant results. The categories numbers are defined in Table 4.1.1
Table 4.2.2.3 shows the results for the original data with the stop words removed and all emails lemmatized. Category SVM NB kNN number P R F P R F P R F 4 0.593 0.644 0.618 0.633 0.731 0.679 0.724 0.683 0.703 6 0.834 0.89 0.861 0.869 0.804 0.835 0.779 0.946 0.854 Weighted average 0.774 0.783 0.775 0.777 0.757 0.764 0.752 0.763 0.717 Number of features:182
As Table 4.2.2.3 shows, global results still improve, however, SVM still have worse results when removing stop words. The category number 4 (How many days of parental benefits remain) improve its classification despite the removal of the stop word “kvar”. Since this category is the second most significant, the global results are better due to the improvement in this classification. Results also show that lemmatization facilitate to kNN classification of some other categories as well. Even if SVM has the best result, NB outperforms SVM in most of the categories but not in global due to a worst performance in category number 6 (Other questions), the most significant category.
Table 4.2.2.3: Summed up results of table C.7, with the categories which have relevant results. The categories numbers are defined in Table 4.1.1
Table 4.2.2.4 shows the results for the original data with the stop words removed, the compound words split and all emails lemmatized.
Category SVM NB kNN number P R F P R F P R F 6 0.837 0.878 0.857 0.883 0.764 0.819 0.777 0.924 0.844 Weighted average 0.771 0.778 0.772 0.779 0.741 0.752 0.724 0.747 0.706 Number of features:209
In Table 4.2.2.4 any relevant improvement has been detected when comparing these results with the lemmatized ones. The compound words split may introduce noise in the data since, as the preceding results show, lemmatization features performs better than compound words splitting features.
The best classifier using the stop words removal is SVM even if its global results have been stable and the other two approaches have improved when removing stop words from compound words split and words lemmatized data sets. However, NB could be considered the most proper classifier in this case. NB best performance improved the results of SVM in most of the categories but not in number 6 (Other questions), which, despite being the largest category, could be taken apart when comparing the classifiers results since it is a miscellaneous category. The reduction of the classification’s dimensionality clearly improves the NB’s results.
4.2.3. PoS-tagged data
The features used in this approach are obtained after preprocessing the emails and tagging all words with the Part-of-Speech tagger Granska as described on section 3.1. In the previous approaches, using the different sets of emails has been useful for analyzing the different results, thus the Part-of-Speech tagging process has been applied to all the provided data. Nevertheless, the results provided by the classifiers on the different approaches are similar and hence only the table with the best
Table 4.2.2.4: Summed up results of table C.8, with the categories which have relevant results. The categories numbers are defined in Table 4.1.1
overall results is shown (i.e. PoS-tagging and compound words split, see Table 4.2.3.1), for all cateogries.
The table below shows the results after PoS-tagging the emails with the compound words split.
Category SVM NB kNN number P R F P R F P R F 1 0.613 0.487 0.543 0.456 0.795 0.579 0.9 0.231 0.367 2 0.497 0.566 0.529 0.556 0.821 0.663 0.618 0.469 0.533 3 0.5 0.182 0.267 0.03 0.636 0.057 0 0 0 4 0.618 0.654 0.636 0.611 0.846 0.71 0.685 0.712 0.698 5 0.678 0.603 0.638 0.54 0.682 0.603 0.624 0.408 0.494 6 0.846 0.877 0.861 0.892 0.642 0.747 0.773 0.939 0.848 7 0.49 0.417 0.45 0.413 0.717 0.524 0.667 0.033 0.063 8 0.625 0.56 0.591 0.354 0.768 0.485 0 0 0 9 0.444 0.359 0.397 0.379 0.679 0.486 0.6 0.019 0.037 10 0.419 0.406 0.413 0.49 0.781 0.602 0 0 0 11 0.755 0.656 0.702 0.449 0.787 0.571 1 0.23 0.373 Weighted average 0.776 0.782 0.778 0.775 0.668 0.699 0.715 0.755 0.708 Number of features:297
Table 4.2.3.1 shows that PoS-tagging the data does not improve the classification. SVM and kNN’ results are similar to results obtained in the stop words removal and the original data sets. Besides, NB’ results are worse than those obtained in previous approaches. From the global results can be stated that the additional information about words that PoS-tagging gives can be disregarded in the NB case. On the other two classifiers, PoS tagging does not clearly improve or get worse previous results. Category number 7 (Pension estimation) gets its best results when the PoS-tagging is performed, therefore the words’ morphological information might be useful in some cases.
Table 4.2.3.1: Summed up results of table C.10, with the categories which have relevant results. The categories numbers are defined in Table 4.1.1