Multidisciplinarni znanstveni časopis
POMORSTVO
https://doi.org/10.31217/p.33.1.3 MultidisciplinarySCIENTIFIC JOURNAL
OF MARITIME RESEARCH
Floating Car Data Technology
Damir Budimir
1, Niko Jelušić
1, Mile Perić
21 University of Zagreb, Faculty of Transport and Traffic Sciences, Vukelićeva 4, Zagreb, Croatia, e-mail: [email protected]
2 University of Rijeka, Faculty of Maritime Studies, Studentska ulica 2, Rijeka, Croatia
ARTICLE INFO Review article Received 26 February 2019 Accepted 19 March 2019 Key words: Probe Vehicle
FCD (Floating Car Data) XFCD (Extended FCD) FCO (Floating Car Observer) GIS (Geographic Information System) Linear referencing
Wireless communication technologies Data processing
ABSTRACT
The limiting conditions of traffic in cities, together with the complex and dynamic traffic flows, require an efficient and systematic management and information provision for the traffic participants, with the goal to achieve better utilisation of traffic resources and preserve sustainable mobility. In that context, it is important to identify the traffic flow location features, which requires data and information. This paper presents the application of mobile vehicles for the collection of real time traffic flow data. Such data have become an important source of traffic data, since they can be collected in a simple and cost-efficient way, enabling higher coverage than the conventional approaches, despite the reliability issues. The term referring to that type of data collection, commonly used in scientific and professional literature is FCD (Floating Car Data) and “Probe vehicle”. The efficiency presentation of applying this extensive data source for retrieving necessary parameters and information related to the achievement of sustainable mobility is the final objective of this paper. A description of modern technologies that serve as a basis for probe vehicle data collection has been provided: a geographical information system (GIS), global navigation satellite system (GNSS) and related wireless communication. Within the key technologies review, the development possibilities of data collection by mobile sensors have also been presented.
1 Introduction
The traffic flow data collection is necessary in traffic engineering but also for the efficient management sys-tem functioning and for the series of other ITS (Intelligent Transport Systems) applications, setting real time require-ments. Real time data are important for achieving sus-tainable urban mobility since they enable adaptive traffic management i.e. the management system is able to con-stantly adjust the decisions to the real traffic conditions. This is valid also for other services such as: third genera-tion navigagenera-tion, dynamic routing on the transport net-work, incident detection etc.
Today, the traffic flow data are mostly collected by the traffic flow sensors. There are several different sen-sor technologies and commercial products of various fea-tures and prices. Depending on the traffic management system requirements, in order to select the most suitable
traffic flow sensors, a specification of the needed traffic flow parameters has to be defined. The key deficiencies of traffic flow sensors are a low transport network cover-age and an impossibility to retrieve O-D (origin – desti-nation) data.
One of the new real time traffic flow and transport sys-tem data collection methods is the application of mobile platforms and GNSS (Global Navigation Satellite Systems).
The terms used in Anglo-Saxon scientific and professional literature referring to this type of data collection are FCD (Floating Car Data) and Probe Vehicle. This method in-cludes the integration of multiple technologies: satellite positioning systems (GNSS), wireless communication, geo-graphic information systems. The basic principle implies a vehicle moving through the transport network and contin-uously sending data to the traffic centre. The advantages of this method are a high transport network coverage and a possibility to retrieve O-D (origin – destination) data.
Using additional sensors on the vehicle and/or the data from the vehicle information bus can extend the sent data set, which is a system known as XFCD (Extended Floating Car Data).
A significant number of papers related to FCD system development have been published. One group of articles is focused on the FCD vehicle share in the total amount of ve-hicles and the data delivery frequency. The second group is addressing the issues related to the processing of the extended data collected by the XFCD method. The third group are the articles discussing the wireless communica-tion technologies and the FCD expansion to the so-called FCO (Floating Car Observer), by using short range wireless communication technologies. There are also articles de-scribing the computer vision application for the expansion of the XFCD data set.
2 Sources of Traffic Flow Information
A traffic flow can be described as an overall flow of traffic entities (vehicles, passengers, packages…) through the service resources of the network. Depending on the perspective, a traffic entity can be a means of transport (road vehicle, train, ship, plane…), passenger or a message, a package or a call (in information transport). In the con-text of road transport, a traffic flow is a set of traffic partic-ipants changing their position in space, in relation to time. Therefore, the traffic flow can in principle be described us-ing the observed time and the spatial coordinates of traffic participants.
Today, the measurement and data collection (on the basis of which the parameters of the traffic flow values are being retrieved or calculated) can be done in several ways,
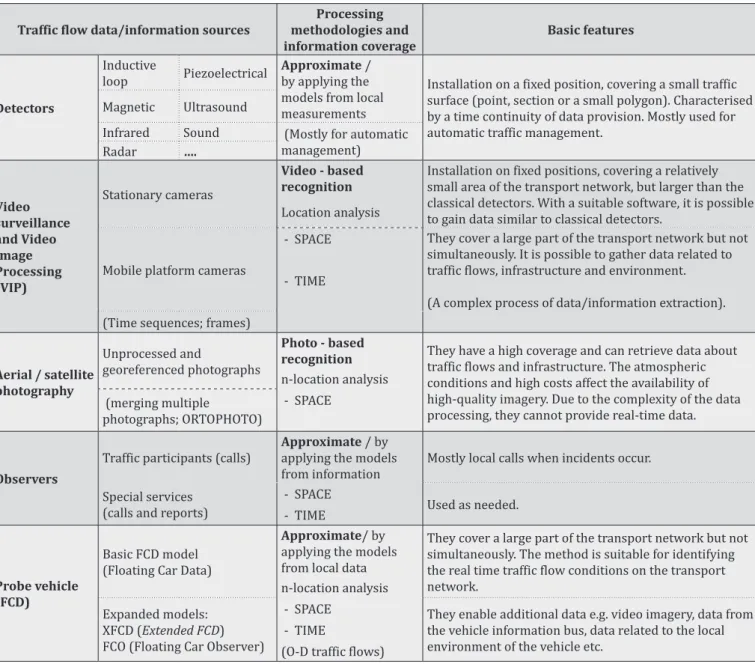
Table 1 The parallel overview of the traffic flow data and information
Traffic flow data/information sources methodologies and Processing
information coverage Basic features
Detectors
Inductive
loop Piezoelectrical Approximateby applying the / models from local measurements
Installation on a fixed position, covering a small traffic surface (point, section or a small polygon). Characterised by a time continuity of data provision. Mostly used for automatic traffic management.
Magnetic Ultrasound
Infrared Sound (Mostly for automatic management) Radar …. Video surveillance and Video Image Processing (VIP) Stationary cameras Video - based
recognition Installation on fixed positions, covering a relatively small area of the transport network, but larger than the classical detectors. With a suitable software, it is possible to gain data similar to classical detectors.
Location analysis
Mobile platform cameras
- SPACE They cover a large part of the transport network but not simultaneously. It is possible to gather data related to traffic flows, infrastructure and environment. (A complex process of data/information extraction). - TIME
(Time sequences; frames)
Aerial / satellite photography
Unprocessed and
georeferenced photographs
Photo - based
recognition They have a high coverage and can retrieve data about traffic flows and infrastructure. The atmospheric conditions and high costs affect the availability of high-quality imagery. Due to the complexity of the data processing, they cannot provide real-time data. n-location analysis
(merging multiple photographs; ORTOPHOTO)
- SPACE
Observers
Traffic participants (calls) Approximateapplying the models / by
from information Mostly local calls when incidents occur. Special services
(calls and reports)
- SPACE Used as needed. - TIME Probe vehicle (FCD) Basic FCD model (Floating Car Data)
Approximate/ by applying the models from local data
They cover a large part of the transport network but not simultaneously. The method is suitable for identifying the real time traffic flow conditions on the transport network.
n-location analysis Expanded models:
XFCD (Extended FCD) FCO (Floating Car Observer)
- SPACE They enable additional data e.g. video imagery, data from the vehicle information bus, data related to the local environment of the vehicle etc.
- TIME
(O-D traffic flows) Source: Authors
using different technologies. For example: by traffic flow sensors, video surveillance, mobile platform video imag-ing, satellite and aerial imagery, using vehicles equipped to enable satellite positioning and FCD communication etc. As the traffic flow parameters describe both the current and the historical traffic flow conditions, their application is wide. They serve as a direct manager parameter in au-tomatic management systems, as the parameters intended to be minimised or maximised through the traffic manage-ment, as service quality indicators, as evaluation indica-tors for the applied betterment measures, as input data for various simulation models or ITS (Intelligent Transport Systems) applications [1].
Besides the traffic flow parameters, other information usable in the ITS can be retrieved from the information source. The examples of such information are: the con-gestion locations, incident detection, weather and visibil-ity, road and other transport infrastructure conditions, air quality, noise etc. The transport system information sourc-es today include various modern telematic technologisourc-es, primarily different sensors, wireless communication, sat-ellite positioning, video application, but also data process-ing e.g. computer vision [2].
The methodology for an accurate and reliable assess-ment of traffic flow conditions, especially on urban roads, is the key part of the traffic management and control. In practice, different traffic data and information sources (Table 1) are used (magnetic loops, road counters, radar, Bluetooth, FCD etc.) in order to assess the traffic condi-tions and provide traffic parameters and information such as road occupancy, average speed (time taken) and corridor density. Finally, these parameters are combined for the purpose of assessing the conditions or traffic flow indicators, on the basis of the key relations between the flow, density and speed. The aforementioned relations en-able the identification of various traffic conditions
(con-gestion, free flow etc.) and events (e.g. entrance or exit to/ from a bottleneck, shock wave etc.).
The Table 1 gives an overview of the contemporary information sources based on different technologies. Regarding the FCD possibilities, in comparison to other sources, the transport network coverage is higher and there is a possibility of dynamic traffic detection (DTD), which could be highlighted as the key advantages of the concept. The FCD application is a suitable method for the identifica-tion of the network traffic flow condiidentifica-tions in real time.
3 Floating Car Data, FCD
3.1 Basic Concept of Probe Vehicle Data Collection
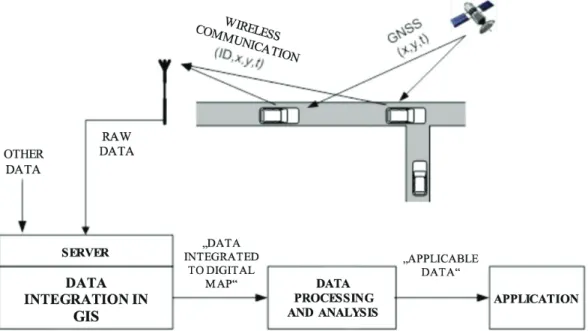
The probe vehicle data collection system (FCD) is based on several sub-systems of different technologies. Figure 1 presents the key technologies included in the probe vehicle traffic data collection, together with the possible applications of these data. The basic data, relat-ed to the vehicle position and time, are generatrelat-ed by the satellite positioning system terminal. These vehicle coor-dinates and time data are delivered as “raw” data to the processing centre. Since mobile platforms are included, a wireless communication is required. The most appropri-ate system for the location-relappropri-ated information processing and presentation is GIS (Geographic Information System).
Despite the reliability issues and mostly because of the lower costs and the higher traffic network coverage, the application of the FCD data collection system is increasing. It most often implies real-time data collection by locating the vehicle in space and time (as shown in Figure 1). The data like the vehicle location, travelling speed and direc-tion, are sent anonymously to the central processing unit and then processed in order to produce applicable data and/or information.
Today, the vehicles used as probes usually belong to a fleet, most often taxi service, since they are already equipped by an OBU device (On – Board – Unit; a device for receiving, sending and processing data; mobile compu-ter). Such mode of data collection, that includes taxi vehi-cles, is known as the “Taxi – FCD” [4]. A significant number of pilots (Berlin, Vienna, Beijing, Hefei…) and researches was launched globally (e.g. DLR - Das Deutsche Zentrum für Luft- und Raumfahrt e.v.), confirming thatthis way of data collection and processing, by using algorithms, can generate traffic information with high accuracy even with a small share of FCD in real time [5].
Therefore, one of the most important aspects of the ef-ficient application of probe vehicles is the share of probe vehicles in the total amount of vehicles. The bigger the share, the more reliable the presentation of the trans-port network conditions is. According to the paper [6], a minimal recommended share of probe vehicles is 2.4% on highways and 10% in the urban network. In other papers related to urban surroundings, e.g. [7], a minimum share of 2% is proposed, in [8] it is 10% while in [9] the mini-mum is set between 3% and 6%.
More additional data on the probe vehicle share can be found in paper [10].
The next important issue is the frequency of sending messages from the vehicle to the data processing centre. A very high frequency i.e. short time intervals between the messages, put a significant pressure on the communica-tion network and the receiving server of the probe vehicle system. If the frequency is low, and the message does not contain the record of the vehicle, the system becomes un-usable for traffic flow conditions assessment. According to [11], the interval of 30 sec generates an acceptable error in traffic conditions calculation, while an interval of 60 sec is not acceptable. Nowadays, as a consequence of using the existing fleet management systems, the frequency is most
often low. The paper [9] defines the level of congestion in Beijing by using taxi vehicles as probes, with an envisaged sending interval between 60 and 90 sec.
In addition to the aforementioned data collection approaches based on probe vehicles, a series of other systems is being developed, such as the ones based on net-working (of social network users) or free mobile (smart-phone) applications that collect data on traffic flows. For example, the Waze application differs from other clas-sical navigational applications because it focuses on the real-time data exchange among the application users. In Waze and other similar applications, during the traffic re-lated data transfer, other data are also being exchanged. Therefore, different information of interest can be pro-vided e.g. the location of police control or road works. Of course, the accuracy and the update of data depend upon the number of application users within the certain terri-tory. There are also voice information services integrated in the application, so that drivers could concentrate on the driving instead on the mobile device. The benefits of these types of applications come from enabling all users to re-port on traffic conditions.
3.2 Extended Floating Car Data (XFCD)
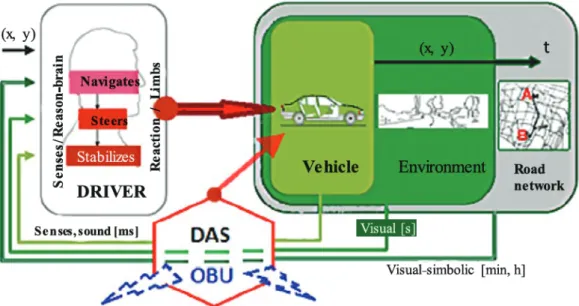
Besides the basic data, i.e. information retrieved by the probe vehicles, by using additional equipment which is today available in modern vehicles, the data set sent by probe vehicle can be significantly extended. For example, the Driver Assistance System- DAS can significantly ex-pand the basic data set [12].
In order to demonstrate the scope of the information (retrieved by the vehicle) that could be used in the FCD system, the information cycle that includes the driver is illustrated in Figure 2. In terms of the temporal aspect of data collection, the data generation occurs within several
Figure 2 Spatial and temporal aspect of the potential FCD Source: Authors
milliseconds to minutes. In spatial terms, data can be col-lected from the vehicle itself or from its surroundings suc-cessively within the transport network.
The various systems that use the data generated in the vehicle are also developed by the vehicle producers (BMW, Audi, Volvo etc.). These are most often development projects i.e. pilots related to traffic safety, which include the application of advanced systems. For example, the NFC (Near Field Communication) is a standardised contactless technology, with a short-range between two electronic devices (communication between the pedestrian with a smartphone and in–vehicle transceiver (Bluetooth or Wi‑Fi). In case of danger, these data and other information (distance from the next vehicle, records from the thermal and infrared cameras…) are being projected on the wind-shield and are also the potential sources of information for the probe vehicle system.
One of the ways to expand the data set collected by the probe vehicles is the video technology and computer vi-sion application. In case of transferring the entire georef-erenced video record, a significant amount of information can be acquired, Figure 3. However, the process of extract-ing the individual data from the video records by usextract-ing digital image processing is a complex procedure, requir-ing many software and hardware resources. Additionally, there are other specific problems such as extreme weather conditions, lighting etc. [13].
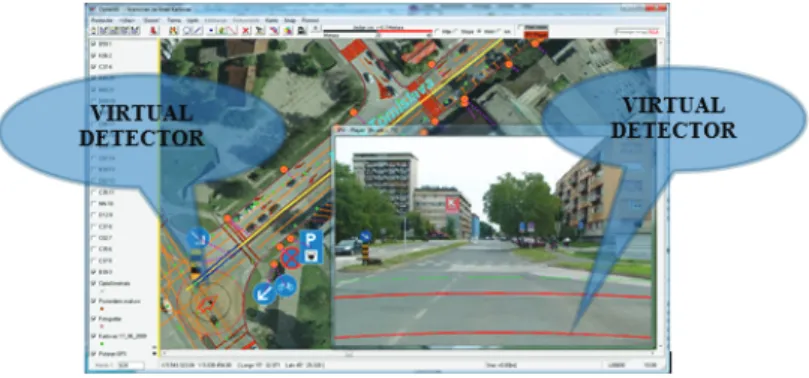
The expansion of the data set sent by the probe vehi-cle, which does not include the transfer of the entire video
record, can be achieved by the application of the so-called virtual detectors. In that case, the video record is proc-essed in the vehicle and only the data about the detected vehicles and/or information of interest are being sent [14]. In this paper [15], the authors have used the XFCD in order to assess the transport network level of service (LOS), while applying the stereovision and computer im-age processing.
3.3 Wireless Communication Technologies and a Cooperative System for Probe Vehicle Data Collection
The communication technologies which enable mobil-ity are necessary for the application of FCD. As the FCD implies a data transfer from any point in the transport net-work to the centre for FCD data receiving and processing, the most commonly used are the cellular mobile networks such as GSM (Global System for Mobile Communications)
and similar technologies GPRS (General Packet Radio Service), EDGE (Enhanced Data Rates for Global Evolution), UMTS (Universal Mobil Telecommunication System), HSPA (Evolved High‑Speed Packet Access) and LTE (Long Term Evolution), which is the first example of 4G gen-eration of mobile data transfer used from 2009 [16][17]. Figure 4 shows the basic features of mobile data transfer development.
Very suitable for the extended FCD (XFCD) and its application in the cities are the WiMax (Worldwide Interoperability for Microwave Access) networks, charac-terised by mobility and high data transfer speeds [18][19]. The short range communication technologies can also be applied in the FCD system, e.g. Wi-Fi (Wireless‑Fidelity,
IEEE 802.11), Bluetooth (IEEE 802.15.1), ZigBee (IEE 802.15.4), RFID (Radio Frequency Identification) and other NFC (Near Field Communication) technologies.
Their application is primarily related to the extension of data collection possibilities like in the case of intelli-gent cooperative sensing. For example, in paper [20] the Bluetooth technology is used for the extended data col-lection from vehicles not being directly connected to the central, but which are in the range of the vehicles who are connected. Figure 5 shows that Wi-Fi networks could be used in the same way.
Figure 3 The system of georeferenced video (developed by the Faculty of Transport and Traffic Sciences)
Source: Authors
Figure 4 Overview of mobile telecommunication data transfer technology development Source: Authors
Bluetooth technology enables a unique identification and re-identification, so that travel times in the transport network could be measured, thus theoretically identify-ing the O-D (origin – destination) data. The key problem in this approach is the time theoretically needed for estab-lishing the connection between devices.
Within the paper [20] and other research studies, such as [19], the authors have used the term FCO - Floating Car Observer, denoting a concept in which the vehicle does not only send data related to its position, but also communi-cates to other traffic participants in their proximity. In the scientific projects, e.g. FP7 (ICSI), FCO is a part of the in-telligent cooperative sensing. In these systems, there is a large amount of input data which makes the information generation from such spatially and temporally distributed data quite complex, particularly because the data are ran-dom, inconsistent, time-varying and imprecise or incom-plete. For that reason, different approaches are used for data processing – from mathematical methods and fuzzy logic [21] to neural networks [22].
The standardization of the telecommunication technol-ogies for ITS is of great importance for the successful appli-cation of the aforementioned communiappli-cation technologies in the FCD and XFCD. It is the objective of standardization organisations ITU-T (Telecommunication Standardization Sector) through the multiple study groups, primarily the SG16. This group is dealing with the standardization of the wireless communication between vehicles (V2V - Vehicle to vehicle) and between the vehicle and the infrastructure (V2I - Vehicle to infrastructure) i.e. defines the communi-cation platform for the ITS (Vehicle gateway platform for telecommunication / ITS).
Through the series of working groups, the ISO (International Organization for Standardization) is devel-oping an ISO/TC204 standard for the global integration and interoperability of telecommunication technologies in ITS environment. The vision, according to the IEEE
(Institute of Electrical and Electronics Engineers), is a glo-bally standardized network enabling communication be-tween vehicles and access points. The most important is the data exchange between vehicles moving in high speeds within the licensed radiofrequency bands for ITS applica-tions (5,85 GHz - 5,925 GHz).
In Europe, the CEN (European Committee for Standardization), CENELEC (European Committee for Electrotechnical Standardization) and ETSI (European Telecommunications Standards Institute) organizations for standardization are dealing with the standardization of traffic telematics, with Technical Committee TC 278 (TC 278 − Road transport and traffic Telematics) being the most important entity [23].
4 Basic Support Technologies to Floating Car Data Collection System
4.1 Systems of Satellite Positioning and Navigation
The fast and reliable positioning with satisfactory ac-curacy and global coverage can be achieved by the appli-cation of the Global Navigation Satellite System (GNSS). The most significant representatives of GNSS technology are the American GPS (Global Positioning System), the Russian GLONASS, the European Galileo which is in its initial implementation phase and will be operational by 2014, the Chinese Compass planned to be operational by 2015.
All these systems comprise three segments: space (or-bital-satellite) segment, control segment (ground- based) and user segment (receivers).
A low-power radio signal is used for measuring dis-tance. The signal contains the encrypted data about the sending time. Based on these data, the receiver calculates the distance to the satellite and then its own position if there are at least three “visible” satellites.
Important for the probe vehicle systems is the devel-opment of stationary ground reference stations networks, intended for the correction of the positioning calculation. The availability of these data is significantly increasing the accuracy of the probe vehicle systems. For example, in Croatia, the State Geodetic Administration (SGA) has established a national station network called CROPOS (CROatian POsitioning System) which became operational on 9th December 2008. The high level of technological and
technical quality of all system components, its administra-tion and maintenance, has enabled reliable system opera-tion and availability on 99.9% of the naopera-tional territory. The CROPOS system consists of 30 reference GNSS stations on a 70 km distance. The network of GNSS stations enables a continuous measurement processed in the controlled sys-tem, with the final results delivered to the users by mobile communications. There are three types of services availa-ble, differing on the solution method, data transfer modes, accuracy and data format.
The most significant CROPOS service, supporting the probe vehicle systems, is the Differential Positioning System (in Croatian: “Diferencijalni servis pozicioniranja”, DSP) operating in real time with 0.5 m accuracy. For that reason, it is suitable for utilisation in probe vehicle sys-tems, where, in addition to the data processing algorithms and hardware development (SIRF chip; small dimensions, low price), it enables high accuracy and high positioning speed. It intended application is in geo-informational sys-tems, navigation, traffic management, environmental pro-tection, agriculture and forestry.
The second two services:
• VPPS (in Croatian: “Visokoprecizni pozicijski servis pozi‑ cioniranja u stvarnom vremenu”) – centimetre accuracy; intended for the application in state measurements, cadastre, geodesic engineering, state boarder measure-ments, aerophotogrammetry and hydrology. This serv-ice is referred to as RTK (Real Time Kinematic) service.
• GPPS (Geodesic Post‑Processing Service) – it includes a precise geodesic positioning service of subcentimeter
accuracy, intended for the application of basic geodes-ic networks, scientifgeodes-ic and geodynamgeodes-ic research. The service requires a complex hardware and is not of inter-est for the FCD systems.
4.2 Geographical Information System
GIS, Geographical Information System is a space–ori-ented database with a set of tools used by persons and applications for the purpose of problem solving, applied to space in the real world. The GIS integrates spatial and table (non-spatial) data within the “smart” map, enabling the users to create interactive inquiries, carry out re-search, spatial information analysis and data editing.
The spatial database contains object-based spatial data: points, lines and polygons connected by the topol-ogy into logical groups (the relations between objects are defined) for the purpose of creating real-world models. Classical databases can store only numerical and textual data [24], while the GIS enables a digital presentation of the realistic space.
The result of the GIS analysis can vary from the provi-sion of simple answers, responding to questions such as “where” and “how many”, but can also reply to the most complex inquiries such as “what” and “if” [25]. GIS enables the transformation of the spatial data to relative informa-tion and correlate them to temporal variables.
Additionally, it is possible to integrate different types of data e.g. a georeferenced video [13] that can serve for the upgrading of the probe vehicle system.
It should be highlighted that the data received from the probe vehicles have a value only if observed in the spatial (geographical) context. Therefore, the linear referencing is extremely important for the FCD system, as it integrates all section related data and enables a simple application of algorithms without a need for a complex spatial interpre-tation. The complex spatial referencing is in fact geocod-ing, simply presenting length and direction (vector) and mitigating the positioning errors [3].
LINEAR REFERENCING
LINEAR REFERENCING
Figure 6 Linear referencing supported by a georeferenced video (OptaGIS, FTTS) Source: Authors
Figure 6 shows an example of linear referencing done in the OptaGIS application developed on the Faculty of Transport and Traffic Sciences (FTTS). Within this ap-proach, time can be simply added in the data model, mak-ing the analysis easier.
The basic characteristics of the linear referencing ap-plied in the traffic flow data collection, processing and presentation are the following:
• Route defining (simple route identification)
– Route segmenting into sections (the division of route into multiple segments with the starting and ending point).
• Assigning values along the route (to segments from – to)
– Establishing relations to the chainage (object locali-sation along the liner geometry).
– Unification of the geometric data into a whole. – Possibility of harmonization and re-calculation of the
chainage coordinates into the geo-coordinates and vice-verse.
– Grouping multiple features without the need for segmenting.
• Feature referencing by the application of tables
– Establishing relations between objects which do not possess geometry suitable for segments.
• Simple presentation of events along the route (visuali-zation) [26][27].
For the purpose of traffic analyses, GIS can - with the layer containing the georeferenced video – enable a driv-er’s perspective on the infrastructure, providing condi-tions that significantly differ from the ones present on-site (the possibility of stopping and repeating the scenes), thus enabling a more detailed analysis and a better perception. By further development of the georeferenced video and similar supporting technologies, new possibilities of data extraction, perception, research methods and real time traffic analysis will arise.
4.3 Methodologies of FCD Processing
An overview of the most frequently used traffic flow forecasting methods has been provided in a significant number of publications [14] [28].
The historical average method estimates the values of specific traffic parameters by calculating the average value of their historic values. A higher accuracy can be achieved by grouping data, which is based on data groups formation and averaging within these groups [29].
The parametric models are based on a final set of pa-rameters and require only the information for determin-ing the values of model parameters. These values are determined from the available traffic system data. The data set is smaller than with the non – parametric models [30]. Most often, these are the traffic simulation models. The traffic simulation is based on the idea of traffic be-haviour modelling and rules insertion, usually building on origin – destination (O-D) matrixes for the pairs of origins and destinations [31][32].
The non-parametric models require much more data than the parametric ones, which is also their main defi-ciency. However, the advantage is their flexibility, reflected in the possibilities of dynamic traffic flow modelling. The non-parametric models for traffic flow characteristics pre-diction include the methods such as K-Nearest Neighbour, [33][34], Weighted Regression [35], Fuzzy Logic [36], Bayesian Networks [37][38] and Neural Networks [39] [40].
The literature review has shown that most of the pa-pers dealing with travel time forecasting use the regres-sion method. The regresregres-sion is a method anticipating the value of numerical data. There are parametric and non-parametric regressions. Within the non-parametric regres-sion, the model parameters are determined on the basis of known data values. Based on the data parameters, the envisaged data variables are determined. Such models are also used for travel time and speed prediction [41][42]. While examples of nonparametric regression models for estimating travel time use complex statistical models [33].
One of the possible approaches to FCD processing is the application of deep analysis. According to [43], a deep data analysis is a process of knowledge retrieval from large amounts of data with the final goal to detect useful, understandable, correct, new and non-trivial patterns.
There are several models describing the deep analysis, with CRISP-DM (CRoss Industry Standard Process for Data Mining) as one of the most known and often cited models. The CRISP-DM model defines the deep analysis as an itera-tive process with an objecitera-tive to solve a certain problem [44].
When selecting a method for the FCD processing, one should pay attention to the final objective which is usually related to the speed profiles on the transport network sec-tions, identification of locations with repeating and non-repeating congestion or identification of bottle necks, also discussed by many authors.
5 Application of Information Retrieved by the Probe Vehicle (FCD)
The possibilities of applying the information gained by FCD primarily depend upon the data quality. There are three key impacts to probe vehicle data quality. The first represents the set of emitted probe vehicle data, the sec-ond, the frequency of probe vehicle data, and the third, the share of probe vehicles in the total amount of vehicles on the network [15][45].
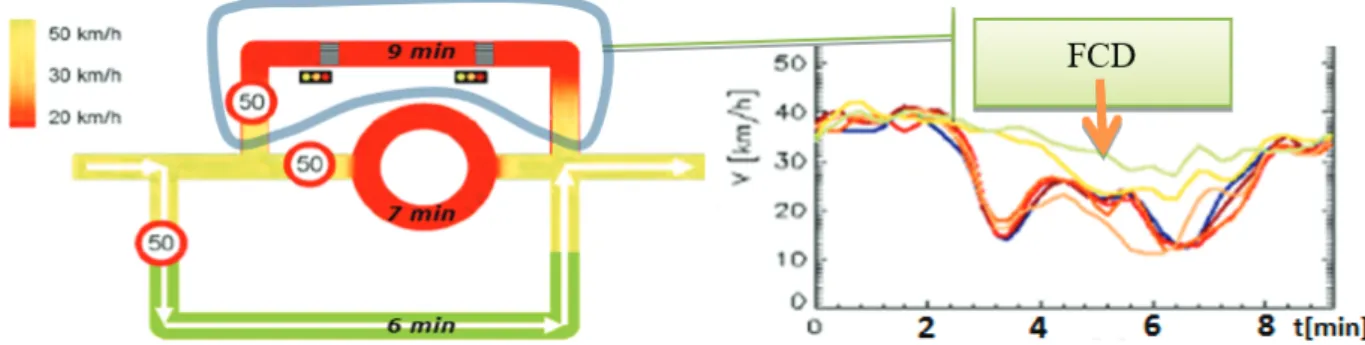
Although there are globally numerous projects related to the probe vehicle use, their share is mostly small. The current studies have been focused on the traffic flow re-construction, based on a small share of probe vehicles, with an application of interpolations and probability, like in [46]. Such processing often results in graphical pres-entations like the one in Figure 7, which clearly shows the predicted maximum travel speeds and times on road sections.
The calculation and the presentation of quantitative and qualitative parameters for traffic flow description in cities have been a subject of various researches. The quan-titative parameters encompass the number of stops on intersections, delays at intersections, O-D data, and the qualitative one refers to the level of service (LOS) [47][48]. The paper [49] has proposed a light signalling manage-ment system based on real time data from the transport system, FCD being the main data source.
Since the GPS has become a standard equipment in fleet vehicles (as it is used for the surveillance in fleet management (like taxis and trucks)), the data from taxi ve-hicles has proved to be especially useful due to the vehicle number and the coverage of all city parts [50].
If time and location related data are taken from mul-tiple test vehicles, the speed profiles can be calculated in time intervals for each road segment [51][52]. To make their usage easier, data from fleet vehicles are usually pre-processed in order to identify just the section speed or travel time as in Figure 7.
The processed probe vehicle data, which also include the processing on the GIS platform, are most commonly used for the following purposes:
• traffic management and/or regulation (traffic acci-dents, road maintenance…)
• road infrastructure capacity planning • vehicle information systems
• road design and construction • emergency interventions planning • logistic routes planning
• navigation (third generation) • toll/ parking fees collection • environmental impacts assessment
• other applications dependent on the trip length and duration.
6 Conclusion
Because of the high coverage, when compared to the detector technologies, the most commonly used data col-lection method today is the FCD. The application of the FCD implies an integration of the satellite positioning, wireless communication technologies, geographical
infor-mation system and computer data processing. Besides the basic data set, including spatial coordinates and temporal positions, the FCD (probe vehicle) can also collect other types of data such as the data from the driver assistance, video records or only information provided by the video record processing.
Today, probe vehicles are usually fleet vehicles owned by the organizations with a surveillance and vehicle track-ing system developed, e.g. taxi services, postal services and various transport operators. There is a high probabil-ity that all vehicles will become mobile sensors i.e. probe vehicles in the near future, despite of the current data privacy issues. As the share of probe vehicles in the total amount of vehicles increases, the data will become more significant and reliable, enabling their application in traf-fic management in terms of the increased capacity for adaptive management.
The literature includes a significant number of stud-ies with an objective to locate the traffic flow conditions, which could be divided into three main groups:
• focus on the determination of the average speed (sec-tion time taken),
• focus on the identification of congestions (bottlenecks) • focus on the determination of traffic flow parameters.
The indispensable part of the probe vehicle application is the geographical information system. Only after the in-tegration of probe vehicle data with other spatial data, the information is generated with a potential to be efficiently used. The presence of the topic in the previous research has been relatively low, although the subject is particularly important for urban areas. The integration of spatial data, especially data related to the transport infrastructure, in the process of information generation, is not studied pro-portionally to its potential role in the transport sector.
The application of GIS with an added layer of georef-erenced video record has provided an additional dimen-sion of virtual space visualization. The application of the georeferenced video, although demanding significant resources during the system set up and data extractions, represents a good data and information source, enabling various analyses and monitoring the transport network dynamics. In transport engineering, the georeferenced video has contributed to the simple data collection and
Figure 7 The illustration of the resulting speed profiles retrieved by mobile sensing Source: Authors
the possibility of subsequent, time unlimited, detailed and replicable analysis, which is the main advantage of this approach.
International and European organizations for stand-ardization have been dealing with the communication standards within the ITS environment, thus having direct effects on the possibilities of FCD system introduction in commercial applications. In the future, the communica-tion base of the probe vehicle system will most probably consist of the combination of the cellular network and some of the short-range telecommunication technolo-gies. A probable candidate for the short-range technology is the Bluetooth, as the application trend of this “cheap” technology in vehicles is growing. The new generation of WiMAX2 and 5G technologies have enabled the XFCD
de-velopment in terms of sending a large quantity of data by probe vehicles.
The probe vehicle systems have a significant potential, since every improvement of the global navigational satel-lite systems, wireless communication technologies and computer technology, can simultaneously improve the probe vehicle systems. Considering the growing applica-tion of the wireless communicaapplica-tion technologies and po-sitioning devices in the automobile industry, the growth of the aforementioned types of data collection from the transport system and their diverse application is also expected.
References
[1] N. Jelušić, “Evaluation of Sensor Technologies in Road Traf-fic Automatic Management System“, 2008.
[2] N. Jelušić, M. Anžek, i B. Ivanković, “Information Source Quality in Intelligent Transport Systems“, PROMET ‑ Traffic&Transportation, sv. 22, izd. 2, str. 125–131, ožu. 2010.
[3] D. Budimir, “Mobile Sensor-Based Estimation Method of Spatio-Temporal Indicators in Public Urban Transporta-tion“. 2016.
[4] T. Wang, T. Fang, J. Han, i J. Wu, “Traffic Monitoring Using Floating Car Data in Hefei“, u 2010 International Symposium on Intelligence Information Processing and Trusted Comput‑ ing, 2010, str. 122–124.
[5] J. J. Vinagre Díaz, D. Fernandez Llorca, A. B. Rodríguez González, R. Quintero Minguez, A. Llamazares Llamazares, i M. A. Sotelo, “Extended Floating Car Data System: Experi-mental Results and Application for a Hybrid Route Level of Service“, IEEE Trans. Intell. Transp. Syst., sv. 13, izd. 1, str. 25–35, ožu. 2012.
[6] S. Breitenberger, B. Grüber, … M. N.-T. engineering &, i un-defined 2004, “Traffic information potential and necessary penetration rates“, trid.trb.org.
[7] J. Hong, X. Zhang, Z. Wei, i Y. Ren, “Spatial and Temporal Analysis of Probe Vehicle-based Sampling for Real-time Traffic Information System“, u 2007 IEEE Intelligent Vehicles Symposium, 2007, str. 1234–1239.
[8] R. Long Cheu, C. Xie, i D.-H. Lee, “Probe Vehicle Population and Sample Size for Arterial Speed Estimation“, Comput. Civ. Infrastruct. Eng., sv. 17, izd. 1, str. 53–60, sij. 2002.
[9] J. Sun, H. Wen, Y. Gao, i Z. Hu, “Metropolitan Congestion Performance Measures Based on Mass Floating Car Data“, u 2009 International Joint Conference on Computational Sci‑ ences and Optimization, 2009, sv. 2, str. 109–113.
[10] E. Vanhauwaert, W. Vandenberghe, P. Demeester, I. Moer-man, i S. Verbrugge, “Feasibility of expanding traffic moni-toring systems with floating car data technology“, IET Intell. Transp. Syst., sv. 6, izd. 4, str. 347–354, pros. 2012.
[11] C. Nanthawichit, T. Nakatsuji, i H. Suzuki, “Dynamic estima-tion of traffic states on a freeway using probe vehicle data“,
Doboku Gakkai Ronbunshu, izd. 730, str. 43–54, kol. 2003. [12] J. Küçükay, F., Bergholc, “Driver Assistant Systems, Institute
of Automotive Engineering“, 2010.
[13] I. Dadić, G. Luburić, i D. Budimir, “Surveying-video trans-port infrastructure as an alternative and supplement to conventional databases“, u 34th International convention on information and communication technology, electronics and microelectronics, 2011, str. 363–367.
[14] D. Budimir, D. Brčić, i N. Jelušić, “Analiza operativnih kara-kteristika javnog gradskog prijevoza temeljem prikupljanja podataka pokretnim osjetilima“, u docs.mipro‑proceedings. com, 2015, str. 1351–1356.
[15] W. ZHANG, J. XU, H. WANG, “Urban Traffic Situation Calcula-tion Methods Based on Probe Vehicle Data“, J. Transp. Syst. Eng. Inf. Technol., sv. 7, izd. 1, str. 43–48, velj. 2007.
[16] C. Ide, B. Dusza, i C. Wietfeld, “Energy efficient LTE-based Floating Car Data collection for dynamic traffic forecasts“, u 2012 IEEE International Conference on Communications (ICC), 2012, str. 6303–6307.
[17] G. Remy, S.-M. Senouci, F. Jan, i Y. Gourhant, “LTE4V2X - im-pact of high mobility in highway scenarios“, u Global Infor‑ mation Infrastructure Symposium ‑ GIIS 2011, 2011, str. 1–7. [18] C. Ide i ostali, “Efficient Floating Car Data Transmission via
LTE for Travel Time Estimation of Vehicles“, u 2012 IEEE Ve‑ hicular Technology Conference (VTC Fall), 2012, str. 1–5. [19] M. Markiewicz, “Comparison of travel times estimation
us-ing intelligent infrastructure and floatus-ing car data“, u 2012 12th International Conference on ITS Telecommunications, 2012, str. 375–379.
[20] S. Ruppe, M. Junghans, M. Haberjahn, i C. Troppenz, “Aug-menting the Floating Car Data Approach by Dynamic Indi-rect Traffic Detection“, Procedia – Soc. Behav. Sci., sv. 48, str. 1525–1534, 2012.
[21] F. Haußer i Y. Luchko, Mathematische Modellierung mit MAT‑ LAB: Eine praxisorientierte Einführung. Spektrum, 2010. [22] H. Dia i K. Thomas, “Development and evaluation of arterial
incident detection models using fusion of simulated probe vehicle and loop detector data“, Inf. Fusion, sv. 12, izd. 1, str. 20–27, 2011.
[23] D. Majcen, “Wireless Technologies in Intelligent Transporta-tion Systems“, 2012.
[24] M. F. Goodchild, “Geographic information systems and sci-ence: today and tomorrow“, Procedia Earth Planet. Sci., sv. 1, izd. 1, str. 1037–1043, 2009.
[25] M. Batty, M. Dodge, B. Jiang, i A. Hudson-Smith, “GIS and ur-ban design“, (CASA Work. Pap. 3). UCL (University Coll. Lon‑ don), Cent. Adv. Spat. Anal. London. 1998.
[26] T. Miwa, D. Kiuchi, T. Yamamoto, i T. Morikawa, “Develop-ment of map matching algorithm for low frequency probe data“, Transp. Res. Part C Emerg. Technol., sv. 22, str. 132– 145, lip. 2012.
[27] B. Mu, J. Hu, T. Zhao, i Y. Zhang, “Evaluating the Performance of Link Travel Time Estimation Based on Floating Car Data“, u 2010 International Conference on Optoelectronics and Im‑ age Processing, 2010, sv. 1, str. 504–508.
[28] J. van Hinsbergen i F. Sanders, “Short Term Traffic Predic-tion Models“, ITS World Congr. Beijing, China, str. 18, 2007. [29] W. Weijermars i E. van Berkum, “Analyzing highway flow
pat-terns using cluster analysis“, u Proceedings. 2005 IEEE Intel‑ ligent Transportation Systems, 2005., 2005, str. 831–836. [30] M. D. Delis, A. Koutsomanoli-Fillipaki, C. K. Staikouras, i G.
Katerina, “Evaluating cost and profit efficiency: a compari-son of parametric and nonparametric methodologies“, Appl. Financ. Econ., sv. 19, izd. 3, str. 191–202, velj. 2009.
[31] Y. Kamarianakis i P. Prastacos, “Forecasting Traffic Flow Conditions in an Urban Network: Comparison of Multivari-ate and UnivariMultivari-ate Approaches“, Transp. Res. Rec. J. Transp. Res. Board, sv. 1857, str. 74–84, sij. 2003.
[32] D. Boyce, “Forecasting Travel on Congested Urban Trans-portation Networks : Review and Prospects for Network Equilibrium Models 1 1 Introduction 2 The Origins of Travel Forecasting Models“, Traffic, sv. 2003, izd. August 2003, str. 1–36, 2004.
[33] B. L. Smith, B. M. Williams, i R. Keith Oswald, “Comparison of parametric and nonparametric models for traffic flow forecasting“, Transp. Res. Part C Emerg. Technol., sv. 10, izd. 4, str. 303–321, kol. 2002.
[34] R. K. Oswald, W. T. Scherer, i B. L. Smith, Traffic flow forecast‑ ing using approximate nearest neighbor nonparametric re‑ gression. University of Virginia, 2000.
[35] D. Nikovski, N. Nishiuma, Y. Goto, i H. Kumazawa, “Univari-ate short-term prediction of road travel times“, u Proceed‑ ings. 2005 IEEE Intelligent Transportation Systems, 2005., 2005, str. 1074–1079.
[36] L. Li, W.-H. Lin, i H. Liu, “Type-2 fuzzy logic approach for short-term traffic forecasting“, IEE Proc. – Intell. Transp. Syst., sv. 153, izd. 1, str. 33–40, ožu. 2006.
[37] X. F. S. Shiliang, Z. Changshui, Y. Guoqiang, L. Naijiang, “Baye-sian Network Methods for Traffic Flow Forecasting with In-complete Data in Machine Learning: ECML 2004“, Springer, sv. 3201, Springer, Berlin Heidelberg, str. 419–428, 2004. [38] Z. Changshui, S. Shiliang, i Y. Guoqiang, “A Bayesian
net-work approach to time series forecasting of short-term traffic flows“, u Proceedings. The 7th International IEEE
Conference on Intelligent Transportation Systems (IEEE Cat. No.04TH8749), 2004, str. 216–221.
[39] S. H. Huang i B. Ran, “An Application of Neural Network on Traffic Speed Prediction Under Adverse Weather Condi-tion“, researchgate.net, str. 1–21, 2006.
[40] B. Çetiner, M. Sari, i O. Borat, “A neural network based traf-fic-flow prediction model“, Math. …, sv. 15, izd. 2, str. 269– 278, 2010.
[41] H. H. Versteegt i C. M. J. Tampere, “PREDICTIME : state of the art and functional architecture“, TNO Inro Rapp. ; 2003-07, 2003.
[42] F. Gössel, “Informationsentropische, spektrale und statis-tische Untersuchungen fahrzeuggenerierter Verkehrsdaten unter besonderer Berücksichtigung der Auswertung und Dimensionierung von FCD-Systemen“, Der Fakultät für Verkehrswissenschaften der Technischen Universität Dres-den, 2005.
[43] Jiawei, “Data Mining : Concepts and“, sv. 05, str. 703, 2012. [44] U. Shafique i H. Qaiser, “A Comparative Study of Data Mining
Process Models (KDD, CRISP-DM and SEMMA)“, Int. J. Innov. Sci. Res. ISSN, sv. 12, izd. 1, str. 2351–8014, 2014.
[45] Q. Li, Q. Ge, L. Miao, i M. Qi, “Measuring Variability of Arterial Road Traffic Condition Using Archived Probe Data“, J. Transp. Syst. Eng. Inf. Technol., sv. 12, izd. 2, str. 41–46, tra. 2012. [46] A. Graser, W. Ponweiser, M. Dragaschnig, N. Brändle, i P.
Wid-halm, “Assessing traffic performance using position density of sparse FCD“, u IEEE Conference on Intelligent Transporta‑ tion Systems, Proceedings, ITSC, 2012, str. 1001–1005. [47] T. Neumann, “Rückstaulängenschätzung an
Lichtsignalanla-gen mit Floating-Car-Daten“, 2011.
[48] S. Messelodi i ostali, “Intelligent extended floating car data collection“, ELSEVIER, sv. 36, izd. 3, str. 4213–4227, tra. 2009. [49] T. Neumann, “Rückstaulängenschätzung an
Lichtsignalanla-gen mit Floating-Car-Daten“, Schriftenreihe des Instituts für Verkehrssystemtechnik. 26-lis-2011.
[50] G. Leduc, “Road Traffic Data : Collection Methods and Applica-tions“, Tech. Note JRC 47967, izd. January 2008, str. 1–55, 2008. [51] L. Xu, Y. Yue, i Q. Li, “Identifying Urban Traffic Congestion
Pattern from Historical Floating Car Data“, Procedia – Soc. Behav. Sci., sv. 96, izd. Cictp, str. 2084–2095, 2013.
[52] O. Altintasi, H. Tuydes-Yaman, i K. Tuncay, “Detection of ur-ban traffic patterns from Floating Car Data (FCD)“, Transp. Res. Procedia, sv. 22, izd. June, str. 382–391, 2017.
![Figure 5 The application of the Bluetooth technology in the probe vehicle system [20]](https://thumb-us.123doks.com/thumbv2/123dok_us/1441931.2693087/6.892.158.746.104.399/figure-application-bluetooth-technology-probe-vehicle.webp)