A FRAMEWORK FOR SMART TRAFFIC MANAGEMENT USING HETEROGENEOUS DATA SOURCES
Angelica Milagros Salas Jones
BEng, MSc, PGCert
A thesis submitted in partial fulfilment of the requirements of the University of Wolverhampton for the degree of Doctor of Philosophy (PhD)
March 2020
This work or any part thereof has not previously been presented in any form to the University or to any other body whether for the purposes of assessment, publication or for any other purpose (unless otherwise indicated). Save for any express acknowledgements, references and/or bibliographies cited in the work, I can confirm that the intellectual content of the work is the result of my own efforts and of no other person.
The right of Angelica Milagros Salas Jones to be identified as author of this work is asserted in accordance with ss. 77 and 78 of the Copyright, Design and Patents Act 1988. At this date, the author owns copyright.
Signature………
- i -
Abstract
Traffic congestion constitutes a social, economic and environmental issue to modern cities as it can negatively impact travel times, fuel consumption and carbon emissions. Traffic forecasting and incident detection systems are fundamental areas of Intelligent Transportation Systems (ITS) that have been widely researched in the last decade. These systems provide real time information about traffic congestion and other unexpected incidents that can support traffic management agencies to activate strategies and notify users accordingly. However, existing techniques suffer from high false alarm rate and incorrect traffic measurements. In recent years, there has been an increasing interest in integrating different types of data sources to achieve higher precision in traffic forecasting and incident detection techniques. In fact, a considerable amount of literature has grown around the influence of integrating data from heterogeneous data sources into existing traffic management systems.
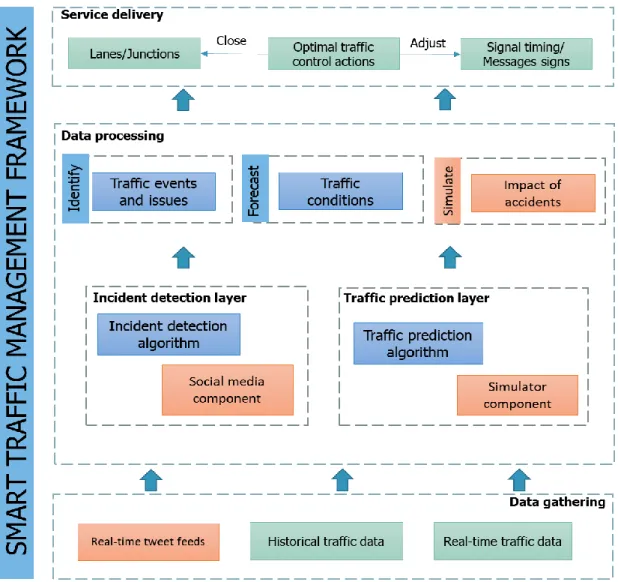
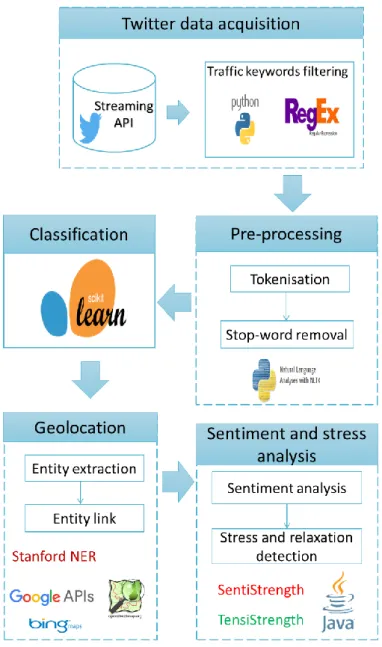
This thesis presents a Smart Traffic Management framework for future cities. The proposed framework fusions different data sources and technologies to improve traffic prediction and incident detection systems. It is composed of two components: social media and simulator component. The social media component consists of a text classification algorithm to identify traffic related tweets. These traffic messages are then geolocated using Natural Language Processing (NLP) techniques. Finally, with the purpose of further analysing user emotions within the tweet, stress and relaxation strength detection is performed. The proposed text classification algorithm outperformed similar studies in the literature and demonstrated to be more accurate than other machine learning algorithms in the same dataset. Results from the stress and relaxation analysis detected a significant amount of stress in 40% of the tweets, while the other portion did not show any emotions associated with them. This information can potentially be used for policy making in transportation, to understand the users’ perception of the transportation network. The simulator component proposes an optimisation procedure for determining missing roundabouts and urban roads flow distribution using constrained optimisation. Existing imputation methodologies have been developed on straight section of highways and their applicability for more complex networks have not been validated. This task presented a solution for the unavailability of roadway sensors in specific parts of the network and was able to successfully predict the missing values with very low percentage error. The proposed imputation methodology can serve as an aid for existing traffic forecasting and incident detection methodologies, as well as for the development of more realistic simulation networks.
- ii -
Table of Contents
Abstract ... i
Table of Contents ... ii
List of tables ... vii
List of figures ... ix
List of abbreviations ... xii
Dedication ... xiv
Acknowledgments ... xv
List of publications... xvi
Chapter 1: Introduction ... 1
1.1 Background and motivation ... 1
1.2 Research questions ... 5
1.3 Aim and objectives ... 5
1.4 Research methodology ... 7
1.4.1 Phase 1: Problem identification and objectives of a solution ... 7
1.4.2 Phase 2: Design and development ... 8
1.4.3 Phase 3: Demonstration ... 8
1.4.4 Phase 4: Evaluation ... 8
1.4.5 Phase 5: Communication ... 9
1.5 Research gaps and contribution to knowledge ... 9
1.6 Thesis outline ... 10
Chapter 2: Overview of Traffic Management Systems ... 13
2.1 Introduction ... 13
2.2 Traffic variables, sensors and algorithms ... 14
- iii -
2.2.2 Sensor Technologies ... 17
2.2.3 Algorithms ... 24
2.3 Survey of Traffic Management Systems ... 28
2.3.1 Incident Detection Systems ... 28
2.3.2 Traffic forecasting systems ... 31
2.3.3 Traffic flow modelling ... 34
2.4 Imputation methodologies for missing traffic data ... 37
2.5 Transportation for smart cities ... 40
2.5.1 The smart city concept ... 40
2.5.2 Smart mobility applications ... 42
2.5.3 Challenges and future perspectives ... 47
2.6 Research gaps ... 50
2.7 Summary ... 51
Chapter 3: Social media for transportation ... 53
3.1 Introduction ... 53
3.2 Twitter as a sensor ... 54
3.2.1 Characterisation of Twitter ... 55
3.2.2 Accessing Twitter data ... 57
3.2.3 Twitter event detection methodologies ... 60
3.2.4 Detecting sentiment from Twitter streams ... 66
3.3 Twitter based transportation research ... 68
3.4 Challenges of using Twitter data for traffic event detection ... 72
3.5 Research gaps ... 75
3.6 Summary ... 75
Chapter 4: Smart traffic management framework ... 77
- iv -
4.2 Research methodology ... 77
4.2.1 Design science research ... 77
4.2.2 Systems design methodologies ... 81
4.2.3 The study research design ... 84
4.3 Smart traffic management framework ... 85
4.3.1 Social media component ... 88
4.3.2 Simulator component ... 91
4.4 Testing and implementing the components ... 94
4.5 Summary ... 96
Chapter 5: Social media processing system ... 98
5.1 Introduction ... 98
5.2 System architecture ... 99
5.2.1 Twitter data acquisition ...100
5.2.2 Pre-processing ...103
5.2.3 Classification ...105
5.2.4 Geolocation ...109
5.2.5 Sentiment and stress analysis ...111
5.3 Description of the datasets ...113
5.4 Results ...114
5.4.1 Evaluation metrics ...114
5.4.2 Classification task ...115
5.4.3 Geolocation ...118
5.4.4 Sentiment and stress analysis ...120
5.5 Discussion ...122
5.6 Summary ...126
- v -
6.1 Introduction ...128
6.2 Real-time processing system ...128
6.3 Validation ...138
6.4 Summary ...142
Chapter 7: Optimisation-based traffic data imputation ...144
7.1 Introduction ...144
7.2 Model description ...145
7.3 Preparing the network ...147
7.3.1 Placing detectors ...147
7.3.2 Importing traffic data and running simulations ...149
7.4 Optimisation-based traffic data imputation ...151
7.4.1 Optimisation task ...154
7.4.2 Validation task ...156
7.4.3 Experiments ...157
7.5 Discussion ...169
7.6 Summary ...171
Chapter 8: Data imputation for real-time TMS applications ...173
8.1 Introduction ...173
8.2 Real-time imputation of missing flow in complex networks...173
8.3 Modelling the impact of incidents ...181
8.4 Summary ...184
Chapter 9: Conclusions and contributions to knowledge ...185
9.1 Introduction ...185
9.2 Conclusions ...185
9.3 Main original contributions ...190
- vi -
9.5 Recommendations for future research ...196
References ...198 Appendices ...217 Appendix 5-A ...217 Appendix 5-B ...219 Appendix 5-C ...220 Appendix 6-A ...224 Appendix 7-A ...226 Appendix 7-B ...228 Appendix 7-C ...231 Appendix 8-A ...235
- vii -
List of tables
Table 1-1: Research gap and contribution to knowledge of the research ... 9
Table 2-1: Advantages and disadvantages of roadway-based sensors ... 21
Table 3-1: Streaming API categories ... 58
Table 3-2: Different filtering parameters of the Streaming API ... 59
Table 3-3: Twitter API keyword tracking examples ... 59
Table 3-4: Twitter API location tracking example ... 59
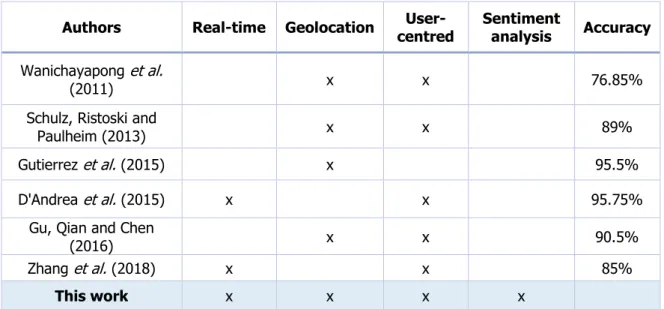
Table 3-5: Summary of traffic incident detection techniques using Twitter data ... 72
Table 4-1 Design Science Research guidelines ... 78
Table 4-2: Strengths and weaknesses of simulation packages ... 93
Table 5-1: Main attributes of a tweet used for the social media component ...103
Table 5-2: Example of Geolocation stage ...111
Table 5-3: Sentiment and stress analysis using SentiStrength and TensiStrength ..112
Table 5-4: Example of labelled tweets ...113
Table 5-5: Confusion matrix of a binary classification problem...115
Table 5-6: Evaluation metrics ...115
Table 5-7: Classifiers accuracy vs Word n-gram features...116
Table 5-8: Classifiers evaluation metrics on the test dataset...117
Table 5-9: Training and prediction time (sec) ...118
Table 5-10: NER model accuracy ...119
Table 5-11: Performance of Geolocation engines ...120
Table 5-12: Frequency of positive sentiment results ...121
- viii -
Table 5-14: Measures of central tendency for SentiStrength ...121
Table 5-15: Frequency of relaxation results ...122
Table 5-16: Frequency of Stress results ...122
Table 5-17: Measures of central tendency for TensiStrength ...122
Table 5-18: Comparing results with other studies in the literature ...123
Table 6-1: Confusion matrix of the classification task ...131
Table 6-2: Performance measure from real-time implementation ...131
Table 6-3: Interpretation of Kappa ...133
Table 6-4: Frequency table for positive emotions ...135
Table 6-5: Frequency table for negative emotions ...135
Table 6-6: Measures of central tendency for TensiStrength ...135
Table 6-7: Validation of traffic events detected from Twitter ...140
Table 6-8: Users' perception of the transport network ...141
Table 7-1: Features of the modelled network ...145
Table 7-2: Initial values for optimisation ...163
Table 7-3: Results from optimisation routine ...164
Table 7-4: MAPE of simulated results ...164
Table 7-5: Initial values for optimisation ...168
Table 7-6: Results from optimisation routine ...168
Table 7-7: MAPE of simulated results ...169
Table 8-1: Results from the validation of the imputation methodology ...179
Table 8-2: Comparison of periods with low flow and normal flow distribution ...180
Table 8-3: M6 performance indicators (percentage) ...183
- ix -
List of figures
Figure 1-1: Top ten European capitals with worst traffic jams ... 1
Figure 1-2: Causes of Highway congestion ... 2
Figure 1-3: Design Science Research methodology process ... 7
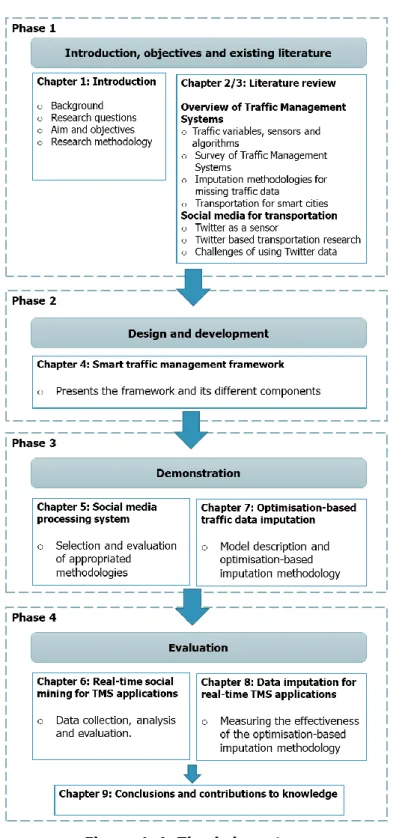
Figure 1-4: Thesis layout ... 12
Figure 2-1: TMS activities ... 14
Figure 2-2 Example of roadway-based sensors ... 18
Figure 2-3 Example of Probe Vehicle data service ... 23
Figure 2-4: Smart City wheel ... 42
Figure 3-1: Global social media applications in 2018, ranked by number of users (millions) ... 53
Figure 3-2: Example of a Twitter timeline ... 56
Figure 3-3: Structure of a tweet in JSON format ... 60
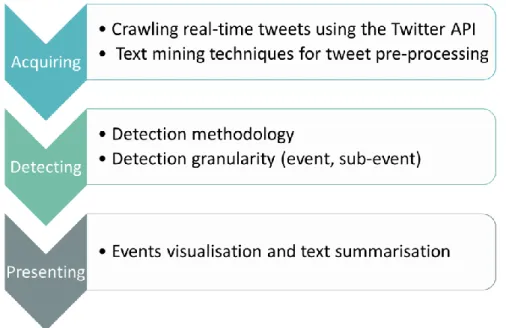
Figure 3-4: Generic event detection methodology from Twitter streams ... 61
Figure 4-1: Level of maturity of the different DSR outputs ... 80
Figure 4-2: DSR Knowledge contribution framework ... 81
Figure 4-3: Systems Design Lifecycle ... 83
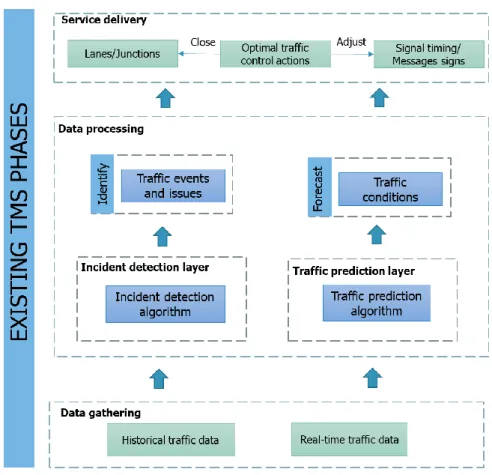
Figure 4-4: Existing TMS phases ... 86
Figure 4-5: Smart traffic management framework ... 88
Figure 4-6: Social media data processing system ... 89
Figure 5-1: System architecture of the social media component ...100
Figure 5-2: Map view of the location bounding box ...102
- x -
Figure 5-4: Creating a text classification model ...106
Figure 5-5: Comparison of Positive and Negative sentiment ...126
Figure 5-6: Comparison of Stress (negative) and Relaxation (positive) ...126
Figure 6-1: Revised system architecture for social media component ...129
Figure 6-2: Interpretation of the study's kappa score ...134
Figure 6-3: Top 100-word cloud inspection ...136
Figure 6-4: Stress perception on specific motorways (percentage)...136
Figure 6-5: Geolocation results linked to stress analysis ...137
Figure 7-1: City of Birmingham vs Modelled network ...145
Figure 7-2: Major intersections in the model ...146
Figure 7-3: Examples of roundabouts in the model ...147
Figure 7-4: Example of a detector and its corresponding description ...148
Figure 7-5: Flow distribution example ...150
Figure 7-6: Proposed optimisation-based imputation methodology ...153
Figure 7-7: Location of the experiments ...157
Figure 7-8: Optimisation-based traffic data imputation detailed flow chart ...160
Figure 7-9: M42 J5 location in AIMSUN and Google maps ...161
Figure 7-10: Turn proportion on intersections within the M42 J5 ...162
Figure 7-11: Variable distribution for M42 Junction 5 ...162
Figure 7-12: Location in the AIMSUN model vs Google Maps ...164
Figure 7-13: Comparison of variable distribution inside intersections on the M42 J5 and M42 J4 ...165
Figure 7-14: Turn proportion on intersection within the M42 J4 ...166
- xi -
Figure 8-1: Simulated network vs Google Maps view ...174
Figure 8-2: Variable distribution in both roundabouts ...175
Figure 8-3: Relationship between inputs and exits ...177
- xii -
List of abbreviations
AI Artificial Intelligence
AID Automatic Incident Detection ANN Artificial Neural Network
API Application Programming Interface
ARIMA Autoregressive Integrated Moving Average
ASCII American Standard Code for Information Interchange
BN Bayesian Networks
CAV Connected Automated Vehicles
CPNN Constructive Probabilistic Neural Network
CRF Conditional Random Field
DSR Design Science Research
EU European Union
FCM Fuzzy C-means
FFNN Feed Forward Neural Networks
FHWA Federal Highway Administration
FN False Negative
FP False Positive
GDP Gross Domestic Product
GPS Global Positioning System
HTML HyperText Markup Language
ICT Information and Communications Technology
IoT Internet of Things
ITS Intelligent Transportation Systems JSON JavaScript Object Notation
KARIMA Kohonen Autoregressive Integrated Moving Average
KNN K-nearest Neighbours
MAPE Mean Absolute Percentage Error
MLP Multilayer Perceptron
- xiii -
NER Named Entity Recognition
NLP Natural Language Processing
NLTK Natural Language Toolkit
NN Neural Network
PNN Probabilistic Neural Network
PPCA Probabilistic Principal Component Analysis PSO Particle Swarm Optimisation
RRC Ridge Regression Classifier
RSS Residual Sum of Squares
RT Retweet
SARIMA Seasonal Autoregressive Integrated Moving Average
SDLC System Design Lifecycle
SLSQP Sequential Least Squares Programming
SMS Short Message Service
SSADM Structured Systems Analysis and Design Method
SVM Support Vector Machine
SVR Support Vector Regression
Tfidf Term-frequency times inverse document-frequency
TfL Transport for London
TMS Traffic Management System
TN True Negative
TP True Positive
UN United Nations
- xiv -
Dedication
This dissertation is dedicated to my mother, Emelinda Jones. Her sacrifice, unconditional support and constant love have sustained me throughout my life.
- xv -
Acknowledgments
First and foremost, I would like to express my deepest gratitude to my Director of Studies, Dr Panagiotis Georgakis, for the inspirational guidance, support and engagement provided throughout the period of this research. Without his uttermost flexibility and understanding, this PhD thesis would have not been accomplished. I am also very grateful to my PhD supervisor, Dr Suresh Renukappa, for his encouragements and guidance towards the completion of this thesis.
I would like to thank my fellow PhD-colleagues, for the stimulating discussions, late working times, and every moment we spent together in the last four years. Special thanks to my good friends Pablo Perez and Victor Lajas, who gave me strength, support and unconditional friendship when I needed it the most.
I would like to acknowledge the financial support provided by the government of the Dominican Republic, all through the duration of this research.
Last but not least, I would like to thank my family and loved ones, words cannot express how thankful I am for their warm love and spiritual support throughout this journey.
- xvi -
List of publications
Salas, A., Georgakis, P. and Petalas, Y. (2017) Incident detection using data from social media. In 2017 IEEE 20th International Conference on Intelligent Transportation Systems (ITSC) (pp. 751-755). IEEE.
Salas, A., Georgakis, P., Nwagboso, C., Ammari, A. and Petalas, I. (2017) Traffic event detection framework using social media. In 2017 IEEE International Conference on Smart Grid and Smart Cities (ICSGSC) (pp. 303-307). IEEE.
Jones, A.S., Georgakis, P., Petalas, Y. and Renukappa, S. (2018) Real-time traffic event detection using Twitter data. Infrastructure Asset Management, 5 (3), pp.77-84. Under review
Salas, A., Georgakis, P., Petalas, Y. and Renukappa, S. (2019). An imputation methodology for missing traffic flow data in complex networks. Transportation research
Salas, A., Georgakis, P., and Renukappa, S. (2019) Social media for policy making in transportation. Transportation research
- 1 -
Chapter 1:
Introduction
1.1
Background and motivation
Traffic congestion constitutes a social, economic, and environmental issue to modern cities as it can negatively impact travel times, safety, fuel consumption and carbon emissions. In many European cities, commuters find themselves in long tailbacks for hours due to high levels of car ownership, such that roads are operating over their capacity at peak times of the day. In 2017, commuters in Moscow and London spent an average of 91 and 74 hours respectively in peak traffic delays (See Figure 1-1) (Cookson and Pishue, 2017). In fact, drivers in the UK lost an average of 178 hours due to congestion, costing the country £7.9 billion, with London alone contributing to £4.9 billion (Reed and Kidd, 2019).
Figure 1-1: Top ten European capitals with worst traffic jams
Increases in traffic lead to more potential conflicts between drivers, and therefore, a heightened likelihood of traffic incidents. Traffic incidents can be defined as
non-91 74 69 46 44 42 40 39 39 35 0 10 20 30 40 50 60 70 80 90 100 MOSCOW LONDON PARIS OSLO BERLIN MADRID VIENNA BRUSSELS ROME WARSAW
- 2 -
recurrent events such as accidents, roadworks, disabled vehicles, inclement weather, social activities, debris, spilled loads, and other unexpected events that disrupt normal traffic. Incidents are one of the major contributors to traffic congestion, accounting for more than half of all traffic congestion as shown in Figure 1-2 (Helman, 2004; Al Rillie and Byard, 2006; FHWA, 2018;). During an incident, the normal capacity of the network is restricted, leading to bottlenecks and delays (Fonseca et al., 2009). In fact, research has indicated that highway efficiency can be decreased by up to 79%, depending on the severity of the accident (Dogru and Subasi, 2018) .
Adapted from Helman (2004)
Figure 1-2: Causes of Highway congestion
Although the most associated issue with traffic congestion is traveller delay, the most serious problem is how congestion caused by incidents may affect the safety and mobility of all travellers. For each additional minute that an incident remains on the road, the likelihood of a secondary crash growths by 2.8 percent (Khattak, Wang and Zhang, 2012). The Federal Highways Administration (FHWA) defined secondary crashes as unplanned incidents (e.g. crashes, engine stalls, overheating, running out
Incidents 25% Weather 15% Roadworks 10% Other non-recurring events 5% Poor signal timing 5% Other recurring congestion 40%
- 3 -
of fuel) that occur because of an original incident (FHWA, 2004). Secondary crashes are often more severe than the original incident, and lead to increased risks of additional crashes and reduction on highway capacity (Xu et al., 2016). In the United States, secondary crashes account for approximately 18 percent of all fatalities on highways, and around 20 percent of all traffic incidents (Yang, Bartin and Ozbay, 2013). Traffic Management Systems (TMS) can help reducing these negative effects by managing the road network, allocating resources, deploying strategies and notifying the users accordingly. Traffic forecasting and incident detection systems are fundamental areas of TMS that have been widely researched in the last decade. These systems provide real time information about traffic congestion and other unexpected incidents that can support traffic management agencies. Depending on the sources of data utilised, two types of TMS have been proposed. The first type exploits data collected from sensors placed in the transport network such as loop detectors, surveillance cameras and infrared sensors. Automatic Incident Detection (AID) algorithms detect traffic incidents by finding anomalies in the traffic data measured by these sensors. However, these systems have limitations with regards of cost, operational performance and area coverage (Dia and Thomas, 2011). The second type collects traffic data from mobile sensors, such as vehicles equipped with Global Positioning Systems (GPS) and cellular geolocation systems (Parkany and Xie, 2005). These sensors can overcome the main limitations of roadway-based sensors, namely, high installation costs and limited coverage of the transport network (D'Andrea and Marcelloni, 2017). Compared to road-based sensors, these types of sensors have the advantage of covering wider areas of the transportation network with lower associated
- 4 -
costs. Nevertheless, existing algorithms need a large volume of mobile sensors, which will require a wide among of users willing to share their location.
While there is a considerable amount of literature around traffic prediction and automatic incident detection systems, current technologies still lack of traffic parameters measurement accuracy and real-time report of traffic events (Dia and Thomas, 2011). In fact, several surveys have found that in many traffic management centres, AID systems are not in use due to high false alarm rate and low accuracy (Parkany and Xie, 2005). In addition, most of the methodologies proposed have been tested on highways, but their usability has not been confirmed for arterial roads. Finally, there is a limitation in resources to support solutions with sophisticated equipment that could guarantee higher accuracy.
A modern TMS should collect data from heterogeneous data sources and provide real-time simulation and visualisation of the transport network. Traffic simulation tools can help to visualise the impact of incidents into the expected traffic conditions, thus better decisions can be taken into consideration in case of an incident. In contrast, Djahel et al. (2015) argue that a TMS for future smart cities should incorporate social media data, in addition to traditional data sources. Social media data can enrich the real-time perception of traffic conditions in modern cities. For instance, some users turn to Twitter to report traffic incidents, to describe the traffic situation they are currently in, or to receive traffic information from official traffic management accounts. This information can potentially help to reveal the real causes of the sudden increase in congestion level and help identifying the issues that are directly affecting the transport network (De Souza et al., 2017). Moreover, it could also aid traffic management
- 5 -
agencies to have a better understanding of the citizens’ perception of the road network. Several researchers have developed different methodologies for exploiting Twitter data for traffic event detection. Although they obtained promising results in regards of accuracy, some of these studies worked on historical data rather than in real-time. In addition, it still constitutes a challenge to identify the location of the incident, as users do not tend to share their location, and it is hard to identify location from abbreviations. Finally, there is a general lack of research about incorporating user emotions for policy making.
1.2
Research questions
From the above discussion, the fundamental research questions which need answering in order to bridge the knowledge gaps are:
o To what extent Twitter data and simulations of the transport network can support TMS on a real time-basis?
o Can data from real-time streams of information be successfully used for the extraction of traffic events?
o Is the information extracted from social media useful in the context of opinion mining for transportation?
o Can a realistic traffic simulation model be built with limited availability of traffic data?
1.3
Aim and objectives
In order to fulfil the research questions stated above, this PhD thesis envisages to develop a smart traffic management framework using heterogeneous data sources. The proposed framework aims to integrate social media data and real-time simulation
- 6 -
outputs as part of existing traffic management systems. This is to be achieved through the utilisation of machine learning algorithms, Natural Language Processing (NLP) techniques, and traffic simulation tools. The objectives needed to achieve this aim are as follows:
1. To review existing developments on traffic prediction and incident detection systems, as well as the current state-of-the-art into the use of social media sources for real-world event detection.
2. To design a conceptual framework that allows the integration of heterogenous data from systems, devices and traffic simulation tools as to offer a platform for the realisation of traffic management services.
3. To develop a social media component that uses state-of-the-art NLP and machine learning techniques to process real-time Twitter data.
4. To develop a simulator component that provides large-scale real-time traffic simulations of the transport network, and a novel technique to impute missing traffic flow data.
5. To develop the proposed framework by the integration of the social media and simulator components.
6. To validate the effectiveness of the framework through its real-time deployment in the region of the West Midlands.
- 7 -
1.4
Research methodology
The main purpose behind the work in this thesis is to develop a smart traffic management framework. To this end, the methodology selected for this thesis follows the Design Science Research (DSR) methodology introduced by Hevner et al. (2004). DSR comprises the rigorous process of designing artifacts to solve observed problems, to make research contributions, to evaluate the designs, and to communicate the results to appropriate audiences (Hevner et al., 2004). Figure 1-3 presents the different phases of the DSRM process adapted to the research design of this thesis. The following subsections describe more in depth each phase and the thesis chapter related to it.
Adapted from Peffers et al. (2007)
1.4.1
Phase 1: Problem identification and objectives of a solution
The first stage of the methodology encompasses identifying the problem and justifying the value of a solution. A literature review was carried out to acquire knowledge about the problem and current solutions. Chapter 2 overviews traffic measurements, traditional sensor technologies, algorithms and existing traffic management systems methodologies. Chapter 3 explores the use of Twitter for real-world event detection, as well as the challenges involved with exploiting Twitter data. From these chapters, the research gap along with the aim and objectives of this work were identified.
- 8 -
1.4.2
Phase 2: Design and development
This phase constitutes the design and development of the artifact. The complete design of the proposed framework can be found in Chapter 4. The different natural language processing techniques, machine learning algorithms, geolocation methodologies and sentiment analysis procedures considered for the methodology are introduced in this chapter. This chapter also presents the selection of the traffic simulation tool that will be part of the simulator component of the framework.
1.4.3
Phase 3: Demonstration
This phase involves demonstrating the use of the framework to solve one or more instances of the problem. In chapter 5, different experiments are carried out to test the performance of the techniques proposed in chapter 4. The effectiveness of the proposed framework to identify and classify traffic tweets, as well as a comparison with other approaches in the literature can also be found in this chapter 5. Finally, Chapter 7 presents the simulation platform, along with the different techniques used for importing traffic data and running simulations. It also presents the optimisation procedure for the imputation of missing traffic data in complex networks.
1.4.4
Phase 4: Evaluation
This phase comprehends measuring how well the frameworks supports a solution to the problem. In this thesis, the effectiveness of the framework was evaluated with an experimental implementation of a real-time traffic event detection using Twitter data. Chapter 6 presents the results and validation from the real-time implementation of the social media processing system. In chapter 8, results from the real-time operation of the proposed imputation methodology are presented.
- 9 -
1.4.5
Phase 5: Communication
This step consists of communicating the artifact, its design and effectiveness. The main findings of the work presented in this thesis have been published in scholarly publications. This thesis resulted in two conference papers and one journal paper. The publications can be found in the list of publications section.
1.5
Research gaps and contribution to knowledge
Table 1-1 illustrates the alignment of the research gaps and the contribution to knowledge of this research, based on literature review findings from Chapter 2 and Chapter 3.
Table 1-1: Research gap and contribution to knowledge of the research
Research gap Contribution to knowledge
Smart traffic management systems do not fully exploit the combination of simulation and modelling tools and data from heterogeneous
sources.
A smart traffic management framework that exploits data from heterogeneous data sources
to improve both traffic prediction and incident detection techniques, and provide real-time
simulations of the road network. The performance of existing traffic management
systems is negatively influenced by missing
traffic data due to sensor malfunction. imputation methodology for missing traffic flow A simulator component powered by an data in complex networks using constrained
optimisation. Existing imputation methodologies for missing
traffic data work well on highways and have not been validated in complex networks. Twitter data has proven to be beneficial for
many real-world purposes but hasn’t been widely assessed in the context of transportation
applications. events and issues on real-time. It uses state-of-A social media component to identify traffic the-art techniques for processing, classifying
and geolocating the tweets on real-time. There are still many challenges associated with
mining Twitter data, related to text mining and geolocation techniques.
Opinion mining using social media data is a promising field that can help in obtaining feedback from drivers about optimal routes and
the state of the transport network.
A sentiment and stress analysis task within the social media component with the purpose of identifying the users’ perception of the transport
- 10 -
1.6
Thesis outline
Figure 1-4 illustrates an in-depth design flow layout of the thesis mapped with the DSRM stages followed by this research. The content of the thesis are detailed in the following chapters:
o Chapter 2 provides a review of the literature on the most relevant traffic parameters, sensor technologies and algorithms used for TMS. It then presents a survey of TMS related to incident detection, traffic forecasting and traffic flow modelling. The different challenges faced by these systems are highlighted in this section, along with a review of the imputation methodologies for missing traffic data found in the literature. The chapter finalises by explaining the concept of a smart city and its relevance to the transportation domain.
o Chapter 3 reviews the potential of social media data for real-world problems. It starts by surveying existing research on the identification of events using Twitter data. It then goes on to the twitter-based transportation research focused on incident detection and traffic forecasting. It also emphasises the potential of using user-generated data for policy making, and the possible impact on the transportation domain. Challenges of using Twitter data for event detection are also explained in this chapter.
o Chapter 4 introduces the smart traffic management proposed in this research. The chapter starts describing the research methodology followed, as well as the outcome of this research. In the following sections, the conceptual framework, its features and the proposed components are described more in depth. The
- 11 -
chapter also introduces the study area and the selected simulation tool for the implementation and operation of the different components.
o Chapter 5 presents the detailed architecture of the social media component. In this chapter historical Twitter data from a three months period is used to evaluate the proposed social media component. Five different machine learning algorithms are compared with the purpose of finding the most accurate classifier. During this chapter, the geolocation, sentiment and stress analysis techniques are further described and tested. Results from the implementation are compared with similar studies in the literature.
o Chapter 6 evaluates the proposed social media component over a real-time implementation. A real-time processing pipeline is created using the most accurate techniques detected in chapter 5. Traffic event data identified in Twitter were validated using events data from news websites. Results and recommendations for future work are presented at the last part of the chapter. o Chapter 7 introduces the proposed imputation methodology for missing traffic
flow data using constrained optimisation. In this chapter, the simulated network and the different processes implemented to set up the model are presented. The different experiments and results obtained from the case study evaluation of the proposed methodology are also shown in this chapter.
o Chapter 8 presents the real-time operation of the imputation methodology on a complex network. Using the different techniques develop to set up the network, a processing pipeline is created. The imputation methodology is evaluated on a 24-hour period in 15-minute intervals. A discussion of the results is provided in the final part of the chapter.
- 12 -
o Chapter 9 reports the conclusions and contributions to the body of knowledge made under this research in the area of smart traffic management. Recommendations for future work are also highlighted in the final part of this chapter.
- 13 -
Chapter 2:
Overview
of
Traffic
Management
Systems
2.1
Introduction
Traffic management systems (TMS) play an important role in the design and deployment of Intelligent Transportation Systems (ITS). These systems provide real time information about traffic congestion and other unexpected incidents that can support traffic control centres to activate strategies and notify users accordingly. A typical TMS involves of a set of complementary stages, as shown in Figure 2-1. Data gathering involves the acquisition of traffic parameters (e.g. speed, flow, density) collected from sensors placed on the transport network. Subsequently, these data are aggregated during the Data aggregation stage, with the purpose of extracting useful traffic information. The next stage, Data exploitation, uses the processed data to compute traffic forecasts, incident detection, and other traffic statistics. Lastly, the Service Delivery stage delivers the information to the users through a variety of control devices. This chapter starts by providing an overview of the most relevant traffic parameters, sensor technologies and algorithms employed in existing TMS, in section 2.2. Section 2.3 reviews existing research with regards of TMS, including incident detection systems, traffic forecasting and traffic flow modelling. Then, in Section 2.4 different imputation methodologies for missing traffic data are reviewed and discussed. A future perspective of TMS and its role in smart cities is provided in Section 2.5.
- 14 -
Figure 2-1: TMS activities
2.2
Traffic variables, sensors and algorithms
Modern traffic management centres rely in sensor technologies such as detectors, cameras and probe vehicles, to record data related to the state of the transport network. These technologies employ different traffic variables to describe the conditions of the network, e.g. speed, traffic flow and occupancy. This information arrives periodically to traffic management centres, where is processed by algorithms in order to identify anomalies or forecast the future state of the network. This section provides a general description of the most relevant traffic variables, sensor technologies and algorithms adopted in TMS.
2.2.1
Traffic variables
Traffic variables are the means used for describing the state of the network in a specific time interval. These measurements provide the basis for evaluating the performance of the transport network. The fundamentals of traffic streams measurements and definitions are based on the work of Wardrop (1952), Lighthill and Whitham (1955) and Edie (1963). Three basic variables -traffic flow, speed and density- have been
Data
gathering
aggregation
Data
Data
exploitation
Service
- 15 -
denoted the most important characteristics of traffic (Gerlough and Huber, 1976), and continue to form the underpinnings of traffic analysis (Mannering, Washburn and Kilareski, 2009). This section presents a brief description of these three traffic variables.
2.2.1.1 Traffic flow
Traffic flow, or volume, is defined as the number of vehicles passing a specific point on the highway over any period of time. It is represented by the following formula:
𝑞 = 𝑛 𝑡 where
𝑞 = traffic flow in vehicle per unit time,
𝑛 = number of vehicles passing a fixed highway point, and 𝑡 = duration of time interval.
When the term volume is used, it is understood that the corresponding value is in units of vehicle per hour (veh/h). While the flow is generally measured over the course of an hour, it can be recorded daily, hourly or sub-hourly. Mannering, Washburn and Kilareski (2009) argue that in practice, flow is usually based on the peak 15-minute interval within the hour of interest.
2.2.1.2 Traffic density
Traffic density is defined as the number of vehicles on a given length of the highway at some specified time. It is represented by the following formula:
𝑘 = 𝑛 𝑙
- 16 - where
𝑘 = traffic density in vehicle per unit distance
𝑛 = number of vehicles passing a length of the roadway 𝑙 = length of the roadway
It is usually expressed in vehicle per kilometre per lane (veh/km/lane), where the total traffic density would be the sum of the lane traffic densities. Because traffic density provides a measure of the distance between successive vehicles, it reflects mobility based on the psychological comfort of the drivers. As a result, it has been considered as the most important among the three main parameters, as it gives an indication of traffic flow quality (Quek, Pasquier and Lim, 2009).
2.2.1.3 Mean speed
Speed is commonly defined as the rate of movement in distance per unit of time, usually expressed in kilometres per hour (km/h). However, in practice, speed is defined in two ways: time mean speed and space mean speed. The first, time-mean speed, is the arithmetic mean of the vehicle speeds observed at some fixed point on the highway. It is expressed as: 𝑢̅𝑡 = ∑ 𝑢𝑖 𝑛 𝑖=1 𝑛 where
𝑢̅𝑡= time-mean speed in unit distance per unit time 𝑢𝑖 = spot speed of the ith vehicle
- 17 -
The second one, space-mean speed, tends to be more useful for traffic analysis purposes. It is defined as the time necessary for a vehicle to travel a specific part of the road, and is expressed as:
𝑢̅𝑠 =
𝑙 𝑡̿ where
𝑢̅𝑠= space-mean speed in unit distance per unit time
𝑙 = length of the roadway 𝑡̅ = average vehicle travel time
2.2.2
Sensor Technologies
A wide variety of technologies are used for detecting and providing real-time traffic information for TMS. These technologies have been divided in two categories: Roadway Based Sensors and Probe Based Sensors (D'Andrea and Marcelloni, 2017; Parkany and Xie, 2005; Kinoshita, Takasu and Adachi, 2015; Asakura et al., 2017). In the following sub-sections, the most widely used technologies within these categories will be briefly discussed.
2.2.2.1 Roadway based sensors
Roadway based sensors are amongst the most commonly used detector systems. These sensors are fixed on the pavement, installed roadside or mounted over the road (Parkany and Xie, 2005). They obtain traffic information from the point that they are located based on the vehicles passing the detection zone. Traditional roadway-based sensors such as inductive loop detectors and microwave sensors have been employed for decades. In light of recent technology advancements, new sensors have been
- 18 -
implemented powered by cost effectiveness and flexibility (Zhu et al., 2018). Examples of those sensors are magnetometers, infrared sensors and video image processors. Each of these technologies possess different characteristics regarding the principles of operation, accuracy of measures and network coverage (Lopes et al., 2010). Figure 2-2 presents examples of the operation of some of these sensor technologies.
Source: Guerrero-Ibañez, Zeadally and Contreras-Castillo (2018)
Figure 2-2 Example of roadway-based sensors
First introduced in the 1960s, inductive loop detectors are one of the most employed sensors in TMS (Middleton, Gopalakrishna and Raman, 2003; Mathew, 2014). It consists of insulated loop wire that is installed into or under the pavement. When a vehicle drives over the detection zone (area enclosed by the loop), the inductance of the loop decreases. This frequency change is detected by the electronic unit and its interpreted as vehicle detection. However, these technologies suffer from certain disadvantages. For instance, installation and maintenance of these sensors can be problematic as it requires the disruption of the traffic. They are also easily damaged by heavy vehicles, as well as expensive to maintain.
- 19 -
Magnetic sensors, or magnetometers, work on the principle that the presence of a metal object (e.g. vehicle) distorts Earth’s magnetic field. A magnetometer detects changes in the vertical and horizontal component of Earth’s magnetic field. When operated in the pulse output mode, magnetometers can sense the passage of a vehicle yielding count data. Magnetometers on presence output mode, measures vehicle presence by providing a continuous output if a vehicle occupies the detection zone (Dalla Chiara, Deflorio and Pinna, 2010). They are usually installed on bridge decks and in heavily reinforced pavements, where steel affected the performance of inductive loop detectors (Nelson, 2000). For a similar price, magnetic sensors are easier to install and maintain compare to Inductive loop detectors. They can sustain greater stress and break less often. But they are limited to specific applications as they can only provide passage data (Mimbela and Klein, 2007).
Microwave sensors are divided into two categories: Frequency Modulated Continuous Wave (FMCW) and Doppler Microwave detectors. Doppler microwave detectors use the Doppler principle to calculate the vehicle speed from a continuous wave that transmits electromagnetic energy at a constant frequency. However, these types of sensor can only detect moving vehicles, thus they are not capable of detecting vehicle presence. The second type, FMCW detectors, transmit electromagnetic energy in frequency bands between 2.5 to 24GHz. FMCW sensors can provide count, speed, lane occupancy, vehicle length and vehicle presence. Microwave sensors are a cost-effective alternative to Inductive Loop Detectors and Magnetic sensors due to their low cost, small size and low power consumption (Parkany and Xie, 2005).
- 20 -
Infrared sensors detect energy generated by vehicles, road surfaces and other objects into the sensor aperture. They are divided into two categories: Passive Infrared (PIR) and Active Infrared (AIR). PIR sensors transmit no energy on their own, but detect the energy based on emission or reflection of infrared radiation. They are used to collect flow, vehicle presence and occupancy. In the AIR sensors, a detection zone is illuminated with low power infrared energy transmitted by light emitting diodes operating in the infrared region. These sensors collect data on flow, speed, vehicle presence, classification and density (Guerrero-Ibañez, Zeadally and Contreras-Castillo, 2018). The operation of these type of sensors are vulnerable to weather conditions such as fog, rain, snow and precipitation (Mimbela and Klein, 2007).
Video Image Processors (VIP) typically consist of a set of video cameras, a microprocessor compute for processing the images, and an algorithm-based software to interpret the images and convert them into traffic data (Minami et al., 2008). Video cameras placed on the network collect images from successive frames to determine the changes in traffic. VIPs can provide vehicle presence, speed, volume, lane occupancy and classification. They can also track a specific vehicle or a group of vehicles through the field view of the cameras, with the purpose of providing origin-destination information. The main disadvantage of VIP systems is that they are susceptible to inclement weather: fog, rain, snow and precipitation (Antoniou, Balakrishna and Koutsopoulos, 2011)
Table 2-1 summarises the advantages and disadvantages of the aforementioned sensor technologies based on installation, maintenance, and performance in different types of weather (Klein et al., 2006; Leduc, 2008). The general conclusion is that most
- 21 -
of these sensors (microwave, infrared and CCTV) are compact and are not roadway invasive, which makes their installation and maintenance relatively easy. However, these sensors are also more vulnerable to inclement weather conditions such as fog, heavy rain and snow. In addition, they can be easily spotted by drivers, resulting in reductions in speed and changing their driving behaviour (Guerrero-Ibañez, Zeadally and Contreras-Castillo, 2018). On the contrary, more invasive sensors such as loop detectors and magnetometers, are insensitive to changes in the weather conditions with a relatively good overall performance. Due to their technology maturity, several solutions have been implemented to address the known issues of intrusive sensors with regards of traffic disruption during installation and maintenance. One solution has been the introduction of wireless battery-powered sensors nodes that are installed over the pavement (Zhou et al., 2016).
Table 2-1: Advantages and disadvantages of roadway-based sensors
Technology Advantages Disadvantages
Inductive loop detectors
•Low per-unit cost
•Relatively good performance
•Provides basic traffic parameters
•Large experience base
•Insensitive to inclement weather
•Installation requires pavement cut
•Installation and maintenance require pavement cut
•Easily damaged by heavy vehicles and road repairs
•Susceptible to stress of traffic and temperature
•Multiple loops require to monitor a location
Magnetometers
•Less vulnerable than loops to stresses of traffic
•Insensitive to inclement weather
•Installation requires pavement cut
•Installation and maintenance require pavement cut
•Limited application
•Medium cost Microwave
sensors
•Installation and repair do not disrupt traffic
•Multiple lane operation
•Insensitive to weather
•Relatively low precision
•Doppler sensors cannot detect stopped vehicles
- 22 - Infrared sensors
•Installation and repair do not disrupt traffic
•Compact size
•Operations may be affected in fog, heavy rain and snow
•Some models not recommended for presence detection
Video image processors
•No traffic disruption for installation and maintenance
•Monitors multiple lanes
•Provides vehicle tracking
•Live images of traffic
•Live images require expensive equipment
•Susceptible to inclement weather
•Different algorithms for day and night use
2.2.2.2 Probe based sensors
Probe-based refer to sensors mounted within the vehicle and have the capability of sending real-time positioning data through wireless communications. These types of sensors move along the transport network and transmit individual vehicle’s movement, such as position, velocity and timestamps. With the growing number of GPS trackers installed both in vehicles and mobile devices, it is becoming more popular to collect data from these sensors as they can reflect better the traffic conditions. Compared to roadway-based sensors, these sensors can cover a wider area of the transport network with less investment in cost and maintenance. However, existing algorithms need a large volume of traffic data which will require a proportionally large number of users who are willing to offer GPS data in real time (Siripanpornchana, Panichpapiboon and Chaovalit, 2016).
Global positioning systems (GPS) are designed to track the location of a specific vehicle at a particular point in time. GPS is a global navigation positioning system that transmit geolocation and time stamps to a GPS receiver. With GPS information from moving vehicles, it is possible to match the vehicle position, along with the speed and time parameters by using geographic information systems and map matching techniques.
- 23 -
An example these technologies are those identifiable vehicles that share mobility data with roadside services (Lopes et al., 2010), as shown in Figure 2-3. While a wide variety of authors have successfully used GPS data for traffic forecasting and incident detection, there are some challenges involved with matching GPS data to specific roads. In addition, GPS technologies struggle to transmit through most objects or specific locations such as bridges and tunnels.
Source: Rijkswaterstaat (2015)
Figure 2-3 Example of Probe Vehicle data service
Traffic management applications using cellular geolocation technology are currently being researched by a wide variety of authors. Similar to in-vehicle GPS systems, this sensor technology is based on the widespread use of mobile devices equipped with a GPS receiver. Google Maps1 is a good example of using cellular geolocation systems
to analyse the traffic and road conditions. When users enable location services, their phones send anonymous data to the Google servers which analyse the number of cars and their speeds on a road at any given time. The main advantage of this sensor
- 24 -
technology is that as it makes use of an existing infrastructure, it does not require alteration of the base station or any installation. In addition, contrary to in-vehicle systems, cellular positioning systems have been tested to work better in complex environments. However, there is an issue involved with privacy as users would need to give permission for the access of their location, or have their geolocation systems turn on. Popular mapping applications, similar to Google Maps, are limited by low sampling rates making it difficult to understand the traffic situation.
2.2.3
Algorithms
Different algorithms have been employed for traffic management applications such as traffic flow forecasting and incident detection. With the purpose of creating an efficient TMS, it is necessary to provide a continuous flow of information about the way traffic conditions evolve over time. Due to its importance, a wide number of researchers have studied and implemented a significant number of methods for the prediction of traffic flow and automatic identification of accidents. The following sub-sections briefly discuss the algorithm approaches often found in the literature.
2.2.3.1 Time series models
A time series is a set of observations sequentially recorded over a period of time. Time series algorithms use these observations to build a model describing the underlying relationship. This model is then implemented to forecast future time series values. First introduced in the 1976 by Box and Jenkins (1976), Auto-regressive integrated moving average (ARIMA) is one of the most popular time series models employed in the literature. The Autoregressive (AR) component predicts the variable of interest based on a regressed combination of past values, while the Moving Average (MA) component
- 25 -
indicates a linear combination of past forecasts errors. The “integrated” part computes the difference between consecutives raw observations, with the purpose of making the time series stationary. These models employ the Box–Jenkins method finds the most appropriate model (AR and/or MA) based on assessing stationarity, identifying seasonality, and estimating the components of the ARIMA model. The major limitation of ARIMA models is that a linear correlation structure is assumed in the time series values. For this reason, the results of using these types of models for complex problems are not always satisfactory. Throughout the years, the ARIMA model has been the foundation for several variants, such as KARIMA (Van Der Voort, Dougherty and Watson, 1996), VARMA (Kamarianakis and Prastacos, 2003) and STARIMA (Kamarianakis and Prastacos, 2003).
2.2.3.2 Traffic simulation models
Traffic simulation is the mathematical modelling of real-world transport systems used to better understand, plan and design transportation networks. They are powerful tools for analysing very complex transport problems, assessing the impact of infrastructure options, and demonstrating how the system is likely to perform in the future. Based on the level of detail that the simulation seeks to achieve, traffic simulation models can be classified into three categories: microscopic, macroscopic or mesoscopic. Microscopic simulations describe the behaviour of every vehicle and their interaction with other elements in a Multi-Agent System (Ehlert and Rothkrantz, 2001). It allows the user to assign specific characteristics to each vehicle such as type (e.g. truck, car), driving style, route and destination. One of the most common microscopic models is the Cellular automata, where roads are divided into cells which can be empty or
- 26 -
occupied by a vehicle (Maerivoet and De Moor, 2005). Cellular Automata model have proved to be very efficient in capturing the different phenomena that occur in traffic flows (Barlovic et al., 1999; Chowdhury, Santen and Schadschneider, 2000).
Macroscopic simulations, rather than describing the behaviour of specific elements, represent traffic flow at a low level of detail via aggregate traffic variables such as density, speed or traffic count. Contrary to microscopic models, macroscopic approaches are preferred for large scale systems with higher density due to their fast-computational demand.
Mesoscopic simulations are a combination of microscopic and macroscopic models. Mesoscopic models fill the gap between the individual behaviour of microscopic models and the aggregate level approach of macroscopic ones (Burghout, Koutsopoulos and Andreasson, 2005). The main application of these models is when the detail of a microscopic simulation is needed, but it is not feasible due to the large size of the network.
2.2.3.3 Artificial Intelligence Algorithms
Artificial intelligence refers to a set of techniques that emulate the human reasoning process in complex real-world problems. The most popular artificial intelligent techniques employed for traffic management systems include Neural Networks, Fuzzy Logic, K-nearest Neighbour and Support Vector Regression. With the purpose of improving the efficiency of these methods, several hybrid techniques have emerged from the fusion of these algorithms with other models.
First introduced in the 1950s by Rosenblatt (1958), Neural Networks are computing systems inspired by the biological neurons of the human brain. Neural network is not
- 27 -
an algorithm, but a set of many different machine learning techniques that are able to process complex data input into a desired output. They are composed of many interconnected units called ‘neurons’ that mimic the operation of a human brain. Each of these neurons have many input signals, but only one output that is generally sent as an input to other neurons, until they produce the final output (Hecht-Nielsen, 1988). One of the main characteristics of these systems is that they learn from processing many examples, without the need to be reprogrammed. However, these algorithms need substantial training due to their complex internal structure. The most common used neural network algorithm for traffic related purposes are the Feed Forward Neural Networks (FFNN) and Probabilistic Neural Networks (PNN).
The term Fuzzy Logic was introduced by Zadeh (1965), it consists of a problem-solving system that intends to model logical reasoning, in which true values are fuzzy subsets of the unit interval. Fuzzy subsets assign a degree of truth, these values range from 0 (totally false) to 1 (totally true). It provides a mechanism that captures and represents real-world uncertainty with its fuzzy data (Zadeh, 1996). Their main advantage is their ability to make decisions based on incomplete data, which can aid traffic management systems with missing sensor data.
K-nearest neighbour (KNN) is a simple regression algorithm introduced 1967 by Cover and Hart (1967). The fundamental assumption of KNN is that future states to be predicted are similar to a neighbourhood of the past. Once the neighbourhood has been recognised, the past cases are used to forecast the values of the dependant variable (Smith, Williams and Keith Oswald, 2002). Similar to other AI approaches, KNN’s computational efficiency depends on the vastness of its training data. The
- 28 -
biggest disadvantage of this approach is the selection of the database of potential neighbours. Selecting a large database, while desirable, it can have significant implications on the computing time.
Support Vector Machine (SVM) was originally developed by Cortes and Vapnik (1995), to solve pattern recognition and classification problems. Support Vector Regression (SVR) is an extension of SVM that can handle non-linear regression estimation problems. In essence, the input data is mapped into a hyperplane in a high-dimensional space, where a linear function that formulates a non-linear relationship between the input and output data (Hong, 2011). While this method has proven to be very effective for complicated network traffic problems, poor forecasting accuracy has been experienced from lack of knowledge on the selection of the different tuning parameters.
2.3
Survey of Traffic Management Systems
This section reviews the different traffic management systems applications. For the purpose of providing a consistent review, existing applications have been classified into three categories: incident detection, traffic forecasting and traffic flow modelling systems.
2.3.1
Incident Detection Systems
The increasing number of vehicles causing traffic congestions, bottlenecks, and incidents, has prompted a growing interest in developing efficient Intelligent Transportation Systems (ITS). The purpose of ITS is to take advantage of advanced communication, information and electronics technology to solve transportation problems such as traffic congestion, safety and transport efficiency (Figueiredo et al.,
- 29 -
2001). One of the main challenges of ITS is to distinguish an incident from a traffic congestion (D'Andrea and Marcelloni, 2017). A traffic incident is an unexpected event that temporarily disrupts the normal traffic flow, such as broken-down vehicles, accidents, roadworks, severe weather or other unusual events. Traffic incidents are one of the major causes of traffic congestion. In fact, it has been indicated that for every minute a traffic incident remains uncleared, it takes around four minutes for traffic to go back to normal conditions (Saka, 2000). It is, therefore, not surprising that Automatic Incident Detection (AID) constitutes an important part of ITS that has attracted the interest of many researchers in the last decades. Effective and efficient AID systems can accelerate the response and intervention of traffic management agencies, and reduce the possible loss caused by incidents in terms of life, money and time (Wang et al., 2013).
Algorithms techniques mentioned in the previous sections, have been successfully employed for automatic incident detection systems. ANN has been one of the most popular and efficient techniques in the literature. The application of ANN for incident detection was first introduced by Ritchie and Cheu (1993), where they proposed ANN for the automatic detection of lane blocking incidents on a freeway. But then, Wen et al. (2001) developed a Probabilistic Neural Network (PNN), where they considered incident detection as a pattern recognition problem. They evaluated the performance of their PNN by simulating a wide range of incidents with a variety of flow conditions and traffic periods. The main limitation of PNN is that due to the large neural network size, a large memory and computational time is required. Jin, Xin, Cheu and Srinivasan (2002) built a Constructive Probabilistic Neural Network (CPNN) that provided solutions
- 30 -
to the memory control and adaptation issues mentioned before. Results from this study showed that CPNN had better overall performance than conventional PNN techniques. Recently, there has been a growing interest in fusing data from roadway-based sensors and probe vehicles. Yu et al. (2008) proposed a fusion of loop detector and probe vehicle data for traffic incident detection using a Back Propagation (BP) neural network. In their model, a Cumulative Sum (CUSUM) approach was used to detect incidents based on loop detector and probe vehicle data. The BP neural network combines the output from the two sources and determines if there is an accident by comparing the fusion output with the defined threshold. Dia and Thomas (2011) tested various neural network data fusion methodologies based on simulated loop detector and probe vehicle data for incident detection on arterial roads, resulting in a 90% incident detection rate and 0.5% false alarm rate. In the last few years, several authors have developed ANN models based on different methodologies and data sources (Ki et al., 2018; Zhu et al., 2018; Chakraborty et al., 2018). The main drawback of ANN models is their complex internal structure and that they require a large set of historical data. Fuzzy logic is another technique that has gained popularity in the field of AID (Lee, Sibok, Krammes and Yen, 1998; Ahmed and Hawas, 2013; Rossi et al., 2015; Nikolaev et al., 2016). For instance, Rossi et al. (2015) presented a fuzzy logic approach using fuzzy linguistics to describe the variation of traffic parameters. They used the traffic simulation tool PARAMICS to evaluate the performance of the system in terms of detection rate, false alarm rate and mean time to detection. Their implementation showed excellent results for high flow rate values (more than 3000 veh/h), and a performance decrease in instances with low flow rate. The most notable disadvantage
- 31 -
of fuzzy logic approaches is that it requires extensive calibration due to the number of parameters that need to be defined.
Some of the studies mentioned before, whilst they have obtained low false alarm rates, have only been tested using traffic simulation tools. On the other hand, other literature suggest that they do not meet the operational need of traffic management centres as they demand a much lower false alarm rate to minimise operator overload (Dia and Thomas, 2011). In fact, results from a survey in the US showed that more than 53% of TMS operators are not satisfied with their current AID system due to malfunctions, high false alarm rates, inconvenient installation/maintenance, and difficult calibration and implementation (Parkany and Xie, 2005). Furthermore, in Williams and Guin (2007), more than 70% of the operators considered as insufficient the current methods employed for automatic incident detection.
2.3.2
Traffic forecasting systems
Traffic flow forecasting constitutes a critical aspect of Intelligent Transport Systems (ITS). In order to create an efficient ITS, it is necessary to provide a continuous flow of information about the way traffic conditions, such as traffic flow, occupancy and speed, evolve over time (Lieu, 2000). Vlahogianni, Golias and Karlaftis (2004) defined short-term traffic forecasting as “the process of estimating directly the anticipated traffic conditions at a future time, given continuous short-term feedback of traffic condition”. Due to its importance, a wide number of researchers have studied and implemented a significant number of methods for the prediction of traffic flow. Most of the existing traffic forecasting methodologies are statistically base methods. Ahmed and Cook (1979), Levin and Tsao (1980) and Nihan and Holmesland (1980) were