Received November 23, 2019, accepted December 13, 2019, date of publication December 26, 2019, date of current version January 27, 2020.
Digital Object Identifier 10.1109/ACCESS.2019.2962510
Performance Analysis of Different Types of
Machine Learning Classifiers for
Non-Technical Loss Detection
KHAWAJA MOYEEZULLAH GHORI 1,2, RABEEH AYAZ ABBASI 3, MUHAMMAD AWAIS 4, (Member, IEEE),
MUHAMMAD IMRAN 5, ATA ULLAH 2, AND LASZLO SZATHMARY 6
1Doctoral School of Informatics, University of Debrecen, 4002 Debrecen, Hungary
2Department of Computer Science, National University of Modern Languages (NUML), Islamabad 44000, Pakistan 3Department of Computer Science, Quaid-i-Azam University, Islamabad 44000, Pakistan
4Faculty of Medicine and Health, School of Psychology, University of Leeds, Leeds LS2 9JT, U.K. 5College of Applied Computer Science, King Saud University, Riyadh 11451, Saudi Arabia 6Faculty of Informatics, Department of IT, University of Debrecen, 4002 Debrecen, Hungary Corresponding author: Khawaja Moyeezullah Ghori ([email protected])
This work was supported in part by the construction under Grant EFOP-3.6.3-VEKOP-16-2017-00002, in part by the European Union, and in part by the by the European Social Fund.
ABSTRACT With the ever-growing demand of electric power, it is quite challenging to detect and prevent Non-Technical Loss (NTL) in power industries. NTL is committed by meter bypassing, hooking from the main lines, reversing and tampering the meters. Manual on-site checking and reporting of NTL remains an unattractive strategy due to the required manpower and associated cost. The use of machine learning classifiers has been an attractive option for NTL detection. It enhances data-oriented analysis and high hit ratio along with less cost and manpower requirements. However, there is still a need to explore the results across multiple types of classifiers on a real-world dataset. This paper considers a real dataset from a power supply company in Pakistan to identify NTL. We have evaluated 15 existing machine learning classifiers across 9 types which also include the recently developed CatBoost, LGBoost and XGBoost classifiers. Our work is validated using extensive simulations. Results elucidate that ensemble methods and Artificial Neural Network (ANN) outperform the other types of classifiers for NTL detection in our real dataset. Moreover, we have also derived a procedure to identify the top-14 features out of a total of 71 features, which are contributing 77% in predicting NTL. We conclude that including more features beyond this threshold does not improve performance and thus limiting to the selected feature set reduces the computation time required by the classifiers. Last but not least, the paper also analyzes the results of the classifiers with respect to their types, which has opened a new area of research in NTL detection.
INDEX TERMS Data mining, machine learning, classification algorithms, supervised learning, boosting. I. INTRODUCTION
Non-Technical Loss (NTL) is the loss incurred due to the unlawful theft attempts by the malicious consumers of elec-tricity. With the ever-growing demand of electricity, NTL identification is becoming mandatory to protect illegal theft of electricity which can save billions of dollars [1]. In the US, the total annual loss is 6 billion dollars while for India, it is 4.5 billion dollars [2]. Similarly, Brazil suffers 4.5 billion dollars annually due to NTL [3]. Pakistan’s economy is also suffering from 0.89 billion dollars annually on account of
The associate editor coordinating the review of this manuscript and approving it for publication was Francesco Piccialli.
NTL [4], which is mostly caused due to bypassing electric meter, which results in zero meter reading for the consumer. Other methods include direct hooking from the main lines, reversing the meter units after opening electric meter, using magnetic device to slow down the normal rotation of units disc, changing the direction of meter to stop the rotation of units disc and tapping the neutral wire in the meter to stop the normal rotation of units disc [4]. In almost all cases, the meter reader is also involved in malfunctioning the meter, which results in near-zero reporting of NTL. This becomes a dilemma for the power supply company as it becomes hard to identify individual households where NTL is hap-pening. One way of reporting NTL is on-site inspection in This work is licensed under a Creative Commons Attribution 4.0 License. For more information, see http://creativecommons.org/licenses/by/4.0/
selected households. This, of course, is limited to inspect-ing few households due to manpower required for inspec-tion. Another approach is using an observer meter for a community that monitors the difference between billed electricity and consumed electricity. This approach is lim-ited to identifying the area where NTL is occurring and fails to pinpoint the culprits. In general, as compared to committed electricity thefts, the number of reported thefts is very small, which results in burdening the power supplier.
NTL detection involves training different machine learning classifiers with existing data that contains observations from both positive and negative classes. After training, the clas-sifiers are then tested on a different set of test data. The test results are then evaluated using performance evaluation metrics. The use of machine learning classifiers for NTL detection has been an ongoing and interesting activity in the research community that has now span for over two decades. There are many types of the classifiers that have been tested for NTL detection. These include decision trees, ensemble methods, generalized linear models, linear and quadratic dis-criminant analysis, Naive Bayes, nearest neighbors, neural network models, stochastic gradient descent and support vec-tor machines.
Machine learning classifiers are by far the most flexible way of NTL detection for many reasons [5]. Unlike manual on-site inspection, machine learning requires some techni-cally skilled professionals who can work on real datasets to identify the occurrence of theft. The shortlisted theft cases can then be verified by manual inspection. Adding new theft cases to the learning models makes the models learn new cases. In this way, the performance of the classifiers keeps improving. These machine learning methods are also useful to identify real culprits unlike other network based techniques which are only able to identify an area where NTL is commit-ted but fail to pinpoint the theft cases. Furthermore, a much less cost is incurred in using machine learning methods as compared to other procedures like manual on-site inspection. Automation of the NTL detection procedure is another added advantage of using machine learning. This advantage can not be gained while using other NTL detection schemes like manual on-site inspection.
The main problem is that a detailed comparative study of the machine learning classifiers on some real dataset is still missing which can particularly highlight the best per-forming machine learning classifiers and the best types of classifiers for NTL detection. This paper contributes in not only identifying NTL in a real dataset taken from a power supply company in Pakistan but it also highlights the best per-forming individual classifiers and the best perper-forming types of the classifiers for NTL detection. NTL in power sector is given less importance in Pakistan and less effort is done for its detection. That is why an on-site inspection is the only measure deployed for the detection of NTL. This paper has initially taken approximately 80,000 consumption records with positive and negative classes along with 71 features for
a possible detection of NTL. In this paper, our objectives are as follows:
1) Present a taxonomy of the NTL detection techniques and categorize the strategies of NTL detection with respect to data, network, a combination of both and additional data. Moreover, identify and focus on a num-ber of solutions based on unsupervised, supervised, semi-supervised and hybrid learning.
2) For NTL detection, use a real dataset taken from a power supply company in Pakistan. The contributions which use synthesized data for NTL detection generally contain equal distribution of classes that do not depict the natural class distribution. As our dataset is real, the ratio between positive and negative classes is imbal-anced which represents the natural behavior. Investi-gate the performance of different types of machine learning classifiers and identify the type that performs best in NTL detection. Apart from the comparison of different types of the classifiers, perform extensive simulations and find the best individual classifier for NTL detection in terms of F-measure and Recall. It will open a potentially new area where NTL detection can be worked on. Moreover, identify a threshold of the number of participant features beyond which adding more features does not affect the efficiency of the clas-sifiers.
The rest of the paper is as follows: SectionIIexplains the state of the art techniques used in NTL detection. SectionIII explains the methods we have used for NTL detection, the data collection and feature selection process. SectionIV explains the metric used for performance evaluation and dis-cusses the results obtained. SectionVpresents conclusions and future work.
II. STATE-OF-THE-ART IN NTL
The use of machine learning classifiers in a variety of differ-ent domains of science and business is becoming as fruitful as ever before. The applications involve the analytical computa-tions for big data like concentric computing model [6], event detection for preventive medication [7], text classification [8] and data centric analysis [9]. Moreover, real-time anomaly detection is also beneficial by using clustering mechanism for big data repositories [10], [11]. One of the applications of classification is fraud detection. In power industry, fraud occurs with the use of unlawful connections of electricity, which is the primary cause of NTL. Identifying the NTL in power industry is as important as any other classification task as it not only identifies potential fraudsters but it also helps in saving billions of dollars for a company. During the last few years, the research community has paid attention to the problem of NTL detection. To encounter this problem, super-vised, unsupervised and semi-supervised learning methods have been used. Some of the authors have used customer’s consumption history while others have used the grid and network data. Effort has also been made to use both types of data, i.e. consumer’s consumption profile as well as the
FIGURE 1. Strategies of NTL detection.
grid data which may contain current and voltage information supplied to different areas. At times, some additional data are also merged to the consumption data to see the effect of hit ratio of NTL detection. This additional data may comprise of environmental and temperature readings. A complete cate-gorical division of the types of strategies and algorithms used in NTL is shown in Figure1.
A survey on NTL can be found in [12]. The authors of this paper have categorized the techniques used in NTL into data oriented, network oriented and hybrid techniques. They have categorized the consumption data into multiple categories like time series data, raw data and geographical data. The authors have also discussed the classification and clustering techniques used for NTL and the performance evaluation metrics used to evaluate them.
A. DATA-BASED TECHNIQUES
Two different types of data profiles are used for NTL detec-tion. Consumption profile contains hourly, daily or monthly consumption records of consumers which is used to detect a potential NTL. Additional data profile is also merged with consumption profile in an effort to increase accuracy in pre-dicting NTL. The additional data profile may contain envi-ronmental and temperature features.
1) CONSUMPTION PROFILE
To address the problem of NTL, the research community has used unsupervised, supervised, semi-supervised and even a combination of supervised and unsupervised learning meth-ods. Research contributions of some of them are discussed below.
a: UNSUPERVISED LEARNING
The authors of [13] have used consumption data collected from Endesa Distribucion, a power supply company in Spain.
They have used association rule mining to cluster a group of customers responsible for electricity theft. The use of association rule mining has enabled them to perform an on-site inspection of a filtered few hundred consumers out of thousands of consumers. They have used support, confi-dence, TP, TN, FP and FN metrics to evaluate their result. They have claimed a 7% to 20% increase in detecting NTL. In [14], the authors have also used association rule mining by proposing an algorithm of their own which generates frequent patterns of the use of appliances. They have claimed to find associations between appliances of home and time series. Their work can further lead to NTL detection by filtering out those instances which disobey frequent pattern of a specific household area. They have stated that their results outper-formed SVM and Multi-layer perceptron (MLP).
Benford curve, hierarchical clustering and Multi-dimensional scaling (MDS) are used in [15] to study the characteristics of consumption for a better detection of NTL in two companies. One of their findings is that in company 1, fraudsters have a different curve as compared to normal consumers with respect to Benford curve. No such indication is observed in company 2. This behavior is also indicated by the fact that using decision trees, company 1 has a good classification for fraudsters as compared to company 2.
Sharmaet al.[16] have used the concept of local outlier factor (LOF) in density-based spatial clustering of applica-tions with noise (DBSCAN) clustering algorithm to identify unusual load patterns in two datasets from USA and India. LOF is the ratio of density of a data point to the density of its k-nearest neighbors. A higher value of LOF shows that there is a noticeable difference between the densities of the point and its neighbors reflecting the point to be suspicious. They have used Silhouette coefficient and Davies Bouldin index to evaluate their technique but did not compare them
with other clustering algorithms. A similar approach is used in [17]. The authors have proposed a distance matrix to observe the unusual profiles of consumers. They have used Area Under ROC Curve (AUC), accuracy and F1 measures to evaluate their proposed model and compared it with GMM, k-means and DBSCAN. Their results show that their tech-nique outperformed the already known techtech-niques. In [18], the authors have also proposed a density based clustering algorithm called DBMSCAN. It identifies low and peak loads which in turn help in detection of irregular consumption. The algorithm encounters anomalies by introducing irregularity variance. The authors have used silhouette coefficient for the comparison of DBMSCAN with the traditional DBSCAN and stated that their algorithm has outperformed DBSCAN.
Another unsupervised method, Optimum-path forest (OPF), is used in [19] to detect NTL in a Brazilian electricity data. The authors have also used semi-supervised learning method of anomaly detection that has the information of only one class. They have compared the accuracy of both tech-niques with SVM, Gaussian mixture model (GMM) and k-means and stated that OPF and anomaly detection techniques (semi-supervised learning) outperformed others. Yeckle and Tang [20] have used seven different outlier detection tech-niques to identify the occurrence of NTL in an Irish dataset. They have also performed k-means clustering algorithm in the pre-processing step to cutoff the number of transactions per day to three. They have tested the performance of the outlier detection techniques using AUC and claimed that reducing the number of meter readings by using k-means clustering has helped improving the performance of AUC.
b: SUPERVISED LEARNING
Similar attention is made in dealing NTL detection through supervised learning techniques. For example, Zheng et al. [21] have experimented wide and deep con-volutional neural network (CNN) in a dataset collected from a Chinese electricity company. Wide framework of the neural networks handles the 1-D consumption records of each consumer, while the deep framework maintains weekly consumption. They have used AUC as the evaluation metric to compare their work with existing classifiers like SVM, logistic regression, random forest, and three sigma rule (TSR). They observed that their model outperforms these classifiers.
Fuzzy logic is used in [22] to detect potential electricity theft consumption. The authors have used consumption data from 2003 to 2017 in a series of five decades incrementing a year every time starting from 2003. Fuzzy suspicions are created based on the relationship of consumption between time-series data. Fuzzy logic is then used to calculate suspi-cion value for each consumer. If it passes a certain threshold, the consumer is considered a suspicious consumer. This work has shown a 14% of success percentage in finding the theft cases but it claims that the percentage of success will be increased after on-site inspection. A similar type of work is presented in [23] where authors have used fuzzy-based
distance to check whether a consumer’s distance has sig-nificantly crossed a consumption prototype. They have used consumption records of four thousand Irish households. The authors have claimed a true positive rate of 63.6% and a false positive rate of 24.3%.
Recently developed ensemble methods namely CatBoost, LGBoost and XGBoost are tested in [24]. The authors have used an Irish dataset that contains half-hourly meter readings for 420 days. They have generated six theft cases in the dataset to balance out the minority class. They have con-cluded that LGBoost and CatBoost outperformed XGBoost with respect to detection ratio, while LGBoost performed better than CatBoost and XGBoost with respect to False Positive Rate (FPR). However, they have not compared the three classifiers with other known classifiers. Moreover, their dataset is synthesized with equal positive and negative class representations. This, of course, does not reflect the real-world scenario where the observations of the positive class are very small as compared to the observations of the negative class. There is a need that these classifiers should also be tested on a real world dataset.
c: HYBRID OF SUPERVISED AND UNSUPERVISED LEARNING
Some of the authors have applied supervised and unsuper-vised learnings as a sequence of operations to deal with NTL. For example, in [25], the authors have taken a dataset of a Spanish electricity supply company and performed two mod-ules. In the first module, they have used artificial neural net-works to filter the consumers in a pre-processing step. In the next module, they have tested classification and regression tree (supervised learning) along with Self Organizing Maps (SOM), which is a technique used in unsupervised learning. The authors have claimed a three times rise of accuracy as compared with manual inspection. Similarly, authors of [26] have performed a mixture of unsupervised and supervised learning techniques in a dataset collected from a Chinese electric company. In the first step, they have performed k-means clustering algorithm to form different clusters of con-sumers based on their consumption patterns. In the second step, they have performed a reclassification step by applying decision tree, random forest, SVM and KNN to the filtered consumers obtained from the first step. The paper concludes that the classification step overcomes the weaknesses that appeared in the clustering step. Another approach is used in [27], which combines fuzzy clustering and fuzzy classi-fication. This work first forms clusters of consumers having similar consumption patterns using fuzzy clustering. Then, using membership matrices, a fuzzy classification further classifies the consumers. Moreover, an expected consumption profile is calculated for each consumer and if the difference between the expected and real consumption profile passes a specific threshold, the consumer is shortlisted as a potential fraudster. However, the paper did not compare its findings with other techniques.
2) ADDITIONAL DATA PROFILE
Some authors have also tested merging consumption data with some additional data like data related to environment and temperature. For example, in [28], the authors have merged weather data with the consumption data obtained from an electric distribution company in Luxembourg. They have cre-ated multiple consumption profiles for each customer based on time, e.g, monthly, weekly and daily profiles and used them in live machine learning for consumer classification. They have claimed that the additional data coupled with live machine learning and maintaining multiple consumer profiles has helped reduce false positive rate (FPR).
B. NETWORK-BASED TECHNIQUES
Some interest has been developed in using network data to identify potential NTL. For example, Chauhan [29] have proposed a framework to monitor current between poles. Given a constant voltage, the current between the poles will remain almost the same. If there is a large difference between the current readings of two poles, then it indicates that there is a possible unlawful connection between the poles. To some extent, this method can identify unlawful meter bypassing but it can not detect NTL which is caused by slowing down meters or wrong meter readings. The authors have not used any performance evaluation metric. A similar strategy is pro-posed in [30]. The paper has propro-posed to install an observer meter for a community. Using this meter, the difference between the electricity billed and actual electricity consumed can be calculated. However, this solution can filter a locality where NTL is occurring but it fails to identify the specific consumers responsible for NTL. In [31], the authors have proposed to remotely detect NTL by monitoring the differ-ence between the electricity distributed and the electricity consumed. The electricity consumed at the consumer end is monitored by radio transceivers and communicated back to the distribution pole using Wi-Fi space. If the difference between the distributed and used electricity passes a cer-tain threshold, a potential NTL is identified. However, this framework fails to identify NTL caused by meter bypassing. Moreover, a heavy cost is also associated with the installation of radio transceivers at every consumer’s meter.
C. HYBRID TECHNIQUES
Efforts have been made to combine the consumption data and network data in a bid to better achieve NTL detection results. Meiraet al.[2] have categorized the consumption and net-work features in four categories based on their similarity, time period, neighborhood and transformer data. They have tested three classifiers on these different sets of features. The perfor-mance evaluation metric used is AUC. The paper concludes that predicting NTL using the raw data from consumption profile is better than using a combination of consumption and network data. In [32], the authors have used a combination of regression model and SVM. The regression model is used to analyze the state of the meters and the grid. A large
deviation of a specific meter in the regression indicates a possibility of NTL. The consumption data is used to train the SVM classifier for a prediction of NTL. The authors have used true positive rate (TPR) and true negative rate (TNR) as the performance evaluation metrics and concluded that consumption data requires less configuration which makes it relatively easier to implement.
D. MODELS
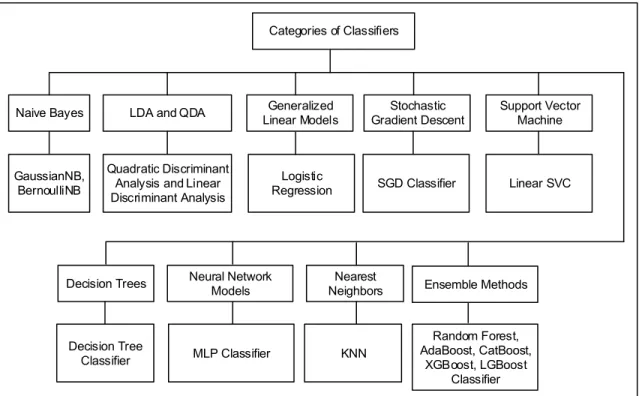
A variety of different machine learning algorithms are tested for NTL detection which also include recently devel-oped ensemble methods namely CatBoost, LGBoost and XGBoost. We investigated the types of classifiers mentioned in Figure2to find the best classifiers for NTL detection. The figure represents the classifiers and their types that are used in our experiments.
1) NAIVE BAYES CLASSIFIERS
All classifiers belonging to this type use Bayes’ algorithm along with a ‘Naive’ assumption regarding the class con-ditional independence. The definition of Bayes’ theorem as described in [33] is as follows:
P(C=i|X =x)=P(X =x|C=i)P(C =i)
P(X =x) (1) whereP(C=i|X =x) is the class posterior probability given the feature vectorX. Notice thatP(X =x) is the same for all classes and thus can be ignored. Thus, Equation1is reduced to the following equation:
P(C =i|X =x)=P(X =x|C=i)P(C =i) (2) When the number of features are too many, computingP(X =
x|C =i) becomes exponentially expensive. For this reason, assumption of the class conditional independence is made. This assumption states that the features are independent of each other which means that the values of one feature is not dependent on the values of any other feature. This assumption simplifies the Equation2to the following equation:
P(C=i|X=x)=
n
Y
j=1
P(Xj=xj|C =i)P(C=i) (3)
Despite the assumption being over-simplified, Naive Bayes (NB) still performs better on many real datasets. Different classifiers use NB approach while the difference between them is the assumptions they use for finding the posterior probabilityP(Xj = xj|C = i), where xj is the jth feature andC=iis theithclass label. We have used Gaussian Naive Bayes [34] and Bernoulli Naive Bayes [35] classifiers in our simulation.
2) LDA AND QDA
Linear Discriminant Analysis (LDA) [36] and Quadratic Dis-criminant Analysis (QDA) [37] belong to a separate type of supervised machine learning classifiers. As their names suggest, LDA generates linear decision boundaries and QDA
FIGURE 2. Hierarchy of classifiers.
generates quadratic decision boundaries. These classifiers are used in practice due to their advantage of multi-class support, computationally less expensive with no requirement of hyper-parameter tuning.
The difference between the two classifiers is that LDA uses the same co-variance matrix for all classes while QDA computes separate co-variance matrix for each class. Thus, at one hand, QDA is computationally expensive as compared to LDA but on the other hand it is more flexible and infor-mative with respect to decision boundaries. In general, LDA works better with a small training set and thus has a low variance while QDA performs better with a large training set and thus has a high variance.
3) GENERALIZED LINEAR MODELS
For Generalized Linear Models, we have chosen logistic regression to simulate on our data. Unlike its name, logistic regression is used for classification instead of regression. The mathematical notation for logistic regression model [38] is given in Equation4.
ˆ
y(w,x)=w0+w1x1+ · · · +wnxn (4) whereyˆ is the predicted value, x = (x1,x2, . . . ,xn) is the feature vector,w=(w1,w2, . . . ,wn) is the coefficient vector andw0is the intercept.
For a binary classification, the value ofyˆmust be between 0 and 1. For this, a conversion function sigmoid is used. The mathematical notation of sigmoid is given in Equation5.
s=σ(w0+w1x1+ · · · +wnxn)=σ(z)= 1
1+e−z (5)
wheresis the sigmoid function. For a large positive value of z,s =1 and for a small or large negative value ofz,s= 0 and forz=0,s=0.5.
4) STOCHASTIC GRADIENT DESCENT
Stochastic Gradient Descent (SGD) [39] is a type of lin-ear models that has a support of classification as well as regression. SGD is particularly attractive for problems having large number of observations and large number of features. Despite dealing with large data and high dimensionality, SDC is efficient and offers many options for tuning parameters like number of iterations and regularization parameters. However, one of the prerequisites of using SGD is that the data must be normalized before use which means it is sensitive to scaling. We have used SGD classifier in our simulation, which offers a lot of options for loss functions and their penalties. A training sample looks like (x1,y1),(x2,y2), . . . ,(xn,yn), where xi ∈ Rmandyi∈ {−1,1}. Let us take a linear function which we want to learn
f(x)=wTx+b (6) wherew∈Rmandb∈Ris the intercept. The training error, as described in [40], is evaluated using Equation7:
E(w,b)=1 n n X i=1 L(yi,f(xi))+αR(w) (7) where L is the loss function that estimates the difference between the expected and the actual output,Ris a regulariza-tion step used to penalize on occurrence of error andα >0 is a hyper-parameter. Two most commonly used regularization
choices areL1 andL2 regularizations given in Equations 8 and9: L1Regularization= n X i=1 |wi| (8) L2Regularization= 1 2 n X i=1 w2i (9)
5) SUPPORT VECTOR MACHINE
Vapinik has proposed Support Vector Machine (SVM) clas-sifier [41] that creates a margin between the two classes and tries to maximize this margin. This type of classifier is a set of machine learning methods which offers support for outlier detection, regression and classification. SVMs are widely used in the field of data mining [42], [43] due to their high pre-dicting power and reliability in supervised machine learning problems. For classification problem, we have used Linear SVC classifier in our simulation. The main strengths of SVM are its effectiveness on high dimensional data and on datasets where the number of features is greater than the number of observations, less memory consumption due to the use of support vector (which is a subset of training observations and not the whole training set) and the use of a variety of kernel functions, which are used in the decision function. However, for a dataset where the difference between the number of features and number of observations is too big, SVM tends to overfit the model.
6) DECISION TREES
Decision Trees (DT) are a set of machine learning methods used in classification and regression. The data provided to the decision tree is used to infer if-then-else rules. These rules become complex with the increase in depth of the tree. The strength of decision trees include its simple interpretation of the rules, no requirement of data normalization, compu-tationally less expensive and handling of numerical as well as categorical data. However, its weaknesses include creation of over-complex tree in some cases resulting in overfitting, instability of the tree when new data is added and the problem of NP-completeness for an optimal decision tree.
7) NEURAL NETWORK MODEL
The Neural Network (NN) model offers Multi-layer Percep-tron (MLP) classifier which is vastly used for classification. The objective of MLP classifier is to learn a functionf(.) :
Rm →Rnwith a feature setX =x1,x2,· · ·xmand an output ywheremis the number of features andnis the number of values for the outputy. The difference between MLP classi-fier and logistic regression is that MLP classiclassi-fier can have one or more hidden layers between input and output layers. The input layer transforms the input to the hidden layers where a linear summation likew1x1+w2x2+ · · · +wmxnoccurs. The output layer takes the input from the hidden layer and converts it to the output values using the sigmoid function. The main advantage of using MLP classifier is its compatibility with
non-linear models. However, it requires a number of hyper-parameters to be tuned [44].
8) NEAREST NEIGHBORS
A set of supervised and unsupervised machine learning meth-ods use nearest neighbors, which is based on calculating dis-tances from the neighbors [45]. This technique is widely used in solving many real-world problems like physical activity classification [46]. In nearest neighbors, both classification and regression are supported. The key idea of nearest neigh-bors is to find a predefined (k) number of training observa-tions which are closest to the new observation and then find the value of the output variableyfor this new observation based on the nearest neighbors. There are many metrics used to find the distance between neighbors. The most commonly used metric is standard Euclidean method.
9) ENSEMBLE METHODS
Ensemble methods combine the predicted results of multi-ple base estimators. This way the results are improved as compared to some individual estimator. There are two main streams of ensemble methods. The first stream includes tech-niques which take into account results from many individual estimators and combine their results using average. This way the combined results of individual estimators turn out to be better as compared to the results of individual estimators. Examples of this stream are bagging and random forests. The second stream includes techniques which combine many weak estimators in order to get a powerful result of an ensemble. This in turn also reduces the bias. Examples of this stream are AdaBoost, CatBoost, LightGBM and XGBoost. We have experimented random forest, AdaBoost, CatBoost, LightGBM and XGBoost in our simulation.
Random forest [47] is a combination of randomized deci-sion trees. These decideci-sion trees are built with separate training observations and their results are then combined using aver-age. AdaBoost [48] is a technique to repeatedly apply new data to weak estimators. This includes increasing weights for the training observations that had wrong predictions and decreasing weights for the training observations that had cor-rect predictions. This way, with every new iteration, the esti-mator is restricted to concentrate on those training observa-tions that had wrong predicobserva-tions in the previous iteration.
Derived from the terms ’Category’ and ’Boosting’, Cat-Boost [49] is a recently developed open-source machine learning algorithm. The term ’Category’ refers to the fact that it handles categorical features on its own. Other machine learning techniques require pre-processing steps to convert categorical data into numbers but CatBoost requires only the indices of categorical features. It then automatically per-forms one-hot encoding to transform the categorical data into numerical data [50]. The term ’Boost’ refers to the fact that it is based on gradient boosting algorithm which itself is widely used in different machine learning problems like rec-ommendation systems, fraud detection and forecasting, etc. Moreover, unlike deep learning, CatBoost does not require
TABLE 1. Observations after applying random permutation.
TABLE 2. Observations after transforming categorical data into numerical values.
huge datasets for extensive training. Despite having a number of hyper-parameters like regularization, learning rate, number of trees, tree depth etc., CatBoost does not require exhaustive hyper-parameter tuning which reduces the likelihood of over-fitting.
CatBoost uses three steps to transform categorical features having number of categories greater than a specified number into numerical features.
1) The set of input observations are randomly permuted multiple number of times.
2) The label values are transformed from categorical or floating point to integer values.
3) The categorical features are transformed to numerical features using the formula given in Equation10:
Average_target =InClassCounter+Prior
TotalCounter+1 (10) where InClassCounter represents the number of times the class label is 1 for all those records having the current feature value. Prior is the starting value for the numerator and is defined during initialization of parameters. TotalCounteris the total number of records (upto the previous record) having the same categorical value as that of the current categorical value.
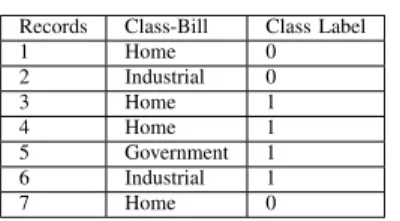
Suppose Class-Billis a feature that contains categorical values representing the category of the consumer. The feature can contain three categories namely home, industrial or gov-ernment. Table1shows the observations after applying ran-dom permutation. Table2shows the transformed categorical values ofClass-Billinto numerical values using Equation10. In this case, we have setPriorto 0.05.
Light Gradient Boosting Machine (LGBoost) is another gradient-based boosting algorithm which uses decision trees [51]. Like CatBoost, it is used in many machine learn-ing problems involvlearn-ing classification and prediction. Instead of level-by-level tree growth, LightGBM uses depth-first approach in splitting the tree which may cause an increase in complexity and overfitting. To avoid this disadvantage, maximum depth of the tree can also be set. The training
time of LightGBM is significantly improved as it converts continuous feature values into discrete bins using a histogram approach. However, it is not advisable to use LightGBM for smaller datasets as it tends to overfit them.
Extreme Gradient Boost (XGBoost) [52] is another boosting-based machine learning algorithm. Unlike Cat-Boost, it does not transform categorical data into numbers by its own. Consequently, before applying XGBoost, a pre-processing step must include encoding techniques like one-hot encoding, mean encoding or label encoding to convert categorical features into numerical features. It also has a built-in feature of handlbuilt-ing missbuilt-ing values. A specific parameter is reserved to supply a different value than the usual values which is used by the algorithm when it encounters a missing value.
III. METHODOLOGY
The literature in NTL detection does not properly contribute in identifying the types of classifiers which are best suitable for NTL detection. Moreover, a feature selection strategy is also needed which can identify the best combination of features for NTL detection in a real dataset. Our contribution in this regard is highlighted in this section, which outlines the data collection, feature selection strategy and the metrics used to evaluate the performance of the classifiers.
A. DATA COLLECTION
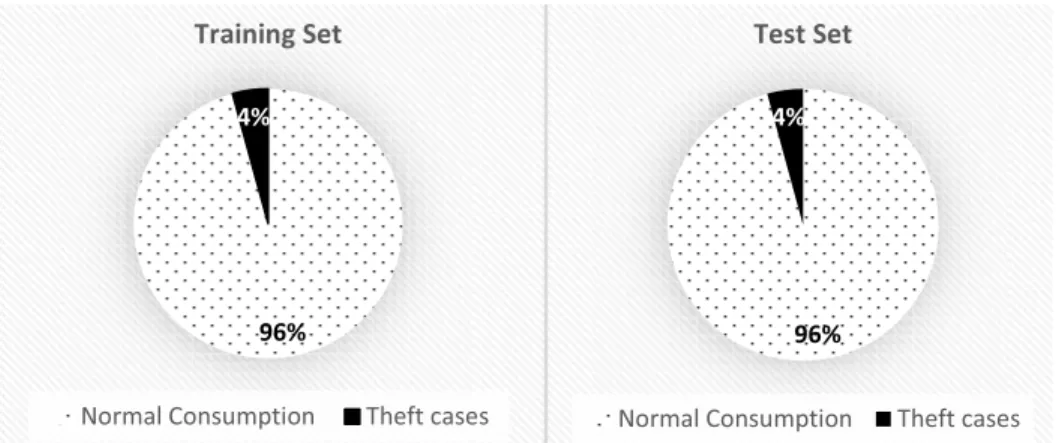
For NTL detection, a real dataset is collected from a power supply company in Pakistan. Due to sensitive nature of the data, consumers’ information is kept anonymous. This dataset contains consumers’ monthly consumption records over a period of 15 months spanning between January 2015 and March 2016. It comprises of 80,244 records. The dataset is randomly split into train and test sets with the ratio of 80% and 20%, respectively. The training set contains 64,195 records out of which 61,456 are normal records with no theft and 2,739 are abnormal records where the users have committed stealing of electricity. Test set contains 16,049 records out of which 15,366 are normal consumption records and 683 records contain NTL. The percentage of NTL in both sets is 4%. As the number of normal users is always much greater than the number of abnormal users (thieves), this data is considered imbalanced and biased towards major represen-tation of normal users. This behavior is shown in Figure3 and a detailed characteristic chart of train and test data is presented in Table3.
B. PRE-PROCESSING
Initially, a set of 71 features is selected that span across six major categories as illustrated in Appendix A. These include normal amount, normal units, additional amount, additional units, bill info and extra info. The category ‘Normal amount’ contains all features describing characteristics related with billed amount like regular amount, opening amount, closing amount and surcharge. The category ‘Normal Units’ contains features describing characteristics of billed units like regular
FIGURE 3. Imbalanced data representation.
TABLE 3. Data characteristic chart.
units and average units. The category ‘Additional amount’ contains features describing any additional amount billed like late payment surcharge across different time-lines. The category ‘Additional units’ contains features describing any additional units billed. The category ‘Bill info’ consists of features describing characteristics of bills like billing month and billing class. The category ‘Extra info’ contains features describing any characteristic which is not directly part of the bill. An example of such a feature is ‘last disconnection rea-son’, which describes the reason electricity was disconnected last time.
C. SELECTING TOP-K FEATURES
One of the contributions of this paper is to find the optimum number ofkfeatures that can provide best theft prediction in a real dataset. It is observed that not every feature has an equal or comparable participation in predicting the NTL. Some features have a high role while others have a negligible role. Also, using all 71 features to predict NTL will increase the computational complexity of the classifiers. It turns out that there should be a threshold for the contributing features beyond which including or excluding features should not affect the efficiency of the classifier. For this, we first sort the feature set in descending order with respect to feature importance [53]. It is a measure that uses accuracy to filter attributes which are most suitable for correctly identifying the target variable. Thus, it gives an insight to the relative importance of every feature with respect to the target variable. For a theoretical definition of feature importance, the reader
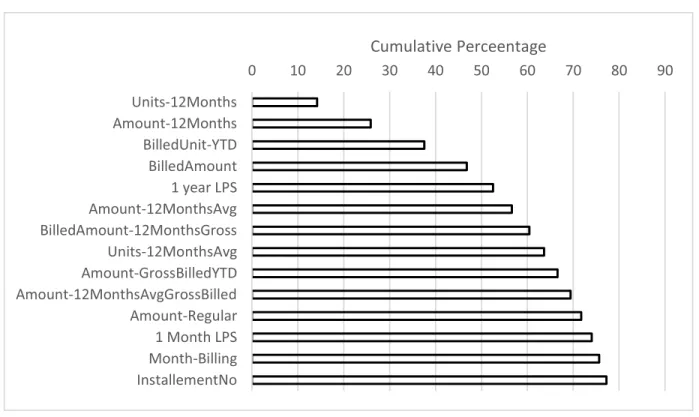
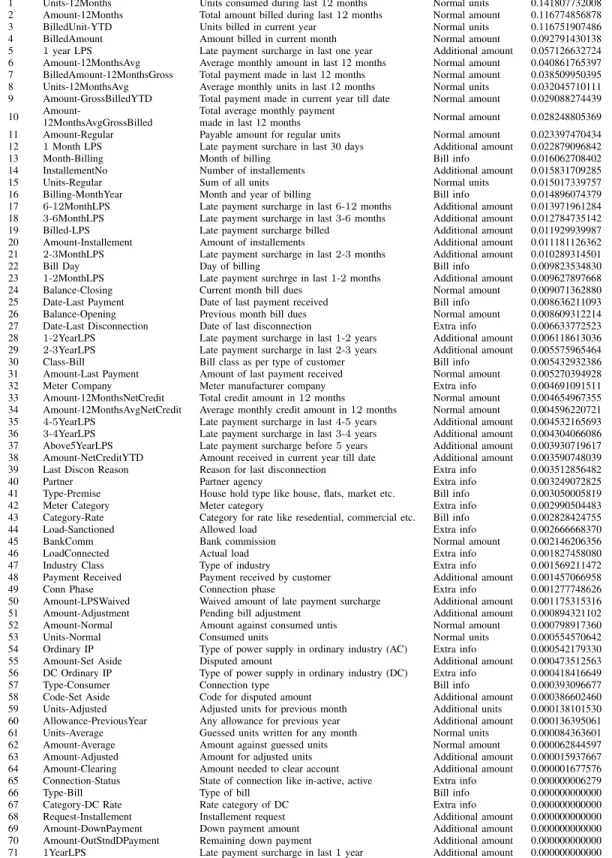
can refer to [47]. Then, we apply Gini Index to find the top-knumber of features for which the F-measure is the highest wherekranges from 1 to 71. Finally, thekthvalue for which the best F-measure is found is selected. For our data set, the value ofkwith best F-measure is 14. This indicates that using this set of top 14 features to find NTL has the same behavior as using all 71 features. This simulation has not only identified key features that are participating in predicting NTL in the real dataset but it also has helped to signifi-cantly reduce the execution time of the classifiers. Table6 lists 71 features and their corresponding feature importance. The cumulative percentage of feature importance of top 14 features is presented in Figure4, which shows that the con-tribution of top 14 features in predicting NTL is 77%.
D. NTL AND EVALUATION METRIC
NTL detection is an application of imbalance problem domain. It is a problem where the dataset is highly biased towards one of the outcomes of the target variable while the other outcome(s) remains least representative. Interestingly, the focus is on the least representative outcome. This leads to the requirement of an appropriate selection of the evaluation metric. Taking the example of NTL detection, most of the users are not thieves (True Negative) while few are thieves (True Positive). Now selecting accuracy as an evaluation metric would be a wrong choice as the results will be highly biased towards the most representative class, i.e. TN. In fact, we need a measure which should comprehensively give an insight to the actual number of thieves (recall) as well as the actual number of predicted thieves (precision) along with the combination of the two. For this, F-measure is used which combines precision and recall. In this work, we have used precision, recall and F-measure as our performance evalua-tion metrics. Equaevalua-tions11-13define these terms:
Precision= TP
TP+FP (11)
Recall = TP
TP+FN (12)
F−measure= 2×(Precision×Recall)
FIGURE 4. Cumulative percentage of feature importance of top 14 features. where TP, FP and FN are True Positive, False Positive and False Negative, respectively. FP is the number of normal users predicted as thieves by the classifier and FN is the number of thieves predicted as normal by the classifier.
IV. EXPERIMENTAL RESULTS
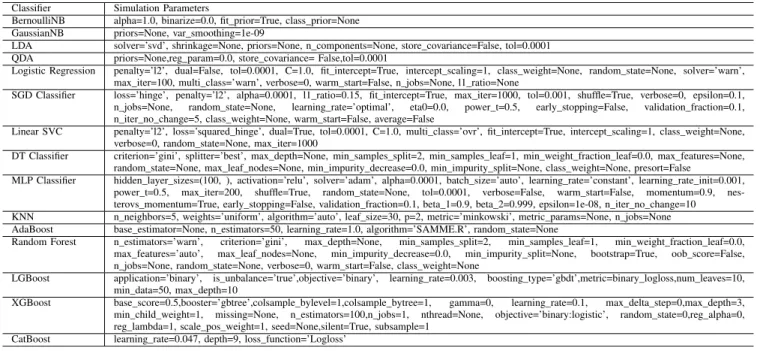
In this section, we validate our work by performing extensive simulations using Python 3.4 on a 64-bit Windows Server with hardware specification including an Intel Xeon 2.2 GHz processor and 32 GB RAM. Other than CatBoost, LGBoost and XGBoost, all the classifiers are trained and tested using the scikit-learn [54] open source library for Python. Cat-Boost [49], LGCat-Boost [51] and XGCat-Boost [52] are also open source libraries which are available in GitHub for Python. Secondly, we perform a detailed analysis of the results of the classifiers which span across 9 different types. A list of simulation parameters of the classifiers is presented in AppendixB.
The top-14 features identified in feature selection process are used to calculate the confusion matrix, precision, recall and F-measure of different machine learning classifiers. The confusion matrix for all classifiers is presented int Table4.
One of our contributions is that we compare the results of the classifiers with respect to the types of the classi-fiers. Another contribution is that we compare the effi-ciency of recently developed CatBoost, LightGBM and XGBoost with other supervised machine learning classifiers including Gaussian Naive Bayes, Bernoulli Naive Bayes, Quadratic Discriminant Analysis (QDA), Stochastic Gradient Descent (SGD), Decision Trees, Random Forest, K-Nearest
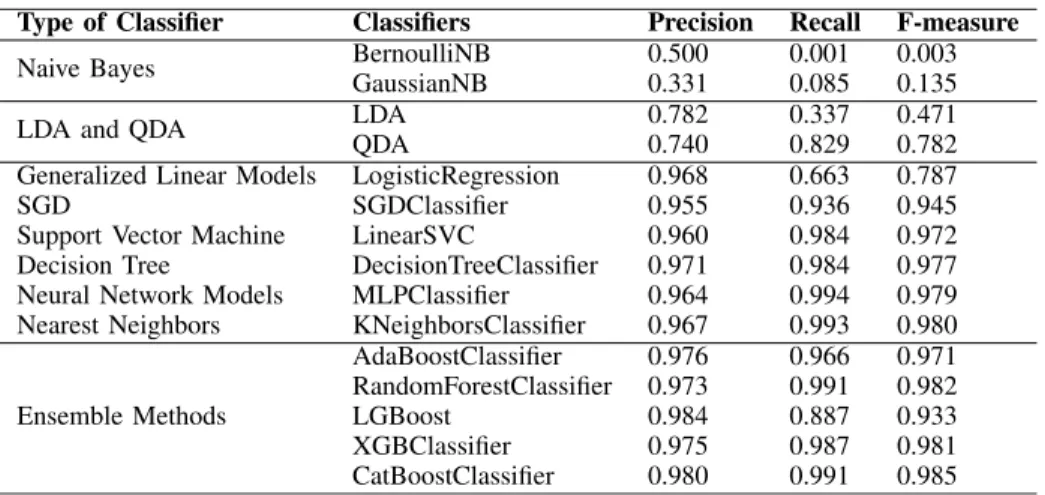
Neighbors (KNN), Adaboost, Multi-Layer Perceptron (MLP) classifier, Linear SVC, Logistic regression and Linear Discriminant Analysis (LDA). The precision, recall and F-measure for all the classifiers are presented in Table5.
A. PERFORMANCE ANALYSIS OF DIFFERENT TYPES OF CLASSIFIERS FOR NTL DETECTION
It is interesting to observe that considering F-measure as the classifiers’ efficiency measure, ensemble methods outper-formed all other types of classifiers. In fact, top three classi-fiers having best F-measures belong to the ensemble methods namely CatBoost, Random Forest and XGBoost, while Naive Bayes performed worst with lowest two F-measures. A reason for this behavior is that ensemble methods are robust to over-fitting as compared to Naive Bayes classifiers which tend to overfit the model. Thus, any method which overfits the model will suffer. Two classifiers are experimented in ’LDA and QDA’ type. The F-measure of LDA is quite low, that is, 0.471 while the F-measure of QDA is observed to be 0.782 which shows a percent increase in the performance of 66% while the percent increase in the performance from Naive Bayes to ’LDA and QDA’ type is 248%. The type ’Generalized Linear Models’ performed no better than the type ’LDA and QDA’. The F-measure obtained from its classifier, that is, Logistic Regression, is 0.787. The percent increase in the per-formance from ’LDA and QDA’ to the type of ’Generalized Linear Models’ is only 0.64%. One classifier from each of SGD, SVM, DT, NN and Nearest Neighbors is tested. Their F-measures are observed as 0.945,0.972,0.977,0.979 and 0.980 respectively. Notably, all these readings are above 0.90.
TABLE 4. TP, TN, FP and FN of all classifiers.
TABLE 5. Precision, recall and F-measure of all classifiers.
LGBoost has the worst F-measure among ensemble methods which is 0.933 while the F-measure of AdaBoost is 0.971. The percent increase in the performance from the worst to the best classifier in the ensemble methods is only 5.5% which shows that the performance of all classifiers in ensemble methods is close to each other. The comparison of all types of classifiers using F-measure is shown in Figure5where T-1 to T-9 correspond to the types of Naive Bayes, LDA and QDA, Generalized Linear Models, SGD, SVM, DT, NN, Nearest Neighbors and Ensemble Methods, respectively.
Considering recall as the efficiency measure of the clas-sifiers, NN outperformed other types with MLP Classifier having a recall of 0.994. The worst two recalls are observed for the Naive Bayes. For the type ’LDA and QDA’, LDA has a recall as low as 0.337 while the recall of QDA is 0.829 which shows a performance increase of 146%. The type ’Generalized Linear Models’ performed no better than ’LDA and QDA’. The classifier used for this type is Logistic Regression. Its recall is 0.663. An interesting point is that the counterpart of logistic regression, that is, MLP Classifier which belongs to the type of NN, has the highest recall. Thus, the percentage increase in performance from the Logistic Regression to MLP Classifier is 50%. The only difference between the two classifiers is the number of hidden layers
between input and the output layer. This observation has led us to a new future direction of testing deep learning in our real dataset. The recalls of each of the classifiers from SGD, SVM, DT and Nearest Neighbors are observed as 0.936,0.984,0.984 and 0.993 respectively. The recalls of ensemble methods are 0.966,0.991,0.887,0.987 and 0.991. These recalls are for the classifiers AdaBoost, Random For-est, LGBoost, XGBoost and CatBoost respectively. Other than LGBoost, the recalls of all ensemble methods are above 0.960 which shows that the performance of ensemble meth-ods is very good for our data. The percent increase from the worst to the best classifier in the ensemble methods is 11.7%. The comparison of different types of classifiers using recall is shown in Figure6.
Considering precision as the efficiency measure of the classifiers, all the classifiers used in ensemble methods out-performed rest of the types. LGBoost has the best pre-cision of 0.984, which interestingly also has the lowest recall and F-measure among the ensemble methods. This indicates that LGBoost has the lowest FP. The other clas-sifiers of AdaBoost, Random Forest, XGBoost and Cat-Boost from ensemble methods have precision reading as 0.976,0.973,0.975 and 0.980, respectively. There is an increase of only 1.1% of the performance from the worst to
FIGURE 5. Comparison of different types of classifiers using F-measure.
FIGURE 6. Comparison of different types of classifiers using recall. the best classifier among the ensemble methods. This shows that not only all classifiers in this type performed better but also their performance is very close to one another. In [24], the authors have used a similar approach in finding the NTL in a synthesized dataset. They have used detection rate and False Positive Rate (FPR) as the performance evaluation metrics. They have found that LGBoost and CatBoost outperformed XGBoost with LGBoost being the fastest but it has the highest FPR, while CatBoost is the slowest but it has the lowest FPR. The worst two precisions in our experiment are for the type ’Naive Bayes’. The two classifiers from the type
’LDA and QDA’ has the precision of 0.782 and 0.740. This shows an increase of 48% in the performance from Naive Bayes type to ’LDA and QDA’ type. Each of the classifiers from the types of Generalized Linear Models, SGD, SVM, DT, NN and Nearest Neighbors has precision readings as 0.968,0.955,0.960,0.971,0.964 and 0.967, respectively.
B. PERFORMANCE ANALYSIS OF INDIVIDUAL CLASSIFIERS FOR NTL DETECTION
We have used precision, recall and F-measure as the per-formance evaluation metrics. The best F-measure is 0.985
TABLE 6. Feature set.
for CatBoost classifier, which narrowly outperforms Random Forest and KNN. These three classifiers have corresponding high precision and recall values indicating small FP and small FN values, respectively.
The F-measure of LGBoost classifier is 0.933, which is comparatively less than the F-measure of CatBoost classifier, i.e 0.985, while the corresponding figure for XGBoost is 0.981. There is an increase of 5.6% in the F-measure from
TABLE 7. List of simulation parameters.
LGBoost to CatBoost. Overall, precision and recall obtained for CabBoost, XGBoost and LGBoost classifiers are above 0.97 except that the recall of LGBoost is 0.887.
The F-measures is significantly increased from 0.471 to 0.782 when choosing QDA instead of LDA, which indicates that QDA outperforms LDA. This is because when multiple classes have a different co-variance relationship then LDA suffers while QDA remains a better option. This gives an insight to the characteristics of features of this real data set, that is, for NTL, there is a room to explore more about the co-variance relationship for individual classes.
V. CONCLUSION AND FUTURE WORK
This paper has used a real-world dataset of a power supply company in Pakistan for NTL detection. The dataset contains approximately 80,000 monthly consumption records along with 71 features. We have tested 15 machine learning clas-sifiers, which span across 9 types for a potential detection of NTL.
One of our findings is that, with respect to F-measure, ensemble methods outperformed other types and with respect to Recall, ANN outperformed other types of the classifiers. Considering individual classifier analysis, CatBoost outper-formed all other classifiers when taking F-measure into account while MLP Classifier performed best when con-sidering Recall as the performance evaluation metric. One of the observations is that recall increases by 50% when MLP Classifier is used instead of Logistic Regression. This shows that testing deep learning with many hidden layers can be a potential future contribution in NTL detection. Using feature importance along with Gini Index, we have derived a mechanism to identify the top-14 features, out of 71 features, which are contributing 77% in NTL detection. This has not only significantly reduced the execution time but also has identified useful features for NTL detection in a real dataset.
There is still a need for creating a benchmark dataset which can widely be used in NTL detection. Another future direc-tion is using penalized machine learning models in which weighted classifiers [55] are used. The best classifiers identi-fied in this study can also be implemented on different feature selection approaches.
APPENDIXES APPENDIX A FEATURE SET
The list of 71 features along with their categories, fea-ture description and feafea-ture importance values is described in Table6.
APPENDIX B
SIMULATION PARAMETERS
Table7contains the list of parameters of the classifiers used in the simulation.
ACKNOWLEDGMENT
The authors would like to thank to the power supply company in Pakistan that has provided us their data for NTL detection. REFERENCES
[1] J. Rasheed, F. Ahmed, and R. Rasheed, ‘‘Survey: NTL detection in elec-tricity energy supply,’’Int. J. Comput. Appl., vol. 155, no. 9, pp. 18–23, Dec. 2016.
[2] J. A. Meira, P. Glauner, R. State, P. Valtchev, L. Dolberg, F. Bettinger, and D. Duarte, ‘‘Distilling provider-independent data for general detection of non-technical losses,’’ inProc. IEEE Power Energy Conf. Illinois (PECI), Feb. 2017, pp. 1–5.
[3] R. R. Bhat, R. D. Trevizan, R. Sengupta, X. Li, and A. Bretas, ‘‘Identi-fying nontechnical power loss via spatial and temporal deep learning,’’ inProc. 15th IEEE Int. Conf. Mach. Learn. Appl. (ICMLA), Dec. 2016, pp. 272–279.
[4] Z. Hussain, S. Memon, R. Shah, Z. A. Bhutto, and M. Aljawarneh, ‘‘Meth-ods and techniques of electricity thieving in Pakistan,’’J. Power Energy Eng., vol. 4, no. 9, pp. 1–10, 2016.
[5] P. Branco, L. Torgo, and R. P. Ribeiro, ‘‘A survey of predictive modeling on imbalanced domains,’’CSURACM Comput. Surv., vol. 49, no. 2, pp. 1–50, Aug. 2016, doi:10.1145/2907070.
[6] M. H. ur Rehman, I. Yaqoob, K. Salah, M. Imran, P. P. Jayaraman, and C. Perera, ‘‘The role of big data analytics in industrial Inter-net of Things,’’Future Gener. Comput. Syst., vol. 99, pp. 247–259, Oct. 2019.
[7] M. I. Razzak, M. Imran, and G. Xu, ‘‘Big data analytics for pre-ventive medicine,’’ Neural Comput. Appl., Mar. 2019, doi: 10.1007/ s00521-019-04095-y.
[8] B. Agarwal and N. Mittal, ‘‘Text classification using machine learning methods—A survey,’’ inProc. 2nd Int. Conf. Soft Comput. Problem Solving (SocProS). New Delhi, India: Springer, Dec. 2012, pp. 701–709. [9] P. Velan, M. Čermak, P. Čeleda, and M. Drašar, ‘‘A survey of methods
for encrypted traffic classification and analysis,’’Int. J. Netw. Manage., vol. 25, no. 5, pp. 355–374, Sep. 2015.
[10] R. A. A. Habeeb, F. Nasaruddin, A. Gani, M. A. Amanullah, I. A. T. Hashem, E. Ahmed, and M. Imran, ‘‘Clustering-based real-time anomaly detection—A breakthrough in big data technologies,’’ Trans. Emerg. Telecommun. Technol., to be published. [Online]. Available: https://onlinelibrary.wiley.com/doi/abs/10.1002/ett.3647
[11] R. A. A. Habeeb, F. Nasaruddin, A. Gani, I. A. T. Hashem, E. Ahmed, and M. Imran, ‘‘Real-time big data processing for anomaly detection: A survey,’’ Int. J. Inf. Manage., vol. 45, pp. 289–307, Apr. 2019. [Online]. Available: http://www.sciencedirect.com/science/article/pii/ S0268401218301658
[12] G. M. Messinis and N. D. Hatziargyriou, ‘‘Review of non-technical loss detection methods,’’Electr. Power Syst. Res., vol. 158, pp. 250–266, May 2018.
[13] C. Leon, F. Biscarri, I. Monedero, J. I. Guerrero, J. Biscarri, and R. Millan, ‘‘Variability and trend-based generalized rule induction model to NTL detection in power companies,’’IEEE Trans. Power Syst., vol. 26, no. 4, pp. 1798–1807, Nov. 2011.
[14] S. Singh and A. Yassine, ‘‘Big data mining of energy time series for behav-ioral analytics and energy consumption forecasting,’’Energies, vol. 11, no. 2, p. 452, Feb. 2018.
[15] C. C. Sánchez-Zuleta, J. P. Fernández-Gutiérrez, and C. C. Piedrahita-Escobar, ‘‘Identification of the characteristics incident to the detection of non-technical losses for two colombian energy companies,’’Revista Facultad de Ingeniería Universidad de Antioquia, vol. 84, pp. 60–71, Sep. 2017.
[16] D. D. Sharma, S. N. Singh, J. Lin, and E. Foruzan, ‘‘Identification and characterization of irregular consumptions of load data,’’J. Mod. Power Syst. Clean Energy, vol. 5, no. 3, pp. 465–477, May 2017.
[17] K. Zheng, Y. Wang, Q. Chen, and Y. Li, ‘‘Electricity theft detecting based on density-clustering method,’’ inProc. IEEE Innov. Smart Grid Technol.-Asia (ISGT-Technol.-Asia), Dec. 2017, pp. 1–6.
[18] D. D. Sharma and S. Singh, ‘‘Aberration detection in electricity consump-tion using clustering technique,’’Int. J. Energy Sector Manage., vol. 9, no. 4, pp. 451–470, Nov. 2015.
[19] L. A. Passos, Jr., C. C. O. Ramos, D. Rodrigues, D. R. Pereira, A. N. De Souza, K. A. P. Da Costa, and J. P. Papa, ‘‘Unsupervised non-technical losses identification through optimum-path forest,’’Electr. Power Syst. Res., vol. 140, pp. 413–423, Nov. 2016.
[20] J. Yeckle and B. Tang, ‘‘Detection of electricity theft in customer consump-tion using outlier detecconsump-tion algorithms,’’ inProc. IEEE 1st Int. Conf. Data Intell. Secur. (ICDIS), Apr. 2018, pp. 135–140.
[21] Z. Zheng, Y. Yang, X. Niu, H.-N. Dai, and Y. Zhou, ‘‘Wide and deep convolutional neural networks for electricity-theft detection to secure smart grids,’’IEEE Trans. Ind. Informat., vol. 14, no. 4, pp. 1606–1615, Apr. 2018.
[22] J. V. Spirić, S. S. Stanković, and M. B. Dočić, ‘‘Identification of suspi-cious electricity customers,’’Int. J. Elect. Power Energy Syst., vol. 95, pp. 635–643, Feb. 2018.
[23] J. L. Viegas, P. R. Esteves, and S. M. Vieira, ‘‘Clustering-based novelty detection for identification of non-technical losses,’’Int. J. Elect. Power Energy Syst., vol. 101, pp. 301–310, Oct. 2018.
[24] R. Punmiya and S. Choe, ‘‘Energy theft detection using gradient boosting theft detector with feature engineering-based preprocessing,’’IEEE Trans. Smart Grid, vol. 10, no. 2, pp. 2326–2329, Mar. 2019.
[25] J. I. Guerrero, I. Monedero, F. Biscarri, J. Biscarri, R. Millan, and C. Leon, ‘‘Non-technical losses reduction by improving the inspections accuracy in a power utility,’’IEEE Trans. Power Syst., vol. 33, no. 2, pp. 1209–1218, Mar. 2018.
[26] B. Peng, C. Wan, S. Dong, J. Lin, Y. Song, Y. Zhang, and J. Xiong, ‘‘A two-stage pattern recognition method for electric customer classification in smart grid,’’ inProc. IEEE Int. Conf. Smart Grid Commun. (SmartGrid-Comm), Nov. 2016, pp. 758–763.
[27] E. Terciyanli, E. Eryigit, T. Emre, and S. Caliskan, ‘‘Score based non-technical loss detection algorithm for electricity distribution networks,’’ in Proc. IEEE 5th Int. Smart Grid Cities Congr. Fair (ICSG), Istanbul, Turkey, Apr. 2017, pp. 180–184.
[28] T. Hartmann, A. Moawad, F. Fouquet, Y. Reckinger, T. Mouelhi, J. Klein, and Y. Le Traon, ‘‘Suspicious electric consumption detec-tion based on multi-profiling using live machine learning,’’ in Proc. IEEE Int. Conf. Smart Grid Commun. (SmartGridComm), Nov. 2015, pp. 891–896.
[29] A. A. Chauhan, ‘‘Non-technical losses in power system and monitoring of electricity theft over low-tension poles,’’ inProc. IEEE 2nd Int. Conf. Adv. Comput. Commun. Eng. (ICACCE), May 2015, pp. 280–284.
[30] W. Han and Y. Xiao, ‘‘NFD: A practical scheme to detect non-technical loss fraud in smart grid,’’ inProc. IEEE Int. Conf. Commun. (ICC), Jun. 2014, pp. 605–609.
[31] R. M. Mutupe, S. O. Osuri, M. J. Lencwe, and S. P. D. Chowdhury, ‘‘Electricity theft detection system with RF communication between distri-bution and customer usage,’’ inProc. IEEE Power Africa PES, Jun. 2017, pp. 566–572.
[32] M. Buevich, X. Zhang, O. Shih, D. Schnitzer, T. Escalada, A. Jacquiau-Chamski, J. Thacker, and A. Rowe, ‘‘Microgrid losses: When the whole is greater than the sum of its parts,’’ inProc. 7th Int. Conf. Cyber-Phys. Syst.. Apr. 2016, pp. 46–50.
[33] I. Rish, ‘‘An empirical study of the Naïve Bayes classifier,’’ inProc. IJCAI Workshop Empirical Methods Artif. Intell., 2001, vol. 3, no. 22, pp. 41–46.
[34] G. H. John and P. Langley, ‘‘Estimating continuous distributions in Bayesian classifiers,’’ in Proc. 11th Conf. Uncertainty Artif. Intell. San Mateo, CA, USA: Morgan Kaufmann, 1995, pp. 338–345.
[35] A. McCallum and K. Nigam, ‘‘A comparison of event models for Naïve Bayes text classification,’’ inProc. AAAI Workshop Learn. Text Catego-rization, 1998, vol. 752, no. 1, pp. 41–48.
[36] S. Balakrishnama and A. Ganapathiraju, ‘‘Linear discriminant analysis— A brief tutorial,’’Inst. Signal Inf. Process., vol. 18, pp. 1–8, Mar. 1998. [37] S. Srivastava, M. R. Gupta, and B. A. Frigyik, ‘‘Bayesian quadratic
discriminant analysis,’’ J. Mach. Learn. Res., vol. 8, pp. 1277–1305, Jun. 2007.
[38] A. Y. Ng, ‘‘Feature selection, L1 vs. L2 regularization, and rotational invariance,’’ inProc. ACM 21st Int. Conf. Mach. Learn., 2004, p. 78. [39] T. Zhang, ‘‘Solving large scale linear prediction problems using stochastic
gradient descent algorithms,’’ inProc. ACM 21st Int. Conf. Mach. Learn., 2004, p. 116.
[40] H. Zou and T. Hastie, ‘‘Regularization and variable selection via the elastic net,’’J. Roy. Stat. Soc. B, Stat. Methodol., vol. 67, no. 2, pp. 301–320, Apr. 2005.
[41] M. A. Hearst, S. T. Dumais, E. Osman, J. Platt, and B. Scholkopf, ‘‘Support vector machines,’’IEEE Intell. Syst. Appl., vol. 13, no. 4, pp. 18–28, Jul./Aug. 2008.
[42] M. Awais, N. Badruddin, and M. Drieberg, ‘‘A hybrid approach to detect driver drowsiness utilizing physiological signals to improve sys-tem performance and wearability,’’ Sensors, vol. 17, no. 9, p. 1991, Aug. 2017.
[43] M. Raza, M. Awais, W. Ellahi, N. Aslam, H. Nguyen, and H. Le-Minh, ‘‘Diagnosis and monitoring of Alzheimer’s patients using classical and deep learning techniques,’’Expert Syst. Appl., vol. 136, pp. 353–364, Dec. 2019.
[44] D. E. Rumelhart, G. E. Hinton, and R. J. Williams, ‘‘Learning representa-tions by back-propagating errors,’’Cognit. Model., vol. 5, no. 3, p. 1, 1988. [45] J. Goldberger, G. E. Hinton, S. T. Roweis, and R. R. Salakhutdinov, ‘‘Neighbourhood components analysis,’’ inProc. Adv. Neural Inf. Process. Syst., 2005, pp. 513–520.
[46] M. Awais, L. Palmerini, and L. Chiari, ‘‘Physical activity classification using body-worn inertial sensors in a multi-sensor setup,’’ inProc. IEEE 2nd Int. Forum Res. Technol. Soc. Ind. Leveraging Better Tomorrow (RTSI), Sep. 2016, pp. 1–4.
[47] L. Breiman, ‘‘Random forests,’’Mach. Learn., vol. 45, no. 1, pp. 5–32, 2001.
[48] Y. Freund and R. E. Schapire, ‘‘A decisitheoretic generalization of on-line learning and an application to boosting,’’J. Comput. Syst. Sci., vol. 55, no. 1, pp. 119–139, Aug. 1997.
[49] L. Prokhorenkova, G. Gusev, A. Vorobev, A. V. Dorogush, and A. Gulin, ‘‘CatBoost: Unbiased boosting with categorical features,’’ inProc. Adv. Neural Inf. Process. Syst., 2018, pp. 6639–6649.
[50] A. V. Dorogush, V. Ershov, and A. Gulin, ‘‘CatBoost: Gradient boosting with categorical features support,’’ 2018, arXiv:1810.11363. [Online]. Available: https://arxiv.org/abs/1810.11363
[51] G. Ke, Q. Meng, T. Finley, T. Wang, W. Chen, W. Ma, Q. Ye, and T.-Y. Liu, ‘‘LightGBM: A highly efficient gradient boosting decision tree,’’ inProc. Adv. Neural Inf. Process. Syst., 2017, pp. 3146–3154.
[52] T. Chen and C. Guestrin, ‘‘XGBoost: A scalable tree boosting system,’’ inProc. 22nd ACM SIGKDD Int. Conf. Knowl. Discovery Data Mining, 2016, pp. 785–794.
[53] A. Liaw and M. Wiener, ‘‘Classification and regression by randomforest,’’ R News, vol. 2, no. 3, pp. 18–22, 2002.
[54] F. Pedregosa, G. Varoquaux, A. Gramfort, V. Michel, B. Thirion, O. Grisel, M. Blondel, P. Prettenhofer, R. Weiss, and V. Dubourg, ‘‘Scikit-learn: Machine learning in Python,’’ J. Mach. Learn. Res., vol. 12, pp. 2825–2830, Oct. 2011.
[55] M. Awais, M. Raza, K. Ali, Z. Ali, M. Irfan, O. Chughtai, I. Khan, S. Kim, and M. Ur Rehman, ‘‘An Internet of Things based bed-egress alerting paradigm using wearable sensors in elderly care environment,’’Sensors, vol. 19, no. 11, p. 2498, May 2019.
KHAWAJA MOYEEZULLAH GHORI received
the B.S. degree in computer science from International Islamic University (IIU), Islamabad, Pakistan, in 2002, and the M.S. degree in com-puter science from the FAST National University of Computer and Emerging Sciences (NUCES), Islamabad, in 2004. He is currently pursuing the Ph.D. degree with the University of Debrecen, Hungary. He is currently an Assistant Profes-sor with the Department of Computer Science, National University of Modern Languages, Islamabad. He is currently working on the problem of detecting non-technical losses (NTL) in power sector. His research interests include data mining and machine learning.
RABEEH AYAZ ABBASI received the Ph.D. degree from the University of Koblenz and Landau, Germany, in 2010. Since 2011, he has been an Assistant Professor with Quaid-i-Azam University, Islamabad, Pakistan. He has a vast research experience in the fields of social media analytics and social network analysis. He has pub-lished more than 35 articles in reputed journals such as theIEEE Computational Intelligence Mag-azine,Computers in Human Behavior,Telematics and Informatics, andApplied Soft Computing. He has published more than 35 articles in reputed international conferences such as the ACM Hyper-Text Conference, the ACM World Wide Web Conference, the Pacific–Asia Conference on Knowledge Discovery and Data mining, and the European Conference on Information Retrieval. His researches focus on leveraging positive aspects of social media, including social media use in saving lives, understanding events, and analyzing sentiments.
MUHAMMAD AWAIS(Member, IEEE) received the B.S. degree in electronic engineering from Mohammad Ali Jinnah University, Pakistan, the M.S. degree in electrical and electronic engi-neering from Universiti Teknologi PETRONAS, Malaysia, and the Ph.D. degree in biomedi-cal, electribiomedi-cal, and system engineering from the University of Bologna, Italy. He is currently a Research Fellow of signal processing and machine learning with the University of Leeds, U.K. He was a biomedical and electrical engineer, and a data scientist for more than eight years in the domains of data mining, data analytics, signal processing, application-based machine learning, deep learning to develop information and communication technologies (ICTs)-based systems for remote sensing, and biomedical and health care domains. He is member of the IEEE Engineering in Medicine and Biology Society (EMBS). He is Reviewer of many well-reputed journals such asFuture Generation Computer Systems (Elsevier), the IEEE JBHI, IEEE ACCESS,IEEE Communication Magazine, Sensors(MDPI), JMIR, and CSSP.
MUHAMMAD IMRAN has been an Associate
Professor with the College of Applied Computer Science, King Saud University (KSU), since 2011. He has published a number of research arti-cles in top international conferences and journals. His research was financially supported by sev-eral grants. His research interests include mobile and wireless networks, the Internet of Things (IoT), software-defined networking, cloud and edge computing, and information security. He has received a number of awards such as the Asia Pacific Advanced Network Fellowship. He has been involved in more than fifty conferences and work-shops in various capacities such as a chair, co-chair, and technical program committee member, including the IEEE ICC, GLOBECOM, AINA, LCN, IWCMC, IFIP WWIC, and BWCCA. He has served as a Guest Editor for theIEEE Communications Magazine(SCIE),Computer Networks(SCIE, Elsevier),Future Generation Computer Systems(Elsevier),Sensors(MDPI) (SCIE), theInternational Journal of Distributed Sensor Networks(SCIE, Hindawi), theJournal of Internet Technology(SCIE), and the International Journal of Autonomous and Adaptive Communications Systems. He also serves as an Associate Editor for IEEE ACCESS, theIEEE Communications Magazine,Future Generation Computer Systems,Wireless Communication and Mobile Computing journal (SCIE, Wiley),Ad Hoc and Sensor Wire-less Networks journal (SCIE), IET Wireless Sensor Systems, the Inter-national Journal of Autonomous and Adaptive Communication Systems (Inderscience), and theInternational Journal of Information Technology and Electrical Engineering. He has appointed as an Editor-in-Chief forEAI Transactions on Pervasive Health and Technologyby the European Alliance for Innovation (EAI).
ATA ULLAHreceived the B.S. and M.S. degrees in computer science from the COMSATS Insti-tute of Information Technology (CIIT), Islamabad, Pakistan, in 2005 and 2007, respectively, and the Ph.D. degree in computer science in the area of wireless network security from IIUI, Pakistan, in 2016. From 2007 to 2008, he was a Software Engineer with Streaming Networks, Islamabad. He joined the National University of Modern Lan-guagess (NUML), Islamabad, where he was a Lec-turer/Head Project Committee Member, from 2008 to 2015, and an Assistant Professor with the Department of Computer Science, from 2015 to 2017. He was a Research Fellow of the School of Computer and Communication Engineering, University of Science and Technology Beijing, China, from November 2017 to August 2018. He has rejoined the NUML in Septem-ber 2018. He has supervised 112 projects at the bachelor’s degree level. He was awarded ICT funding for the development of projects. He has authored several articles in peer-reviewed ISI indexed impact factor journals and international conferences. He secured positions in one international and 45 national level software competitions. He remained as a faculty partner for industrial collaboration in software development. He has programming expertise in C, C#,.net, Java, PHP, and NS2. His areas of interests include WSN, the IoT, cyber physical social thinking (CPST) space, health-services, NGN, VoIP, and their security solutions. He is also a Reviewer and a guest editor of journals and international conference papers.
LASZLO SZATHMARY received the B.Sc. and M.Sc. degrees in computer science from the Uni-versity of Debrecen, Hungary, and the Ph.D. degree in computer science from Henri Poincaré University, Nancy, France. He was a Postdoc-toral Research Fellow of Université du Québec à Montréal (UQAM), Montreal, Canada. He is cur-rently an Associate Professor with the University of Debrecen. His research interests include for-mal concept analysis, data mining, and artificial intelligence.