This item was submitted to Loughborough’s Institutional Repository (https://dspace.lboro.ac.uk/) by the author and is made available under the
following Creative Commons Licence conditions.
For the full text of this licence, please go to:
Measuring the Effectiveness of Credit Guarantee Schemes
Evidence from Malaysia
GRAHAME BOOCOCK
Loughborough University, UK
MOHD NOOR MOHD SHARIFF
Universiti Utara Malaysia
Governments across the globe are increasingly utilizing credit guarantee schemes to support SMEs. This article fills a gap in the academic literature for developing
countries by reviewing the effectiveness of the New Principal Guarantee Scheme (NPGS) offered by the Credit Guarantee Corporation (CGC) in Malaysia. Using a variety of research methods, the authors investigate whether the CGC has achieved its objectives of generating finance and economic additionality without placing its financial resources under undue strain or jeopardizing its relationships with participating financial institutions. It is almost impossible to establish ‘definitive’ measures of additionality yet our findings provide sufficient evidence to demonstrate that the CGC is not meeting all of its objectives. The authors put forward an
integrated package of measures designed to enhance the effectiveness of the NPGS.
KEYWORDS: credit rationing; economic additionality; finance additionality; guarantee schemes; SMEs; sustainability
Introduction
Small and medium-sized enterprises (SMEs) are considered to be an engine for growth in both developed and developing countries. The benefits of a vibrant SME sector include: the creation of employment opportunities; the strengthening of industrial linkages; the promotion of flexibility and innovation; and, the generation of export revenues (Harvie and Lee, 2001; Lerner, 2002; Mensah, 1996). In addition, there is growing acceptance of the role that SMEs play in wider social and economic restructuring (Smallbone and Welter, 2001). In order to capture these economic and social benefits, virtually all governments offer soft business support to this sector (Wren and Storey, 2002). There has also been increasing utilization of more
traditional forms of hard support, notably credit guarantee schemes (Levitsky, 1997a), whereby financial institutions are encouraged to make loans available to smaller enterprises, on the understanding that a government or quasi-government body will reimburse a percentage of the loan should the firm default.
The contribution of SMEs in Malaysia has been acknowledged since the early 1980s (Chee, 1992), and the Government has introduced a variety of agencies and
schemes to promote the development of this sector. Bank Negara Malaysia (BNM – the Central Bank) confirmed (BNM, 2001a: 8) that SMEs ‘represent a potential source of dynamism and driving force within the economy’ and stressed that the Credit Guarantee Corporation (CGC) forms a vital cog in the nation’s SME support network. Despite this high profile, the CGC’s operations had never been subject to independent empirical review until the authors conducted a pilot study (Boocock and Mohd Shariff, 1996) that formed the starting point of an ongoing research
programme.
Meyer and Nagarajan (1997: 2) observed that ‘no comprehensive evaluation of loan guarantees in developing countries has been conducted in recent years’. The
literature in this field has continued to focus on developed countries, for example: Camino and Cardone (1999) examined the role of loan guarantee associations in the European Union (EU), whereas Cowling and Mitchell (2003) conducted a micro-level study of the UK’s Loan Guarantee Scheme (LGS).
The findings presented here should therefore not only assist policy makers and practitioners in Malaysia, but also fill a gap in the academic literature by evaluating the operation of a guarantee scheme in an emerging economy.
The focus of attention is additionality, long recognized as the acid test of a guarantee scheme’s effectiveness (see for example Bannock and Partners, 1997; KPMG, 1999; National Economic Research Associates [NERA], 1990; Pieda, 1992). Policy
intervention should not subsidize firms to undertake activities that would have occurred anyway (Curran, 1999). The first component of additionality is that SMEs are able to access loans that would not have been available in the absence of a scheme (finance additionality [FA]). Guarantee recipients should utilize the funds to benefit their own companies and to generate positive externalities or ‘spillovers’ (Chittenden and Wildgust, 1999; Lerner, 2002). These economic and social benefits are encompassed in the concept of economic additionality (EA). The levels of FA and EA generally exert a strong influence on the net cost of any guarantee scheme and hence its sustainability (Levitsky, 1993).
The article investigates whether it is possible for the CGC’s main facility, the New Principal Guarantee Scheme (NPGS), to generate finance and economic
additionality without putting the financial resources of the Corporation under undue strain and/or jeopardizing its relationship with the participating financial institutions. Within this overall framework, the article explores various dimensions of additionality, subject to methodological limitations, and relates these findings to sustainability. The authors then put forward a number of recommendations to enhance the
effectiveness of the NPGS. Some of these proposals might have relevance for the design and implementation of guarantee schemes around the world.
The structure of the article is as follows. The following section offers essential background information on Malaysia and the operations of the CGC. The next section reviews the major issues identified in the literature on credit guarantee schemes, and sets out the specific research questions. After consideration of the methodology employed, the next three sections present the empirical findings on FA, EA and sustainability, respectively. The article closes with a series of
The Credit Guarantee Corporation in Malaysia
The CGC has been charged with the role of providing guarantees to support bank lending since 1972. It operates within a complex economic, financial and political environment. In the space of three decades, Malaysia has been transformed from a Third World nation reliant upon commodities (notably rubber, timber and palm oil) into an upper-middle-income developing country driven by manufacturing exports, especially in the electronics sector. Growth measured by GDP averaged over 8% in each year between 1988–96 inclusive. Nonetheless, Malaysia could not avoid the impact of the ‘Asian Crisis’ that struck the ASEAN 4 (Thailand, the Philippines, Malaysia and Indonesia) in late 1997 and resulted in serious recession across the region. GDP in Malaysia grew by a ‘mere’ 7.3% in 1997, before contracting by 7.4% in 1998. Government investment in infrastructure projects compensated for the sharp decline in the manufacturing sector, and growth recovered in 1999 and 2000 to 6.1% and 8.3% respectively. These counter-cyclical moves illustrate that policy makers are prepared to influence the direction of the economy, and to address perceived
imbalances in the industrial and social structure (International Monetary Fund [IMF], 1997).
One element of official policy should be highlighted, namely a series of policies to enhance the status and economic prosperity of the indigenous Malay community (the Bumiputras – ‘sons of the soil’) within the Chinese-dominated economy. The
authorities continue to favour Bumiputra entrepreneurs, although rigid targets and quotas are being replaced by a more flexible approach.
SMEs currently comprise 90% of total manufacturing establishments in the economy and account for 29.7% of total manufacturing employment (Malaysian Institute of Economic Research, 2000); they dominate productive activity in certain sectors, notably textiles, food, wood-based (furniture) and fabricated metal products.
However, there is no ‘legal or clear cut categorisation of what constitutes an SME in Malaysia’ (Mohd Asri, 2001: 183), and prominent activities of small firms in the service sector (e.g. in catering and the provision of domestic services) are not recognized in the official statistics (Hall, 2001).
SMEs rely heavily upon the banking sector for their external funding requirements at both the initial and expansion stages of development (Boocock and Wahab, 2001). The banking sector is dominated by a small number of domestic institutions
controlled by Government or quasi-governmental entities. These dominant banks have imposed a substantial risk premium on the cost of borrowing to this sector, typically 3–5% over bank lending rate (BLR), and they continue to place heavy reliance upon collateral to support SME lending (BNM, 2001b; Lin See Yan, 1994). For many years, therefore, BNM has published lending guidelines (effectively quotas) that force the banks to assist smaller enterprises; interest margins are also restricted. Penalties are imposed for non-compliance with these guidelines. However, the
imposition of such targets, particularly at pegged interest rates, can restrict the development of credit appraisal techniques in the private sector (Asian Development Bank [ADB], 1990).
The principal alternatives to bank finance are loans from finance companies or Government-sponsored bodies. Equity is less prominent. The formal venture capital market is still emerging and the Government supplies a large part of the investment pool; total venture capital investment was a modest RM130m (around £25m) in 2000 (BNM, 2001a). Informal risk capital has a long history within the Chinese community in Malaysia, although the operation of this market, as elsewhere, tends to be
somewhat opaque (Cowling et al., 2003). There is a general lack of knowledge
among SMEs about the funding opportunities available (Boocock and Wahab, 2001).
The CGC provides guarantee cover to SMEs in the general business, manufacturing and agricultural sectors. The Corporation has stated consistently that its goal is to assist smaller enterprises that need finance but lack collateral and/or a documented track record; within this overarching objective, a number of other aspirations have been stated, notably: ‘to bridge the gap between the needs of SMEs and the concerns of lenders by providing a commercially viable guarantee system that is adequately backed financially, thereby giving credence to its ability to fulfil the guarantee commitments’ (CGC, 1993: 13).
BNM and a consortium of commercial banks and finance companies own the CGC’s share capital. Despite this joint ownership, BNM has exerted a significant influence
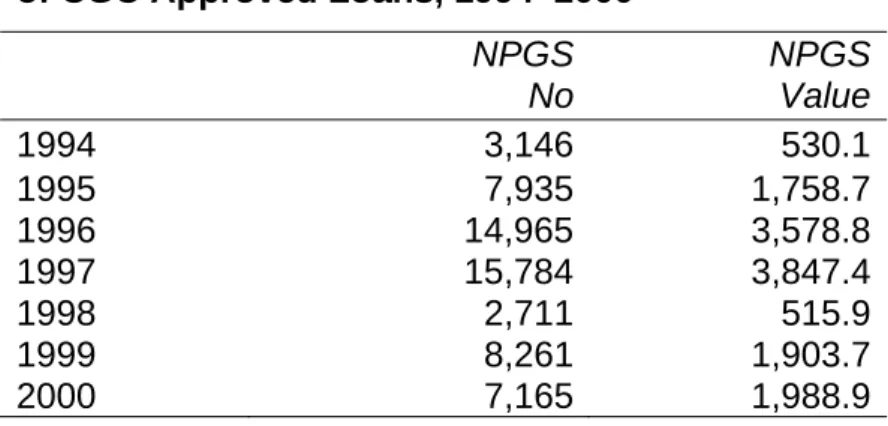
on its ‘partner’ institutions through the mechanism of the lending guidelines. Within the overall targets set for SME lending, a specified amount had to be undertaken under the CGC facilities. The Corporation’s main facility, the NPGS, superseded the ‘old’ Principal Guarantee Scheme in 1994 (see Table 1). The Scheme guaranteed 15,784 new loans in 1997, worth RM3.85bn. Utilization fell away sharply in the aftermath of the ‘Asian Crisis’, before recovering in 1999 and 2000.
Table 1. The Number and Value, RMm(1), of CGC Approved Loans, 1994–2000 NPGS NPGS No Value 1994 3,146 530.1 1995 7,935 1,758.7 1996 14,965 3,578.8 1997 15,784 3,847.4 1998 2,711 515.9 1999 8,261 1,903.7 2000 7,165 1,988.9
Source: Credit Guarantee Corporation
Note 1: RM: Malaysian Ringgitt. Average value, RM5.5/£, from 1994–2000.
The CGC assists firms with fewer than 150 employees and shareholders’ funds of less than RM5m (recently increased to RM10m). The NPGS covers between
70–90% of the value of the loan, with the higher guarantees being made available to borrowers operating in ‘priority’ sectors. Borrowers pay a guarantee fee of 0.5–1.0% of the loan amount, a modest amount by international standards. Over the period of this study, lenders were allowed to charge a maximum of 2% over BLR on
guaranteed loans. The total cost of Scheme loans (lending margin plus guarantee fee) thus compares favourably with the interest margin applied to ‘conventional’ bank loans for SMEs.
Key Issues in the Operation of Credit Guarantee Schemes
This section opens with an exploration of the reasons why SMEs might face market inequalities when raising funds. High transaction costs in relation to loan size are acknowledged to be a serious disincentive to bank lending (Levitsky, 1997b; Vogel and Adams, 1997). However, market imperfections are more commonly associated with information asymmetries. Stiglitz and others (Greenwald et al., 1984; Stiglitz and Weiss, 1981) demonstrated how such asymmetries could result in credit rationing. Under conditions of perfect information, each borrower would be charged an interest rate that reflects the risk involved in the proposition. In practice, banks raise interest rates for SMEs to a point where excess demand still exists and then fail to monitor lending effectively (Cowling and Mitchell, 2003; Tucker and Lean, 2001). Such action leads to adverse selection (good borrowers with viable low-risk projects will scale back their plans or delay them until internal resources are available, leaving the lender with a higher risk portfolio) and moral hazard (funds are diverted by borrowers to more risky projects).
The possibility of credit rationing is increased when banks insist on taking collateral from SMEs. Collateral acts as a substitute for information, limits the downside loss for the lender, and signals that the entrepreneur believes the project is likely to succeed (Berger and Udell, 1990; Stiglitz and Weiss, 1981). Yet, not all good quality borrowers can provide collateral (KPMG, 1999) and worthwhile proposals are turned away. Thakor (1989) suggested that the balance of evidence from the USA pointed to credit rationing, whereas Berger and Udell (1990) argued that this phenomenon was prevalent only where collateral was a prime concern of lenders.
The implication is that SMEs could encounter difficulties in gaining access to finance, even in mature financial markets. For example, Cowling and Mitchell (2003) claim that the LGS has overcome very real capital constraints for the majority of recipients. In the evolving financial system in Malaysia, credit rationing might be expected to be more widespread especially as Government actions (such as the imposition of lending quotas) may have exacerbated market imperfections (Boocock and Wahab, 2001). Measuring the extent of FA generated by a guarantee scheme is thus of critical concern.1
The initial (or ‘baseline’) FA is the net additional finance available to borrowers, after taking into account funds obtainable from other sources. Levitsky (1997a) concludes that some FA (usually 30–35%) exists in all guarantee schemes that are properly designed and implemented. Bannock and Partners (1997) emphasize that not less than 60% of loans should be additional, preferably nearer 80% or even 90%.
FUNDES, the Swiss-based international fund, claimed that 90% of borrowers on its guarantee scheme in Panama received additional funding (Oehring, 1996), whereas successive evaluations of the LGS achieved FA of 48% (NERA, 1990), 68% (Pieda, 1992) and 60% (KPMG, 1999).
If the factors associated with FA could be established, this would assist policy
makers to direct guaranteed funds to projects where FA is relatively high. In the UK, neither NERA (1990) nor KPMG (1999) could identify any one factor (location of firm, loan size and so on) that was a significant determinant of the incidence of FA.
Returning to the measurement of FA, some broader consequences are disregarded if evaluation is restricted to initial FA. Researchers have examined: the finance conditional upon receipt of the guaranteed funds – contingent finance (NERA, 1990); the impact of the recipients relying solely on conventional bank finance, termed ‘adjusted’ FA here (Pieda, 1992); other benefits to the borrower, such as the speed of access to finance (Levitsky, 1997b; Llisterri, 1997); and the extent of any
displacement (‘crowding out’) of potential borrowers (Oehring, 1996; Pieda, 1992). Some of these variants on initial FA were investigated, although methodological problems are encountered as additional evaluation criteria are added (Meyer and Nagarajan, 1997).
The measurement of FA is a prerequisite to any assessment of economic additionality (Curran, 1999; NERA, 1990). EA encompasses the impact of the guaranteed loans on the firms themselves (direct EA), and the wider benefits accruing from the activities of guarantee recipients (indirect EA), for example in generating exports that increase national wealth. Indirect EA also incorporates a guarantee scheme’s impact on entrepreneurial activity in the economy (Gibb, 1999).
(Magno and Meyer, 1988; NERA, 1990). However, it is very difficult to separate the influence of the guaranteed funds from a host of other factors that influence a firm’s performance (Meyer and Nagarajan, 1997). These methodological concerns are amplified when measuring indirect EA; researchers have to take into account, for example, the elasticity of demand for the product or service, the location of
competitors and the firm’s ability to move into export markets (Pieda, 1992). A key issue is ‘displacement’, where existing businesses are compelled to cut output or even cease trading because assisted firms capture their markets.
Indirect EA will tend to be higher for ‘innovative’ firms, although there is no agreed definition of innovation. Birchall et al. (1996) suggest that it covers the creation, development and introduction of new products and services, and the introduction of new processes. Within this broad framework, high technology firms (HTFs) form a sub-category characterized by heavy R & D expenditure (Butchart, 1987) or bringing radical, technology-based changes to a market (Harding, 2000). HTFs typically undertake high risk/high return projects. While the consensus of opinion is that HTFs are no more prone to failure than mainstream firms (Brierley, 2001), the former suffer financial constraints because investors are unable to differentiate with any degree of confidence between successes or failures (Westhead and Storey, 1997).
There are dangers in using guarantee schemes to plug funding gaps affecting innovative firms. Higher levels of FA and EA have been associated with an
increasing probability of default (Cruickshank, 2000; Levitsky, 1993; NERA, 1990; Pieda, 1992), and the risk profile of a portfolio of guaranteed borrowers can increase markedly when indirect EA is a prime objective (Riding, 1997). These findings
underline the link between additionality and sustainability.
To achieve sustainability, a guarantor has to be able to meet legitimate claims under the terms and conditions of the guarantee while preserving sufficient capital (Gudger, 1998). The guarantor also has to retain the confidence of lenders (Levitsky, 1997a) and ensure that the costs of operating a scheme are shared equitably (Riding, 1997; Vogel and Adams, 1997). Sustainability is close to being attained in some developed countries (Levitsky, 1997a), whereas the sustainability of the CGC has been called into question in the past (Bannock and Partners, 1997).
The research questions can now be summarized. The starting point is to examine the scale of ‘baseline’ FA generated by the NPGS, and to investigate the factors associated with this measure of FA. The article explores other constituents of FA, namely the level of contingent finance and how recipients would have fared in the absence of the Scheme. The study then seeks to establish the degree of EA (direct and indirect) originating from NPGS-backed firms. The final stage is an assessment of whether the CGC meets the criteria specified for sustainability.
Methodology
The researchers used a combination of a postal questionnaire survey, case studies compiled from semi-structured interviews with borrowers and their lenders, and discussions with key informants. The bulk of the empirical work for this article was undertaken between 1998–2000.
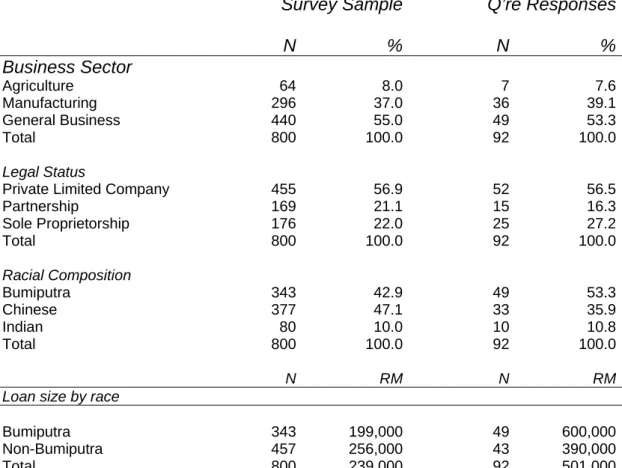
The questionnaire instrument was formulated by reference to previous evaluations of the LGS (NERA, 1990; Pieda, 1992). A later study (KPMG, 1999) adopted broadly the same methodology and proved helpful for comparative purposes. The CGC provided a complete list of NPGS borrowers in West Malaysia.2 All the guaranteed loans were granted before the onset of the Asian Crisis. From a total population of 36,200 recipients, a sample frame of 800 borrowers was selected to reflect the underlying population in terms of business sector, legal status, ethnic origin and loan amount (see Table 2).
Table 2. The NPGS Sample
Survey Sample Q’re Responses
N % N % Business Sector Agriculture 64 8.0 7 7.6 Manufacturing 296 37.0 36 39.1 General Business 440 55.0 49 53.3 Total 800 100.0 92 100.0 Legal Status
Private Limited Company 455 56.9 52 56.5
Partnership 169 21.1 15 16.3 Sole Proprietorship 176 22.0 25 27.2 Total 800 100.0 92 100.0 Racial Composition Bumiputra 343 42.9 49 53.3 Chinese 377 47.1 33 35.9 Indian 80 10.0 10 10.8 Total 800 100.0 92 100.0 N RM N RM
Loan size by race
Bumiputra 343 199,000 49 600,000
Non-Bumiputra 457 256,000 43 390,000
Total 800 239,000 92 501,000
Source: empirical work 1998–2000
A pre-test and pilot study of the survey instrument was conducted before the full-scale study was despatched in 1998. The questionnaire was available in three languages, English, Bahasa Malaysia and Mandarin. Follow-up letters were sent after three weeks. Fifty of the initial sample of 800 had to be rejected; some rural firms proved difficult for the postal authorities to locate, while others were duplicated on the CGC’s database. Usable responses were received from 92 firms (12.3% of the adjusted sample size). The problems associated with conducting research in a mixed-race, multilingual society should not be underestimated. It is relatively rare for SMEs in Malaysia to receive academic questionnaires, and there was a degree of suspicion concerning this document. A number of follow-up telephone calls revealed that potential respondents were reluctant to reveal any information on the financial aspects of the business, fearing that ‘the authorities’ would subsequently contact them. Given the length and complexity of the questionnaire, and the sensitive nature
of some questions, the response rate was judged to be acceptable (and comparable with those reported in postal surveys of SMEs in the developed world: Johnson et al., 1999; Westhead et al., 2001).
Table 2 reveals a close correspondence between sample frame (800) and questionnaire responses (92) in respect of business sector and legal status. The Chinese community proved less willing to participate than Bumiputras (confirming Chee, 1992). The average loan size in the sample frame was approximately RM240,000 whereas the corresponding figure for the respondents was just over RM500,000. The possible implications of race and loan size divergences for the study’s findings are explored later, along with the issue of response bias.
To supplement the questionnaire findings, and to avoid reliance on self-reported data, interviews were conducted with 15 firms (and their lenders) representing a range of manufacturing and service sectors.3 The racial balance was more equal than the questionnaire respondents, comprising seven firms each from the Bumiputra and Chinese communities, and one participant of Indian extraction. However, the average loan size was even higher at RM675,000.
The dual approach of questionnaires and case studies has been used elsewhere in evaluating guarantee schemes (Pieda, 1992; KPMG, 1999), but never in Malaysia. The ‘ideal’ number of case studies is largely judgemental, yet there is some
consensus that 20 is the maximum required and between two and ten is often
thought adequate (Bryman, 2001; Yin, 1994). Separate interviews with the firms and their bankers proved costly in terms of time and resources, but the discussions were vital to capture the complexities of the fund-raising process. Confidentiality was assured. Supporting documentation was obtained, where possible, to confirm the views expressed.
The calculation of baseline FA was based on the formula used in NERA (1990).4 The case studies were the primary source of information on FA, with the questionnaire responses used to reinforce key findings. The questionnaire data permitted some statistical analysis of the factors associated with initial FA. Respondents were split
into two groups, those with zero FA and the remainder with 100% or partial FA. Logistic regression was used to analyse the relationship between the incidence of FA (binary variable) and a number of factors (sector, legal status, ethnic background, collateral, firm size, loan size, etc).
Two variations on baseline FA were explored in this study. First, FA is enhanced where non-bank finance is contingent upon receiving the guaranteed loan. Over 30% of non-bank funds were classed as contingent in the most recent evaluation of the LGS (KPMG, 1999). This packaging of finance can be extremely important in the reduction of transaction costs and, potentially, information asymmetry. The second variant examines how recipients would have fared in the absence of the guarantee scheme (‘adjusted’ FA). Again, 60% of LGS-supported firms claimed that they would not have been in business, or would have struggled to survive, without the
guaranteed element of the funding (Pieda, 1992).
Once FA has been established, EA can be considered (NERA, 1990); this two-stage approach recognizes the concept of ‘deadweight’, by discounting the contributions of those firms that could have obtained loans from conventional sources (Curran, 1999).
In considering direct EA, the questionnaire responses gave some indication of changes in employment, profit and turnover over the 12 months since receipt of the guaranteed loan. The financial data were sometimes omitted, and some of the case study firms also proved reluctant to discuss financial information. As a consequence, most of the discussion is confined to jobs created, even though employment is only one input to the production or delivery process. Previous studies suggest that manufacturing firms produce more jobs, especially firms that invest in fixed assets (Boocock and Mohd Shariff, 1996; Cowling and Mitchell, 2003), and that larger firms generate more jobs than their very small counterparts (KPMG, 1999).
Key informants from the CGC confirmed their desire to promote indirect EA through increased innovation, exports and entrepreneurial activity. The problems of defining and measuring innovation were noted earlier. A broad definition of innovation is appropriate for an emerging nation like Malaysia where major technological
breakthroughs are rare.5 Our study thus defines ‘innovative’ firms as those developing a new product or service, or introducing new technology into the production or delivery process.
Even where proxies for EA can be identified, it would be a bold assertion that the guaranteed funds have been solely responsible for any changes in employment, innovation and so on. The Malaysian economy is evolving rapidly, and it is recognized that a host of internal and external drivers can affect small firms over even a short period of time (Curran, 1999). Methodological concerns of this nature are not unique to this study; previous researchers have found it almost impossible to measure the impact of a guarantee scheme with any degree of precision (Meyer and Nagarajan, 1997; Gudger, 1998).
One route to investigate whether NPGS borrowers generate more EA would have been to match a group of guarantee recipients with an equivalent cohort of
non-borrowers or non-guaranteed borrowers (Riding and Haines, 2001; Storey, 1999). This proved unworkable for two reasons. First, the varying motivations, constraints and uncertainties affecting smaller enterprises create problems in locating appropriate pairs of firms (Boocock and Anderson, 2003) and systematic biases can be introduced by ‘false’ matching (Lerner, 1999); such problems are compounded by the absence of any meaningful national database covering SMEs. Second, the terms of the Scheme are so beneficial, and the operation of the quota system is such, that a firm able to take advantage of NPGS-backing would do so. Moreover, as will become apparent, lenders direct borrowers to the Scheme for very different reasons. This makes it very difficult to construct a control group of
‘equivalent’ firms. As an alternative approach, therefore, employment figures for the SME sector as a whole were gathered from secondary sources and used for
benchmarking purposes.
Secondary data from the CGC’s Annual Reports were used to assess sustainability, despite the fact that information on non-performing loans and the payment of claims under the guarantees was sometimes lacking. Meyer and Nagarajan (1997) argue that many guarantee schemes across the developing world would be seen to have
failed if more complete information were made available. Key informants from the CGC were prepared to discuss sustainability both during the research programme and after the findings were made available to the Corporation.
Finance Additionality (FA)
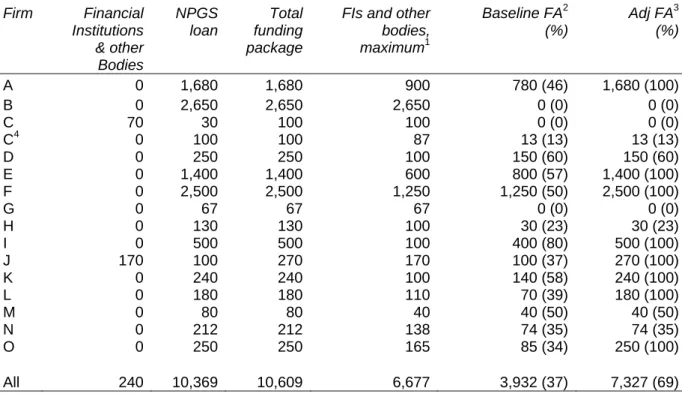
The baseline FA derived from the case studies (following the procedure in Note 4) is shown in Table 3.
Table 3. Finance Additionality – Case Studies (RM000s)
Firm Financial NPGS Total FIs and other Baseline FA2 Adj FA3
Institutions loan funding bodies, (%) (%)
& other package maximum1
Bodies A 0 1,680 1,680 900 780 (46) 1,680 (100) B 0 2,650 2,650 2,650 0 (0) 0 (0) C 70 30 100 100 0 (0) 0 (0) C4 0 100 100 87 13 (13) 13 (13) D 0 250 250 100 150 (60) 150 (60) E 0 1,400 1,400 600 800 (57) 1,400 (100) F 0 2,500 2,500 1,250 1,250 (50) 2,500 (100) G 0 67 67 67 0 (0) 0 (0) H 0 130 130 100 30 (23) 30 (23) I 0 500 500 100 400 (80) 500 (100) J 170 100 270 170 100 (37) 270 (100) K 0 240 240 100 140 (58) 240 (100) L 0 180 180 110 70 (39) 180 (100) M 0 80 80 40 40 (50) 40 (50) N 0 212 212 138 74 (35) 74 (35) O 0 250 250 165 85 (34) 250 (100) All 240 10,369 10,609 6,677 3,932 (37) 7,327 (69)
Source: empirical work 1998–2000 Notes 1
Maximum credit available from Financial Institutions and other (mainly Government) bodies, on the basis of interviews with borrowers and lenders.
2
Estimated level of FA, the ‘baseline’ calculation. 3
Adjusted FA – if the firm had been restricted to conventional bank finance. 4
Firm C received two NPGS-backed loans.
Two examples are worked through to demonstrate the calculations. Firm A
commenced operations in 1990 and was looking to expand substantially by 1995. On the basis of the collateral available, comprising property (approximate value,
RM1.0m), a debenture over fixed and floating assets, and joint and several guarantees from the directors, its bank was prepared to lend up to RM0.9m.
However, using the NPGS bolstered the collateral and allowed the bank to advance RM1.68m under the Scheme (46% FA). One year later, the bank was able to grant 2 non-NPGS loans, totalling RM5.6m, to provide additional working capital and further investment in productive capacity respectively. By then, Firm A had an experienced management team in place and a record of successful product innovation.
Firm B, a manufacturer and supplier of marine equipment, applied for an NPGS loan of RM2.65m in 1996. In this case, two government agencies could also have
provided the funds. Moreover, its bank was prepared to advance a conventional loan, viewing the company as well managed, with a sound track record and prospects. The NPGS was utilized because the borrowing would be marginally cheaper for Firm B and it contributed to the bank’s quota for NPGS loans. FA was therefore zero.
Overall, Table 3 shows that three firms experienced zero additionality; for the other 12 firms, FA ranged from 13% (Firm C) to 80% (Firm I). None of the case studies could be classed as 100% FA, and the average FA across all 15 firms was 37%.
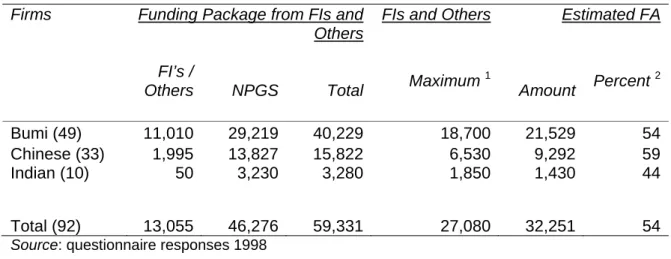
Summary data from the questionnaire responses are shown in Table 4. There is an element of double counting because the case studies are a sub-group of the 92 survey respondents. The NPGS-backed facilities (RM46.3m) accounted for 78% of the total funds made available (RM59.3m). However, the questionnaire respondents suggested that financial institutions or other bodies would have been able to
advance RM27.1m, rather than RM13.1m, reducing FA from 78% to 54%. The differing levels of FA from the two empirical sources are discussed below, after brief consideration of the determinants of FA.
Logistic regression analysis failed to find a single statistically significant factor linked to FA, in line with NERA (1990) and KPMG (1999). However, a bundle of factors (firm size, loan size and ethnic background) were significant at the five percent level. FA tended to be associated with Bumiputra and Chinese entrepreneurs, firms
statistical difference between Bumiputra and Chinese firms in relation to FA.6 The greater FA among smaller firms seeking to raise modest amounts could stem from a lack of awareness of other funding sources or insufficient collateral to raise
conventional bank loans.
Table 4. Finance Additionality – Questionnaire Summary (RM000s)
Firms Funding Package from FIs and
Others
FIs and Others Estimated FA
FI’s /
Others NPGS Total Maximum
1 Amount Percent 2 Bumi (49) 11,010 29,219 40,229 18,700 21,529 54 Chinese (33) 1,995 13,827 15,822 6,530 9,292 59 Indian (10) 50 3,230 3,280 1,850 1,430 44 Total (92) 13,055 46,276 59,331 27,080 32,251 54
Source: questionnaire responses 1998 Notes
1
Maximum credit available from FIs and other (mainly Government) bodies – respondents’ views only. 2
35 respondents claimed 100 percent FA; 42 respondents thought the Scheme contributed zero FA.
In selecting which measure of FA to utilize, the authors judged it essential to have separate endorsement of the borrowers’ ability to raise funds. Our interviews with lenders revealed that borrowers, irrespective of their size, understated the amount that could have been advanced through conventional bank loans. The difference in FA between questionnaires (54%) and case studies (37%) reflects this divergence of views. The FA from the questionnaires would probably have fallen to between
40–45% had the lenders’ views been taken into account.
The possible impact of response bias has to be acknowledged at this stage (Curran and Blackburn, 2001). The above-average loan sizes for questionnaire respondents and case study firms were noted earlier (although Table 3 shows that the figure for the case studies is inflated by four large loans). Analysis of the questionnaire data using ANOVA revealed that firm size was positively associated with the size of NPGS loans. It will be apparent that participants in our research programme will generally be larger than firms in the sample frame and population of guarantee
recipients. As larger, more established firms generally have a greater range of funding options, FA might be understated in this study.7
While the case study findings are thought to offer a more reliable measure of FA, response bias might help to explain why the figure of 37% is moderate by
international standards (Bannock and Partners, 1997; KPMG, 1999; Levitsky, 1997a; NERA, 1990; Oehring, 1996; Pieda, 1992).
The parameters of the guarantee scheme being assessed can also influence FA (Gibb, 2000). Some schemes force borrowers to pledge all available assets to secure conventional loans, leaving the guarantee to support ‘clean’ (unsecured) loans. In other countries, the government guarantees can be placed alongside other forms of collateral in support of a single loan. The CGC allows banks and finance companies to choose between these two options, but our survey revealed
widespread reluctance to use the NPGS in support of clean loans. The requirement for collateral was almost compulsory and hence logistic regression could find no link between this factor and the incidence of FA. Nonetheless, there is strong evidence from elsewhere that reliance upon collateral tends to depress additionality (NERA, 1990).
International comparisons are complicated further by variations in defining FA. In this study, baseline FA was extended to consider the level of contingent finance and how recipients might have progressed in the absence of the NPGS.
In our 15 case studies, contingent finance was nil. Firm C received a RM70,000 loan from a government body, but this was granted independently of the guarantee. The questionnaire responses confirmed that NPGS-backed facilities tend to substitute for, rather than complement, funding from other sources (confirming Boocock and
Wahab, 2001). Debt finance was predominant. Equity was rarely seen as an
acceptable alternative or complement to debt; only two of 92 respondents had issued equity as part of a funding package involving the NPGS.8 The Scheme does not appear to have reduced transaction costs or increased coordination between different funding sources.
If the Scheme had not existed, 8 of the 15 firms in Table 3 (A, E, F, I, J, K, L and O) could not, in the judgement of all parties, have completed their plans for capital investment or product development. Some might have been able to scale down expansion plans, but the position would certainly have been sub-optimal, and probably a threat to their survival. While it is impossible to establish with any certainty what the borrower and lender would have done in the absence of the guarantee scheme (Vogel and Adams, 1997), it is reasonable to regard the total
package of funds raised by those eight firms as additional (Pieda, 1992). Adjusted FA (final column of Table 3) amounts to 69%, compared to the initial calculation of 37%. This looks more acceptable, but equivalent data from other schemes are not available.
FA also encompasses other benefits to borrowers, including speedier access to loans, the availability of longer-term loans and access to preferential interest rates (Levitsky, 1997b; Llisterri, 1997). It was not feasible to evaluate fully each of these elements. Likewise, it was not possible to conduct a ‘full impact analysis’, i.e.
whether non-guaranteed borrowers are ‘crowded out’ or forced to pay higher interest rates (Pieda, 1992). This phenomenon is prevalent where banks come under
pressure to make guaranteed loans that yield lower net returns than standard loans (Oehring, 1996).
The BNM quotas exerted a pervasive influence during this study. It is interesting to note (Table 4, Note 2) that 35 questionnaire respondents claimed that the NPGS offered 100% FA, implying that lenders used the Scheme for ‘last resort’ borrowers. By contrast, 42 respondents thought that the Scheme contributed zero FA. The latter finding implies a substantial degree of crowding out; some bankers confirmed that they were tempted to offer NPGS loans to pre-selected customers until the target was attained. The influence of the quota is revisited later when reviewing
sustainability.
In evaluating FA for the NPGS, this article has made a number of contributions. The questionnaire data revealed, for the first time, the factors associated with FA. The interview programme allowed both borrowers and lenders to participate. The
baseline FA of 37% is below average by international standards, although it meets the minimum level of 30–35% suggested by Bannock and Partners (1997).
Response bias might understate the FA achieved by the Scheme, and the study also calls attention to other factors that tend to depress FA in Malaysia. First, guarantee recipients could often have raised funds from nonbank sources yet contingent
finance was minimal. Second, the banks’ reliance on collateral has probably diverted attention from FA. Third, and critically, the official targets relating to CGC-backed lending create market distortions. On a more positive note, the adjusted FA showed that the Scheme had provided essential support for a majority of recipients.
Economic Additionality (EA)
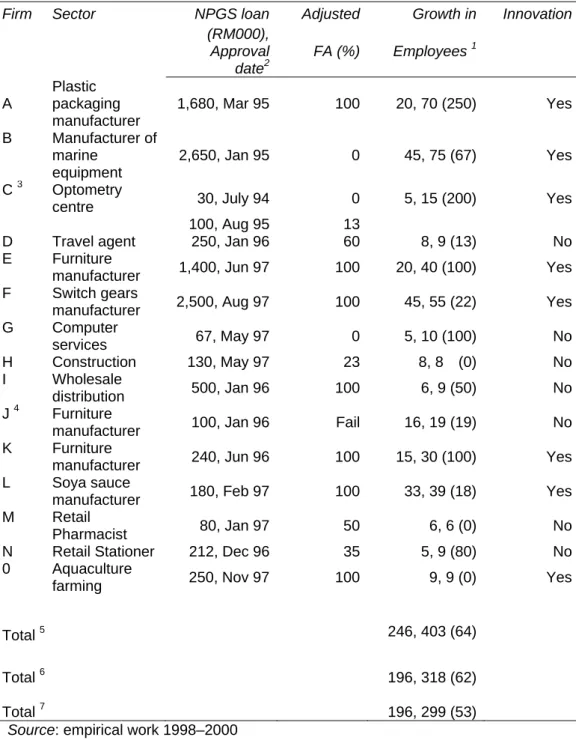
There were no firms with 100% baseline FA in the case studies. The authors
therefore took the pragmatic view adopted by Pieda (1992) and used adjusted FA as the trigger for EA (see Table 5).
The 7 surviving firms classified as 100% FA were included in the calculations, as were the firms with partial FA. The authors could have opted to scale down EA in line with FA, i.e. if a firm created 20 jobs and FA was 50%, then 10 jobs would be
included in the calculation of EA. This linear relationship would have been suspect, and the inclusion of the partial FA firms had no material effect on jobs created. The zero FA firms were excluded (Firm B had generated new 30 jobs). Firm J remained in business for over a year after receiving guaranteed funds then ceased trading; the jobs lost in this firm were deducted. Overall, the net increase in employment for qualifying firms in the 12 months after receiving Scheme loans was 103 jobs, an increase of over 50%.9
For the SME sector as a whole, employment grew at approximately the same rate as GDP (7–8%) in each of the calendar years over 1995–7; it then contracted by just 3% in 1998 despite the fact that GDP fell by over 7% (Department of Statistics, Malaysia, various).
Table 5. Economic Additionality
Firm Sector NPGS loan Adjusted Growth in Innovation
(RM000), Approval date2 FA (%) Employees 1 A Plastic packaging manufacturer 1,680, Mar 95 100 20, 70 (250) Yes B Manufacturer of marine equipment 2,650, Jan 95 0 45, 75 (67) Yes C 3 Optometry
centre 30, July 94 0 5, 15 (200) Yes
100, Aug 95 13
D Travel agent 250, Jan 96 60 8, 9 (13) No
E Furniture
manufacturer 1,400, Jun 97 100 20, 40 (100) Yes
F Switch gears
manufacturer 2,500, Aug 97 100 45, 55 (22) Yes
G Computer services 67, May 97 0 5, 10 (100) No H Construction 130, May 97 23 8, 8 (0) No I Wholesale distribution 500, Jan 96 100 6, 9 (50) No J 4 Furniture
manufacturer 100, Jan 96 Fail 16, 19 (19) No
K Furniture
manufacturer 240, Jun 96 100 15, 30 (100) Yes
L Soya sauce
manufacturer 180, Feb 97 100 33, 39 (18) Yes
M Retail
Pharmacist 80, Jan 97 50 6, 6 (0) No
N Retail Stationer 212, Dec 96 35 5, 9 (80) No
0 Aquaculture
farming 250, Nov 97 100 9, 9 (0) Yes
Total 5 246, 403 (64)
Total 6 196, 318 (62)
Total 7 196, 299 (53)
Source: empirical work 1998–2000 Notes:
1
Employment at start and after 12 months; percentage increase in brackets. 2
The NPGS was launched on 1 March 1994. 3
Firm C is included, and the analysis is based on the second loan. 4
Firm J’s loan was categorized as non-performing in June 1998. 5
Aggregate employment figures for all firms – no adjustments. 6
Aggregate employment figures, excluding those firms with zero FA. 7
Table 5 shows that case study firms typically achieved employment growth far in excess of GDP growth, even though two firms (A and E) were responsible for around half of the jobs created. It is notable that later recipients were usually able to
increase staff numbers despite the impact of the Asian Crisis; follow-up checks revealed that most participants survived the recession relatively unscathed. In relation to EA, therefore, response bias has probably overstated the impact of the NPGS.
The analysis above presupposes that job growth stems directly from Scheme finance. In reality, the level of employment in a firm is influenced by a variety of external and internal factors (Meyer and Nagarajan, 1997), including the sector in which it
operates and the purpose to which the funds are put. The seven manufacturing firms in the sample accounted for around 85% of jobs created. These firms benefited from larger loans, and the majority of them invested in plant and machinery. Production efficiencies were achieved, and strong demand from customers at home and abroad resulted in the recruitment of additional staff. Utilizing the guaranteed funds to ease working capital pressures seldom led to sustainable rises in employment and output (confirming Boocock and Mohd Shariff, 1996; Cowling and Mitchell, 2003).
Turning to consideration of indirect EA, the focus on job numbers does not capture supply-side improvements that affect a nation’s competitiveness, for example the introduction of new products and/or investment in new processes that can ‘add value’ to the wider economy. Displacement of economic activity was found to be high for firms engaged in general business, mainly retailers and construction companies. Manufacturing firms generally had a greater economic impact, especially the six classed as innovative in Table 5 (using the definition put forward earlier). Four of those six manufacturers export their products or offer substitutes for imports, while the other two produce high technology equipment for use by domestic firms.
From a broader perspective, the authorities in Malaysia see SMEs as offering: ‘an agility to adjust to the changing environment’ (BNM, 2001a: 8). Gibb (1999: 24) argues that assisting individuals or groups to start or develop a business forms ‘an intrinsic part of the flexible labour market and . . . [is] one of the best ways of
experiencing, learning and practicing enterprise’. Even if a large proportion of these new enterprises fail to survive, the economy should benefit in the long run from an increase in the stock of entrepreneurial experience. Our study does not address the longer-term impact of the NPGS in helping to increase enterprising activity.
To sum up this section, the nature and scale of EA varied considerably among NPGS recipients. The case study firms outperformed the SME sector by a considerable margin in terms of employment growth, although the research
methodology has probably overstated the impact of the Scheme. A number of NPGS recipients have generated indirect EA by investing in productive assets, moving into export markets and engaging in innovative activities. These growth-oriented firms should create wealth, produce additional tax receipts and enhance the
competitiveness of the nation. Some of the wider benefits of indirect EA were not assessed.
Sustainability
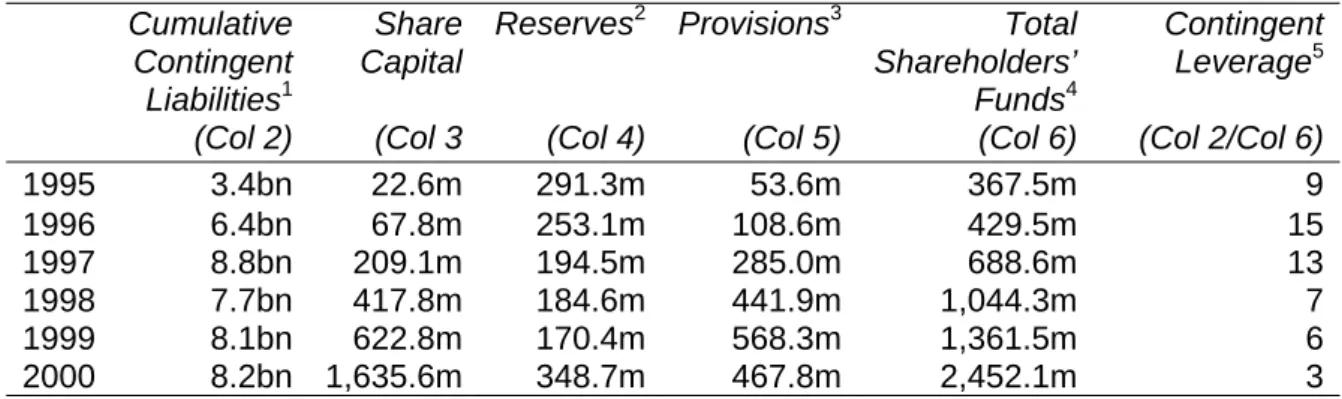
The CGC does not report separately on the net return/cost of operating the NPGS, but the Scheme exerts a crucial influence on the Corporation’s financial strength. Prominent trends are extracted from the CGC’s Annual Reports - see Tables 6 & 7.10
In Table 6 (overleaf), the leverage figure is a useful indicator of sustainability. Levitsky (1997a) suggests that contingent leverage of between 5–10 times can be achieved in a developed financial system, depending on the risk inherent in the loan portfolio and the confidence of lenders that guarantees will be honoured. However, breaching the upper limit for leverage usually reflects an undue haste to lend under the guarantee scheme (Levitsky, 1997b). This warning proved very pertinent in view of the rapid build-up in the CGC’s liabilities over 1996–7. Portfolio risk increased sharply after the Asian Crisis, and BNM was forced to inject substantial amounts of share capital to reduce leverage. The level of Provisions (loans classed as
non-performing and hence intended to be a reliable guide to potential losses) increased tenfold between 1995–9. The new share capital would have gone some way to restore the confidence of lenders in the CGC, provided that claims under the guarantee were settled (refer to Table 7).
Table 6. Contingent Liabilities and Shareholders’ Funds (RM), and ‘Leverage’
Cumulative Share Reserves2 Provisions3 Total Contingent
Contingent Capital Shareholders’ Leverage5
Liabilities1 Funds4
(Col 2) (Col 3 (Col 4) (Col 5) (Col 6) (Col 2/Col 6)
1995 3.4bn 22.6m 291.3m 53.6m 367.5m 9 1996 6.4bn 67.8m 253.1m 108.6m 429.5m 15 1997 8.8bn 209.1m 194.5m 285.0m 688.6m 13 1998 7.7bn 417.8m 184.6m 441.9m 1,044.3m 7 1999 8.1bn 622.8m 170.4m 568.3m 1,361.5m 6 2000 8.2bn 1,635.6m 348.7m 467.8m 2,452.1m 3
Source: Credit Guarantee Corporation Notes
1
Cumulative contingent liabilities in respect of the guaranteed portion of credit facilities extended by participating financial institutions.
2
Reserves comprise retained profit, and special reserves set aside to cover possible losses on the different guarantee schemes.
3
Specific provision for claims on loans classed as non-performing. 4
Total Shareholders’ Funds is the sum of Columns 3–5. 5
Contingent leverage is the ratio of cumulative contingent liabilities (Column 2) to total shareholders’ funds (Column 6).
Table 7. Claims Processed and Paid
Claims processed Claims paid Claims paid/ processed Number Col 2 Amount (RMm) Col 3 Number Col 4 Amount (RMm) Col 5
i.e. Col 5 / Col 3 (%) Col 6
1995 1,605 16.40 n/a 5.3 32.3
1996 n/a1 n/a 445 7.2 n/a
1997 314 29.1 n/a 7.6 26.1
1998 232 27.0 81 5.5 20.3
1999 1,492 591.6 283 22.6 3.8
2000 5,626 n/a 1,178 94.7 n/a
The CGC does not publish full data on the settlement of claims, but the data
available reveal some worrying trends. The ratio of claims paid to claims processed averaged a modest 6% over the period 1995–8. This pattern in meeting claims is not unprecedented (Boocock and Mohd Shariff, 1996). In the wake of the Asian Crisis, the lenders decided that many non-performing loans were never going to be repaid. This led to a huge increase in the number and amount of claims in 1999, yet a mere 3.8% of claims processed were settled. Claims paid rose to RM94.7m in 2000, but the value of claims processed was not revealed.
The shareholders’ funds would have been severely depleted if all claims processed had subsequently resulted in payments under the NPGS. Capital injections were essential. (If guarantee premiums had been increased to raise income, the likely outcome would have been adverse selection and the prospect of even more failures.) The lenders contend that failures are the unavoidable outcome of supporting SMEs in unfavourable economic circumstances and are adamant that the majority of claims over 1995–2000 were rejected or dragged out for spurious reasons. Confidence in the Scheme is low. Financial institutions also face additional implicit costs associated with operating a guarantee scheme (Riding, 1997; Vogel and Adams, 1997). In the case of Malaysia, lenders provide subsidized finance to the CGC and incur
substantial costs in complying with the terms and conditions of the Scheme, especially dealing with disputes over claims.
The weight of evidence is that the CGC has neither operated a commercially viable guarantee system over the period of this study, nor convinced the lenders that the costs of operating the NPGS have been shared equitably.
Officials from the Corporation argue that it is reasonable for financial institutions to contribute to ‘nation-building’ by bearing some of the costs of operating the Scheme. The informants also insist that claims are rejected only where lenders have not complied with the Corporation’s reporting requirements or shown poor judgement in selecting and/or monitoring borrowers. They maintain that the rejection of some claims is necessary to ensure that lenders are diligent in approving and monitoring loans (Bannock and Partners, 1997). Our findings on additionality can be used to assess the merits of these arguments.
The generation of FA and EA elsewhere has been positively associated with the probability of default (Cruickshank, 2000; NERA, 1990; Riding, 1997). For the NPGS, baseline FA is below average by international standards hence the high default rate is inconsistent, even though the EA generated by the Scheme means that some failures would be anticipated. The official targets for Scheme lending have
contributed to moderate FA. Lenders direct ‘last resort’ borrowers to the NPGS to satisfy the guidelines and switch ‘safe’ borrowers for the same reason. The former course of action would be expected to increase FA and default rates, while latter should lead to the opposite outcome. However, the level of defaults experienced implies that many borrowers perceived as ‘safe’ must subsequently have failed.
While this finding lends support to the CGC’s view that many defaults stem from a lack of expertise in credit appraisal and management, the authors would argue that the present operation of the NPGS and the wider thrust of Government policy in financial markets have served to restrict the development of credit assessment skills. These issues are addressed in the following section.
Recommendations
The dividing line between legitimate banking activity and reckless lending is hard to establish, especially in an evolving financial market characterized by inefficiencies. Stiglitz and Weiss (1981) pointed to the possibility of credit rationing and the multiple equilibrium solution in such markets. The key problem is locating an acceptable
risk/return frontier at which the NPGS could operate; this cannot be an exact science. In the light of the findings presented here, the authors propose an integrated
package of measures designed to build on the positive outcomes of the NPGS but enhance its effectiveness in other areas.
1. Finance Additionality
Lenders can utilize the NPGS in support of either ‘clean’ loans or borrowing backed by collateral and the CGC guarantee. The latter option reinforces the current reliance upon collateral. The authors propose that lenders should offer conventional loans to the limit of available collateral (business and/or personal), with the NPGS being used
solely to support ‘top-up’, clean loans. Smaller firms seeking modest loans should still be able to access the Scheme, thus maintaining FA.11 Larger firms requiring more substantial sums will normally have some collateral to support conventional loans, and the NPGS would provide the final element of a funding package.
Likewise, the Scheme should, ideally, be denied to firms able to raise funds from non-bank sources. Any proposal to restrict the use of the NPGS in such
circumstances would improve FA, but would be difficult to police. It is the role of the firm rather than the credit analyst to determine financing alternatives, and a firm may not wish to disclose all its funding avenues. Our study reveals that contingent FA for the Scheme is very low. This implies that many sources of funding (especially loans from Government bodies) are offered to the SME sector as a whole, without taking into account the risks associated with individual propositions – this issue is taken up below in the context of EA.
The quota system for CGC lending has resulted in market distortions. It is pleasing to note that formal targets are being phased out and replaced by a more flexible system whereby the authorities publish ‘desired’ levels of SME and CGC lending. There are no penalties for non-compliance, although BNM still seeks assurances that the required levels of lending will be achieved. Another welcome step was the abolition (in late 2002) of the ‘cap’ of two percent over BLR on NPGS loans; lenders can now set rates commensurate with the degree of risk inherent in each proposition. There is a danger that lenders will raise interest rates for all Scheme borrowers, resulting in adverse selection. However, the changes should reduce the anomalies previously associated with the selection of guarantee recipients, notably where borrowers were directed to the NPGS simply to take advantage of lower interest rates. Even so, the retention of ‘softer’ targets might preserve some distortions hence the authors urge the authorities to be decisive and to abolish any targets for Scheme lending. The lenders should now receive a commercial return on Scheme lending, with the risks underpinned by the guarantee. The terms of the Scheme should reflect this change of emphasis. The guaranteed portion of the loan is currently set at 90% for ‘priority’ borrowers, a figure that tends to result in adverse selection and moral hazard (Levitsky and Doran, 1997). The authors propose that the guarantee be
restricted to 80%. This move should discourage lenders from supporting firms with precarious hopes of survival, and signal that the Scheme does not simply provide cheap credit for politically important groups (Gudger, 1998).
2. Economic Additionality
It is not straightforward to formulate proposals to enhance EA, whether direct or indirect. If the aim of the NPGS were solely to increase employment in the SME sector, our study suggests that guarantees should be focused on established, growth-oriented manufacturing firms that invest in fixed assets. However, restricting the Scheme to such firms would ignore the potential of start-up and younger firms to become viable businesses and contribute to the wider economy.12
The NPGS supports some borrowers that largely displace economic activity from local competitors, notably retailers and construction firms. The authors favour the exclusion of these categories, a move that would be relatively easy to implement. It is more difficult to specify sectors that should be supported by the Scheme. The SME sector is characterized by its heterogeneity and a variety of firms, not confined to the manufacturing sector, are generating indirect EA. The evolving economy of Malaysia offers great scope for smaller enterprises to thrive. However, lenders should be broadly unconcerned by the potential of firms to generate benefits for the nation. These two issues cannot always be separated. The successful introduction of (say) a new product will enable a firm to repay the loan and enhance national wealth yet lending decisions must be based solidly on repayment capability.
Lenders might benefit from the introduction of independent bodies to assist them with the appraisal of technology-based projects. However, lenders would retain the right to turn down a proposition, even if its technical feasibility looks promising. Policy makers have to accept that the NPGS (or loans from other Government bodies) will rarely be suitable for financing (say) an SME undertaking a high risk/return
biotechnology project. If the Government desires to support HTFs engaged in such activities, then grants or equity are probably more suitable funding instruments.
social inclusiveness by giving people the opportunity to start and develop their own businesses, such objectives must be made explicit and backed by adequate
resources to meet claims under the guarantees should those fledgling businesses fail.
3. Sustainability
The recommendations to restrict the Scheme to ‘top-up’ loans and abolish the quota system should boost FA by excluding borrowers that qualify for conventional loans. It is evident that genuinely additional loans carry a high probability of failure (NERA, 1990; Pieda, 1992) yet any further threat to sustain-ability is reduced because lenders will no longer feel obliged to support firms with few prospects of survival, simply to meet targets. In relation to economic additionality, the removal of sectors with high displacement should enhance EA, and thereby increase the portfolio risk (Cruickshank, 2000; Riding, 1997), but this would be countered by the exclusion of some high risk/return projects if lenders were to set aside the pursuit of indirect EA.
Compared to the present situation, the authors judge that the package of proposals above (and the changes being implemented) would enhance FA while retaining most of the EA generated by the Scheme. The analysis above suggests that the impact of our proposals on the portfolio risk of NPGS borrowers is debatable. It will be
appreciated that other factors affect the number of failures incurred, for example Scheme utilization and the quality of lending decisions,13 and that sustainability also encompasses the relationship between guarantee body and lenders.
There will be a period of transition while the new arrangements take effect. The removal of the cap on interest margins should encourage lenders to participate, but the abolition of the official guidelines means the number of Scheme loans will almost certainly fall in the short term. Our study demonstrates that it would be unrealistic to assume the NPGS will become self-financing in the foreseeable future. Viable propositions will therefore be turned away unless lenders are convinced that losses will be shared equitably. The CGC should admit to past shortcomings, and work with the lenders to restore confidence and credibility in the claims procedure.
The heavy reliance upon collateral, the imposition of quotas and the availability of alternative sources of finance may all have restricted the development of credit assessment skills in the banks and finance companies. Over time, a process of market-led adjustment and deregulation, and an injection of foreign expertise, should reduce the incidence of market failure, enhance the quality of lending decisions and enable the NPGS to play a significant role at a revised risk/return frontier.
Conclusions
In order to capture the benefits associated with a vibrant SME sector, governments are increasingly utilizing credit guarantee schemes. This article fills a gap in the academic literature for developing countries by reviewing the operation of the NPGS in Malaysia. Using a variety of research methods and drawing upon primary and secondary sources, the authors investigated whether the CGC has achieved its objectives of generating FA and EA without sacrificing sustainability. The findings have to be considered in the light of the methodological concerns raised and in the context of the prevailing economic, social and political factors. Nonetheless, there is sufficient evidence that the Scheme has failed to meet all the objectives sought by the Corporation.
While there are a number of positive outcomes (especially in relation to EA),
baseline FA is below average, there have been high rates of default and the lenders have borne a substantial portion of the losses incurred. The lenders would surely support Meyer and Nagarajan (1997: 79) in their contention that: ‘. . . the burden of proof that this type of intervention into financial markets is cost effective and
sustainable clearly rests on the shoulders of its advocates. So far, they have not made the case.’
The recommendations in this article, together with changes already being
implemented, comprise an integrated package of measures designed to build on the positive outcomes of the Scheme, enhance its effectiveness in other areas and strengthen the case for its retention. However, it will take time and require radical changes in the mindset of the CGC, lenders and policy makers before Scheme
utilization attains an equilibrium that is acceptable to all parties. There have to be realistic expectations about what the Scheme can achieve, and changes in the operation of the Scheme have to go hand in hand with measures to make the financial markets more efficient.
Our proposals are based on the special circumstances prevailing in Malaysia but the findings of this study might also prove useful for policy makers involved in the design and operation of guarantee schemes in other developing countries. Apart from the general comments in the preceding paragraph, the study illustrates, for example, the dangers of using quota systems in evolving financial markets, the importance of maintaining good relationships with the lenders, and the need to ensure that a guarantee scheme does not duplicate other forms of government assistance.
Notes
1. The question of whether credit guarantee schemes are the most effective
mechanism for correcting market imperfections is set aside (Camino and Cardone, 1999; Mensah, 1996). Vogel and Adams (1997) acknowledge that researchers might have to accept policy makers’ preferences as given, then ask whether guarantees add to the credit available. The authors strongly endorse this view.
2. East Malaysia is much less developed, with far fewer industrial and commercial companies.
3. The case study firms were chosen from questionnaire respondents who had indicated their willingness to participate in follow-up interviews; a minority of those selected had to be replaced with similar firms because their bankers declined to be interviewed.
4. Additionality at the level of the firm is calculated as:
Additionality (percent) = A + C – B x 100 A
Where:
A = NPGS finance raised
B = Alternative finance that could have been raised
C = Finance raised at the same time as the NPGS finance
It should be noted that the formula gives 100 percent additionality if C equals B, or where C and B are both nil. At the other extreme, additionality is zero if (C + A) = B.
5. The Government has designated a somewhat eclectic mix of activities as ‘priority’ sectors that qualify for favoured treatment. At one extreme, they cover HTFs
operating in sectors such as biotechnology; at the other, priority status is accorded to firms that utilize new technology in more conventional sectors, for example food processing. These categories are interpreted very flexibly. This inclusive approach is reflected in our definition of ‘innovative’ firms.
6. If the questionnaire data had been weighted to reflect the ethnic balance in the sample frame, the impact on FA would have been minimal.
7. It should be noted that some of the larger Scheme loans had generated
substantial levels of FA, as the gap widens between the amounts that could have been raised from alternative sources and the total funding sought.
8. Some of the remainder could have approached venture funds, but feared a loss of control and/or were not prepared to accept perceived low valuations imposed by fund managers.
9. For the questionnaire respondents, total employees rose by around 46%. This figure for EA can only be illustrative, at best, in the absence of any adjustments for failed firms or those where FA was not present.
10. BNM and a consortium of commercial banks and finance companies own the share capital of CGC, and supply funds at subsidized rates; the Corporation typically generates over 60% of its annual revenue from interest received on term deposits, and interest arbitrage on investing the funds. Reserves consist of retained profit derived from the income (profit and loss) statements and ‘special reserves’. After meeting operating expenses, revenue is used: to build up special reserves – the sum earned each year from interest arbitrage is set aside to meet losses on the different guarantee schemes; and, to make further transfers to Provisions when defaults run at a high level (for example, in both 1998 and 1999 following the Asian Crisis). Any residual ‘profit’ is retained. The separate liability for Provisions is set aside to cover potential claims arising from loans classed as non-performing under BNM
regulations. The CGC makes transfers from special reserves to Provisions, plus additional transfers from the income statement as and when necessary.
11. The CGC should also investigate why firms owned by the minority Indian community (10% of the population) are not associated with FA.
12. The monitoring of EA has been weak or non-existent. It is expensive to collect data, and it increases transaction costs for the lenders. Nevertheless, there has to be mutual acceptance that it would be beneficial to gather performance indicators from a selection of Scheme borrowers. This would enable benchmark growth rates to be formulated for employment, sales and profits. The data would enable lenders to monitor the progress of borrowers, and assist in future evaluations of the Scheme.
13. Economic circumstances obviously influence failure rates, but the focus here is on factors within the control of the guarantee body, lenders and policy makers.
REFERENCES
Asian Development Bank (ADB) (1990) ‘A Study of SMEs with Special Reference to Technology Development’, Staff Working Paper, April. Manila: Asian
Development Bank Programmes Department (East).
Bank Negara Malaysia (2001a) Annual Report. Kuala Lumpur: BNM.
Bank Negara Malaysia (2001b) Financial Sector Masterplan. Kuala Lumpur: BNM. Bannock and Partners (1997) Credit Guarantee Schemes for Small Business
Lending: A Global Perspective. London: Graham Bannock and Partners. Berger and Udell (1990) ‘Collateral, Loan Quality and Bank Risk’, Journal of
Monetary Economics 25(1): 21–42.
Birchall, D. W., Chanaron, J. J. and Soderquist, K. (1996), ‘Managing Innovations in SMEs: A Comparison of Companies in the UK, France and Portugal’,
International Journal of Technology Management 12(3): 291–305.
Boocock, J. G. and Anderson, V. A. (2003) ‘International Business and UK Small and Medium-Sized Enterprises: Rationales, Routes, Readiness, Role of
Government Support, and Reflections’, International Journal of Entrepreneurship and Innovation 4(2): 97–111.
Boocock, J. G. and Mohd Shariff, M. N. (1996) ‘Loan Guarantee Schemes for SMEs: the Experience of Malaysia’, Small Enterprise Development 7(2): 25–36. Boocock, J. G. and Wahab, I. A. (2001) ‘The Financing of Small Firms: Different
Continents, The Same Problems?’, New England Journal of Entrepreneurship
4(2): 13–31.
Brierley, P. (2001) ‘The Financing of Technology-based Small Firms: A Literature Review’, Bank of England Quarterly Review 41(1): 64–83.
Bryman, A. (2001) Social Research Methods. Oxford: Oxford University Press. Butchart, R. L. (1987) ‘A New UK Definition of High Technology Industries’,
Economic Trends 400: 82–8.
Camino, D. and Cardone, C. (1999) ‘The Valuation and Cost of Credit Insurance Schemes for SMEs: The Role of Loan Guarantee Organisations’, International Small Business Journal 17(4): 13–31.
Chee Peng Lim (1992) ‘Potential and Problems of SMI’, in Seung Jin and Suh Jang Won (eds) Cooperation in Small and Medium-Scale Industries in Asean, pp. 29–51. Kuala Lumpur: Asian and Pacific Development Centre.