Does EVA performance evaluation improve
the value of cash holdings? Evidence from China
Yongjian Shen
a,⇑, Lei Zou
b, Donghua Chen
ba
School of Accounting, Nanjing University of Finance and Economics, China
b
School of Business, Nanjing University, China
A R T I C L E I N F O
Article history:
Received 28 May 2013 Accepted 29 January 2015 Available online 11 March 2015
Keywords:
EVA
Performance evaluation The value of cash holdings Overinvestment
Investor protection
A B S T R A C T
This paper investigates the influence of the economic value added (EVA) per-formance evaluation, issued in 2010 by the State-owned Assets Supervision and Administration Commission of the State Council, on the value of the cash holdings of central state-owned enterprises (CSOEs). We find that EVA per-formance evaluation has some influence on the overinvestment of CSOE cash holdings and significantly increases the value of CSOE cash holdings compared with the cash holdings of local state-owned enterprises. The greater value of CSOE cash holdings derives from underinvestment modification and overin-vestment restraint. The value of cash holdings increases more for companies with better accounting performance. Thus, the EVA performance evaluation policy increases CSOE efficiency. This study contributes to the emerging lit-erature related to cash holdings and the economic consequences of the EVA performance evaluation policy. It expands the literature related to investor protection in countries experiencing economic transition.
Ó2015 Sun Yat-sen University. Production and hosting by B.V. This is an open access article under the CC BY-NC-ND license (http://creativecommons. org/licenses/by-nc-nd/4.0/).
1. Introduction
Jensen and Meckling (1976) find that managers routinely waste their firm’s cash for personal benefit. Furthermore, Jensen (1986)observes that managers hold on to excess cash for personal benefit. These argu-ments have been widely cited in the domestic and overseas literature. Due to the separation of ownership and control, managers often consume corporate cash to maximize their own benefits or act in a way that fails to maximize the benefits of stockholders. The agency costs resulting from the separation of ownership and
http://dx.doi.org/10.1016/j.cjar.2015.01.004
1755-3091/Ó2015 Sun Yat-sen University. Production and hosting by B.V.
This is an open access article under the CC BY-NC-ND license (http://creativecommons.org/licenses/by-nc-nd/4.0/).
⇑Corresponding author.
E-mail address:[email protected](Y. Shen).
H O S T E D BY Contents lists available atScienceDirect
China Journal of Accounting Research
control rights may be more serious in state-owned enterprises (SOEs) in China due to a lack of individual shareholders. The consumption of cash is likely to be an important component of agency costs.
Cash is very important to the management and operation of a corporation. Cash holdings provide money to meet the daily needs of a corporation and decrease financial risk. In addition, a firm’s value rises when its cash is invested. Compared with other kinds of assets, cash is a form of profit and can be easily transformed into a personal benefit at a lower cost (Myers and Rajan, 1998). Given the separation of ownership and con-trol, inside managers can affect the decisions made in relation to cash holdings via residual control. They hold more cash and accept projects that are harmful to shareholder interests, which decreases the value of the cash holdings and decreases their firm’s market value to a point lower than book value (Jensen, 1986).
There are two factors that affect the value of cash holdings. The first is financial characteristics, including financing constraints, growth opportunities and investment opportunities. A firm’s level of cash holdings affects its market value, which increases as cash holdings rise. The connection becomes stronger if a firm faces better growth opportunities (Saddour, 2006). In theory, a shareholder believes that $1 of a firm’s cash holdings is equivalent to its book value. However, for a firm with better investment opportunities, a premium exists in its cash holdings (Pinkowitz and Williamson, 2007). The second factor is corporate governance. The effective-ness of a firm’s corporate governance reflects the market value of its cash holdings, which in turn influence the firm’s value. Firms with good corporate governance enjoy twice the cash market value of firms with poor cor-porate governance. The negative effect on operating performance resulting from holding large amounts of cash is suppressed in firms with good corporate governance (Pinkowitz et al., 2006; Dittmar and Jan, 2007).
Agency problems are common and agency costs decrease the value of cash holdings. Therefore, managers who restrain their self-interest may significantly increase the value of their firm’s cash holdings. When dis-cussing how manager’s performance evaluations influence the value of their firm’s cash holdings, it should be made clear that appropriate evaluation is the premise for encouraging managers to increase the service effi-ciency of their funds. Choosing a core performance evaluation index is the key point in a manager perfor-mance evaluation system. When a manager’s income is positively related to the perforperfor-mance of his or her firm, economic value added (EVA) can operate as a performance evaluation index that encourages managers to make efficient investment decisions that raise the value of their firms (Rogerson, 1997). In addition, when EVA is included in a manager’s compensation incentives, that manager will cut down financing decisions out of self-interest, which has little effect on any increase in firm value (Stern and Stewart, 2004). This paper con-siders whether an effective manager performance evaluation system decreases agency costs and improves the value of a firm’s cash holdings.
Given China’s unique institutional background, central SOEs (CSOEs) play an important role in economic growth and the development of a healthy securities market. Although CSOEs have undergone many reforms, many problems remain unsolved. For a long time, CSOEs failed to focus on their main businesses, electing instead to pursue large-scale projects and lowering the efficiency of their funds as a result. To correct this development pattern and protect small investors, the State-owned Assets Supervision and Administration
Commission (SASAC) of the State Council issued itsInterim Measures for Business Performance Appraisals
of Persons-in-Charge at Central Enterprises in 2010. Since then, the performance of CSOE heads has been evaluated based on the EVA index.
The main change in this regulation was the use of EVA. EVA comprises 40% of the core index of return of assets. The key point in manager performance evaluations therefore changed from profit to value, forcing CSOEs to focus on value management rather than strategic management. In addition to total profits, capital efficiency is an important factor influencing EVA. In short, EVA value, which represents the value of a firm, grows as the firm’s capital efficiency improves. The wise management of capital, achieved by decreasing the cost of occupied capital and improving the efficiency of used capital, is an important approach to improving
firm value. Meanwhile, as mentioned in the Notice on accomplishing the financial budget management and
preparation of statement work at central enterprisesin 2013, CSOEs are required to stick to the rule that cash is king in budget management, highlighting the importance of capital management. This regulation asks CSOEs to put cash management first, detail their capital budgets and arrange their financial resources effi-ciently. In a macro-policy setting, we research cash holdings in CSOEs from an EVA perspective of value cre-ation. The relationship between EVA and cash holdings in CSOEs is readily apparent. Furthermore, it would
be helpful to explore the intention behind the policy and analyze the association between value creation and cash holdings in CSOEs.
The literature related to the value of cash holdings has focused mainly on financial characteristics, corpo-rate governance and financial constraints. These aspects are representative of a firm’s internal or external envi-ronment. Exploring the factors that influence the value of cash holdings from internal or external environment perspectives reveals their systematic nature and comparability. The sample in this study consists of listed com-panies that are controlled by CSOEs and matched with local SOEs (LSOEs). The SASAC chose EVA as its index to evaluate the performance of the heads of CSOEs. Combining our sample with this policy context, we research the influence of EVA on the value of CSOE cash holdings. We also try to reveal the intention behind the policy and determine whether it works according to the information we acquire.
This paper makes the following contributions. First, in terms of the EVA evaluation index, whether the heads of CSOEs change their previous management theory to create firm value remains unknown. Because cash has the highest liquidity in a firm, this paper pays attention to factors that affect cash value. It helps to clarify the connection between EVA and the value of cash holdings and provides a theoretical basis and tests for the effect of the policy.
Second, this paper tests the economic consequences of EVA evaluation carried out in CSOEs from a cash holdings perspective. It enriches the literature related to the value of cash holdings while connecting it with the EVA literature.
Third, this paper can be broadly classified as a study of corporate governance and the value of cash hold-ings. It analyzes how the EVA evaluation index influences the value of cash holdings in detail and therefore extends the literature in that field.
The following features may enhance the validity of our research beyond the contributions just mentioned. First, firms in China can be divided into several classes according to administrative level, such as enterprises of the central government, enterprises of provinces or ministries, enterprises of prefectures or departments and enterprises of counties or divisions. The higher the administrative level of a firm, the stronger its influence on the Chinese macro-economy. CSOEs are crucial participants and their operating efficiency plays an important role in this macro-economy. Second, investors in the Chinese stock market are widely considered to be poorly protected. According to the EVA evaluation index, corporate governance can ensure better investor protec-tion. It not only improves the level of investor protection in the Chinese market, but also provides an empirical reference for other emerging markets.
The rest of this paper is arranged as follows. Section2contains the literature review. Section3reveals the institutional background, theoretical analysis and research hypotheses. Section4presents the research design, including the sample selection, model design and variable definitions. Section5describes the descriptive statis-tics. Section6reports the empirical test results. Section7offers a conclusion and presents the limitations of the paper.
2. Literature review
This paper focuses on cash, the value of cash holdings and EVA performance evaluation. In this section, we review the literature related to cash holdings and EVA performance evaluation.
2.1. Cash holdings and the value of holdings
Studies of cash holdings and their value have an important position in corporate finance. The scale of cash holdings and efficiency of cash use play important roles in a firm’s value because cash is a firm’s most essential liquid asset. Bates et al. (2009)classify the reasons why firms hold cash into three motives. The first is the
transaction motive. John (1993) and Opler et al. (1999) find that cash holdings affect a firm’s Tobin Q,
R&D ratio, advertising expenditures, capital expenditures, scale, debt ratios, cash-to-cash cycles and cash flows.Kim et al. (1998)models a firm’s investment decisions on its liquid assets and discovers that the optimal amount of liquidity is determined by a tradeoff between the low return of liquid assets and the benefit of decreasing the need for costly external financing. Opler et al. (1999)find that the firms with the best access to capital markets, such as large firms and firms with higher credit ratings, tend to hold lower ratios of cash
to total non-cash assets. The research has also shown that firms that do well tend to hold more cash than pre-dicted by the static tradeoff model, in which managers maximize shareholder wealth.
The second motive is the precautionary motive. According toOpler et al. (1999), firms are expected to hold more cash when they are short on cash flow or find it difficult to obtain external capital, as they incur higher costs if their financial conditions worsen.Almeida et al. (2004)find that financially constrained firms tend to invest in cash assets and that the opposite is true for unconstrained firms.Han and Qiu (2007)argue that the cash holdings of financially constrained firms are positively related to cash flow volatility, providing evidence for the precautionary motive for a firm’s cash holdings.Acharya et al. (2012) conclude that the correlation between cash holdings and credit risk is robustly positive. This puzzling finding can be explained by the pre-cautionary motive for saving cash.
The third motive is the agency motive.Jensen (1986)finds that in firms lacking investment opportunities, managers who are motivated by tunneling prefer to keep cash in their firms rather than pay dividends to inves-tors. In terms of investor protection (Dittmar et al., 2003), evidence has shown that firms in countries where investor rights are poorly protected hold up to twice as much cash as those with good investor protection. In addition, when investor protection is poor, the factors that generally drive the need for cash holdings, such as
investment opportunities and asymmetric information, become less important.Dittmar and Jan (2007) and
Pinkowitz et al. (2006) find that serious agency problems devalue firms’ cash holdings. Evidence from Dittmar and Jan (2007) and Harford et al. (2008) shows that managers who are motivated by tunneling are inclined to set up an equilibrium of excess cash holdings and are always good at consuming excess cash. Nikolov and Whited (2011)discover that the agency problem of perquisite consumption is better than firm size at explaining a cash holdings equilibrium and that the agency problem of firm size is better at explaining firm value.Liu and Mauer (2011)find that risk premiums are positively related to cash holdings but negatively related to the value of cash holdings.
Other scholars have researched cash holdings in different ways.Chen et al. (2012)find that cash holdings in the Chinese stock market decrease after the split-share reform. This appears to be more significant for firms with poorer corporate governance and stronger financial constraints. Based on questionnaires posted to CFOs in 29 countries,Lin et al. (2010)conclude that a line of credit is the key point influencing financial liquidity. Scholars also make contributions to the value of cash holdings.Faulkender and Wang (2006)test abnormal stock returns in different fiscal years. They consider the marginal value of cash declines given more cash hold-ings, higher financial leverage and easier access to the capital market. Cash dividends also decrease the mar-ginal value compared with stock repurchases. Some research has determined the average cash value in all firms to be $0.94. In theory, shareholders estimate that $1 in cash is equal to its book value. However, cash holdings in firms with better investment opportunities enjoy a premium (Pinkowitz and Williamson, 2007), meaning that $1 in cash is worth more than its book value. The opposite is also true. Many researchers have focused on how corporate governance influences the value of cash holdings. Agency theory argues that cash value is lower in countries in which investor protection is poor, as controlling shareholders are more likely to benefit from cash assets. In response to this theory,Pinkowitz et al. (2006)believe that the relationship between cash holdings and firm value is weaker in countries with poorer investor protection. Firms with poor corporate gov-ernance hold less cash because managers tend to consume cash more quickly rather than keep it in case of financial crisis (Harford et al., 2008).Dittmar and Jan (2007) find that $1 in cash in poorly governed firms ranges from only $0.42 to $0.88 in value. However, the amount rises to $2 in well-governed firms. Moreover, when a firm’s corporate governance is poor, it is easier for managers to waste cash on projects that do obvious damage to the firm’s value.
Scholars in China have also devoted themselves to such research.Zhang and Wu (2006)conclude that the
relation between cash and cash flow sensitivity is significantly positive in Chinese firms regardless of whether they face financial constraints. Under the economic conditions in China, better corporate governance lowers cash holdings (Xin and Xu, 2006). In terms of local government governance, firms positioned in areas in which the local government is properly governed hold less cash (Chen et al., 2011). In terms of agency problems, agency costs play a role in the following relationship (Jiang and Bi, 2006). When agency costs are high, excess cash holdings are negatively related to firm value. The relationship turns positive when agency costs decrease. In terms of the separation of control and ownership rights,Shen et al. (2008)find that state-owned controlling shareholders prefer high levels of cash holdings. The value of cash holdings in these firms is RMB0.769. When
there is separation in the two rights or state-owned controlling shareholders change, the value rises to RMB1.206. The market value of cash holdings in Chinese listed firms is generally lower than the book value, which is more significant in listed SOEs.
As mentioned previously, scholars have mostly focused on corporate governance and the legal environment and have discussed whether the two influence the value of cash holdings. Little attention has been paid to per-formance evaluation. The regulation of the EVA perper-formance evaluation, issued by the SASAC in 2010, is exogenous across firms in China. The EVA evaluation reflects a distinctly different idea compared with past evaluations. The regulation enforced by the SASAC provides an excellent opportunity to determine whether the EVA evaluation affects the management theory of the heads of CSOEs and the value of cash holdings. Based on its results, this study should enrich the literature related to what influences the value of cash holdings.
2.2. EVA performance evaluation
Stern Stewart introduced the EVA performance evaluation more than 20 years ago.1The company believes
that EVA is more persuasive than other performance indicators in terms of driving stock prices, creating wealth and interpreting changes in shareholder wealth (Stewart, 1994). The empirical findings of the
correla-tion between EVA and accounting performance have been diverse.Chen and Dodd (1997), Lehn and Makhija
(1997) and Kleiman (1999)find that EVA supports value creation capabilities.Machuga et al. (2002)find that
EVA can more accurately forecast future profits than Earning Per Share (EPS).Lovata and Costigan (2002)
find that defensive companies with low levels of insider ownership and institutional investors with large cash holdings are more inclined to use the EVA performance evaluation system. However,Biddle et al. (1997)find no evidence to support EVA.
Conclusions as to whether EVA can improve corporate value and whether stock prices have more relevance have been diverse. However, this does not affect our analysis of the effect of EVA on the value of cash hold-ings. An EVA calculation must consider all of the costs involved, including the cost of equity capital. Therefore, an EVA performance evaluation affects an enterprise’s entire asset structure, and the enterprise must adjust its cash holdings accordingly. The literature has not yet linked these two phases.
The SASAC deemed EVA an effective performance evaluation mechanism that is able to improve business efficiency and protect shareholder interests and is within the scope of SOEs to enforce. In this paper, we focus on whether the EVA performance evaluation changes the philosophy of the heads of CSOEs in a way that increases the value of their cash holdings. The literature thus far has not provided a clear answer to this point. Therefore, this paper attempts to analyze the relationship between EVA performance evaluation and the cor-porate value of cash holdings, link the fragmented literature related to EVA and the value of cash holdings and test the effect of the EVA performance evaluation in practice.
3. Institutional background, theoretical analysis and hypotheses
We begin by considering the executive pay reform process of Chinese companies. Employee pay was under strict control before China’s reform and opening-up policies were launched in 1978. Factory director wages were also subject to the rigid wage system. Wages were bonded to some non-financial indexes, including enter-prise location, industry, political rank (central or local), director’s administrative level, firm size, job type and personal qualifications (Yueh, 2004). The State Council approved the“annual salary system,”combining the basic and risky salaries of the Shanghai Hero Pan Company in 1992, thereby beginning the substantive reform of the executive pay system. Although SOEs had undertaken many non-financial goals, their operating per-formance was generally measured by financial indexes (Yueh, 2004).
Although China holds a theoretically positive attitude toward the value of managers, it regulates managers in practice, bonding their salaries with those of employees. Around 2004, the State Council and SASAC issued
1
Before the document is issued, the salary decisions made inside the companies probably make implicit use of value-making indexes to evaluate the executives based on accounting performance. The release of the document may make these implicit value-making indexes explicit.
theirInterim Measures for Business Performance Appraisals of Persons-in-Charge at Central Enterprisesand
Interim Measures for Compensation of Persons-in-Charge at Central Enterprises and subsequently put them into practice. They determine that the salaries of heads of CSOEs comprise basic and performance salaries in addition to long-term incentive units and raise a specific measure to bond the regulation of their salaries
with business performance. TheInterim Measures for Business Performance Appraisals of Persons-in-Charge
at Central Enterprisesentered into effect on January 1, 2007 and encourages enterprises to use the EVA index to appraise their annual business performance. Enterprises using the EVA index and attaining EVA growth
are rewarded. According to the Interim Measures for Business Performance Appraisals of Persons-in-Charge
at Central Enterprises, the SASAC can only encourage enterprises to use the EVA index. The enterprises are free to decide whether to use it based on the systems they have in place. Considering the spillover effect of theInterim Measures for Business Performance Appraisals of Persons-in-Charge at Central Enterprises, other
enterprises may imitate the CSOEs and use EVA as an appraisal index.2This document may only expose the
implicit evaluation of the executives’ value creation. The Shandong Department of Finance published the EVAs of all of the SOEs and community-owned enterprises and some private enterprises for three years begin-ning in 2006 to maximally decrease the profit manipulation of executives and accounting distortion perfor-mance and coordinate the SASAC and enterprises to comprehensively evaluate executive perforperfor-mance. In
2010, the SASAC issuedOrder No. 22, requiring CSOEs to appraise executive performance using a
combina-tion of accounting profit and EVA. EVA has a weight of around 40%.
Throughout the reform of the Chinese enterprise and“annual salary system,”salary contracts have gener-ally been based on accounting profit assessments. Although accounting performance is more easily manipulat-ed for managers’ interests,3we do not deny that such manipulation can act as an incentive for executives to work harder. As managers decide salaries, their interests complement those of shareholders. Determining how to encourage executives to improve short-term accounting performance without encouraging a loss in enter-prise value is one of the most important tasks for managers. A series of indexes can measure the enterenter-prise value including stock prices, return on equity and EVA. Nevertheless, the systemic risk of the stock market is beyond the control of executives (Sloan, 1993; Garvey et al., 2002). As a result, performance indexes, which are bonded with the systemic risk of the stock market, go against executive incentives. Compared with stock market indexes, the EVA index is under executive control, which reflects the effort level of the executives. Compared with accounting indexes, the EVA index is less likely to be manipulated and is able to reflect execu-tives’ efforts to ensure the long-term growth of their enterprises. When it is unsafe to observe CEOs’ perfor-mance, EVA may offer a better option by partly observing the controllable output (changes in stockholder wealth) of their observable effort (CEOs’ effort) (Jensen and Murphy, 1990).
EVA is a corporate finance, decision and compensation incentive system registered and carried out by Stern Stewart. At its core, it is an evaluation methodology based on net operating profit and the total cost of capital-making profit. It is calculated as follows: EVA = Net profit after taxTotal capital cost = Net profit after taxCapitalCost of capital. According to the new conception of value creation, an enterprise’s value cre-ation must be evaluated via EVA (Stewart, 1994). EVA truly reflects whether an enterprise is creating or losing value in a certain period, considering all of the capital costs including equity capital. Occupation of funds is a factor that influences EVA. The higher the amount of occupied of funds, the lower the EVA, ceteris paribus. Meanwhile, the cash that enterprises hold comprises a large proportion of occupied funds. Therefore, cash holdings and the efficiency of their investment are important factors influencing EVA. This paper focuses on cash holding value.
2 EVA has also undergone great improvement in China. Baosteel and Tsingtao Beer successfully introduced EVA at the end of 2002 and took it as an opportunity to re-engineer their organizational construction and management processes and establish EVA salary and financial management systems. The government implemented an annual salary policy in Tsingtao Beer in 1999. However, the annual salary system based on accounting numbers unfairly ignored the costs of capital. Combining EVA and accounting numbers increased the transparency of the company, its investment efficiency and the value of its human resources (2002,http://business.sohu.com). Other famous enterprises that have adopted EVA include China Construction Bank, Li-Ning, China Construction and FAW Group.
3
Before the document is issued, the salary decisions made inside the companies probably make implicit use of value-making indexes to evaluate the executives based on accounting performance. The release of the document may make these implicit value-making indexes explicit.
Three kinds of motivations account for cash holding performance: transaction motivation (Miller and Orr, 1966; Mulligan, 1997), precautionary motivation (Opler et al., 1999; Riddick and Whited, 2009; Bates et al., 2009) and agency cost motivation (Jensen, 1986; Dittmar and Jan, 2007). The earnings from cash holdings maintain currency for daily operations, decrease the chance of a financial dilemma and ensure that an invest-ment policy is not affected by a lack of money. However, cash holdings involve certain managerial and oppor-tunity costs. Too high a cash holding may influence executives’ investment behavior and create agency costs (Jensen and Meckling, 1976). As such, the earnings and costs of cash holdings must be balanced.
According to the principal-agent model presented byJensen and Meckling (1976), executives allocate enter-prise resources out of personal interest due to information asymmetry and limited rationality, including cash. When an enterprise’s performance harms stockholder interests, the motivation of its executives’ cash holding behavior assimilates the theory of free cash flow. According to this theory, massive cash holdings complement executives’ interests. The separation of the two rights pushes executives to use their residual control rights to hold cash. It allows executives to fulfill self-serving behavior such as perquisite consumption and adding sub-sidies. Meanwhile, massive cash holdings result in blind investment, which focuses on expansion rather than stockholder interests.
Against China’s institutional background, the CSOE as an institutional outcome both exhibits the charac-teristics of an enterprise and differs from enterprises in many ways. CSOEs do not have a clear property rights system, which results in the circumstance of“undeserved owners.”Jensen and Meckling (1976)believe that the relationship between stockholders and managers is essentially a contract. By signing contracts, principals authorize agents to perform certain responsibilities on behalf of the principals themselves and bestow certain decision-making powers upon those agents. The loss of company value associated with this principal-agent relationship is known as an agency cost. In CSOEs, where property rights and principals are uncertain, a seri-ous agency problem may arise between principals and agents that may incur agency costs. Meanwhile, CSOE executives enforce a compensation regulation (Chen et al., 2005) that weakens the incentive institution effect, forcing executives to add income from residual controls in compensation. In this circumstance, CSOE execu-tives prefer to expand their enterprises to fulfill more self-serving behavior such as perquisite consumption, which raises their enterprises’ agency costs and influences their value. In more microcosmic terms, it lowers the efficiency of cash use, wastes money on projects and investments that damage the company’s value and lowers the company’s cash-holding value. As CSOEs are at the highest level of China’s enterprise administra-tion system, their agency problems are self-evident. This paper seeks to determine whether the agency prob-lems of executives affect their behavior and the value of their cash holdings. It also considers whether EVA evaluation can change the behavior of executives and enhance their companies’ cash-holding value.
Designing a set of reasonable incentive measures to decrease the loss of enterprise value resulting from agency costs is an important part of principal-agent theory. Therefore, alleviating the agency problems between CSOE owners and executives is a way of enhancing CSOEs’ value-making capacity, investment effi-ciency and cash-holding value. Establishing effective regulation and incentive institutions against such a back-ground and synchronizing the interests of owners and executives are the keys to solving these problems. An appropriate evaluation of executive performance is the premise of an effective incentive. When the indexes of performance evaluation have been confirmed, executive behavior reaches a benchmark and executives perform in a way that maximizes their own interests. Therefore, favorable performance evaluation indexes alleviate agency problems and guide executives to make decisions and organize their enterprises’ manufacturing and operating performance on behalf of stockholder interests.
EVA evaluation began in 2010. The EVA index was added on the basis of accounting performance eval-uation and had a greater weight. EVA is adjusted on the basis of accounting performance and equals the eco-nomic profit less the capital costs, including the equity capital cost. Therefore, the added EVA evaluation affects executives as much as capital costs do. Capital costs comprise the occupied capital and weighted aver-age cost of capital. Executives have three approaches to enhancing EVA. First, they can efficiently operate their existing businesses and capital and increase their operating income. Second, they can be more prudent in terms of investment, which becomes efficient only when the return on investment exceeds the cost of capital. Third, they can increase the operating efficiency of capital and add the current turnover of capital. Executives increase both EVA and accounting profit when they increase their operating income. Decreasing the occupied
capital also influences EVA. Cash holdings comprise the greater part of the occupied capital. Therefore, cash holdings and investments are the key points to increasing EVA.
Even more crucial is that the EVA evaluation policy implemented by the SASAC also transmits a signal to the heads of CSOEs, which means that the SASAC focuses on evaluating both the value-making abilities and accounting performance of enterprises. The SASAC hopes to enhance the value-making abilities of enterprises by enhancing the performance evaluation model and protecting stockholder interests to a greater degree. The heads of CSOEs can observe the SASAC’s intention and may adjust their enterprises’ operations and manage-ment based on their charges. Of course, they must balance their own gains and losses, which can take the forms of personal salaries, control powers and chances of promotion.
China advanced a series of macroscopic regulations to prevent the polarization of employee income and demonstrate the principal of fairness. In practice, the government regulates executive income and some employee income (Chen et al., 2005). The main measure of this regulation is to bond executive and employee income and set a directional line for employee income. For example, in 2002, the SASAC issued the rule that executive salaries cannot exceed 12 times the salaries of employees, followed by the provinces. In 2004 and 2009, the SASAC and Ministry of Human Resources and Social Security issued and implemented their
Interim Measures for Business Performance Appraisals of Persons-in-Charge at Central Enterprises and
Guiding Opinions on Further Regulating the Salary Management of Persons-in-Charge at Central Enterprises, which clearly state that SOE executive salaries must comprise a basic annual salary, a performance salary and income from mid-/long-term incentives. The basic annual salary is bonded with the average salary of employees at central enterprises. These regulations have been broken to differing degrees over the growth of China’s economy and the growth of SOE profits. Tremendously overpriced salaries have occasionally appeared and serve as the best examples of these breakthroughs. Therefore, salaries remain one of the most important ways of incentivizing executives. Although executives can achieve control power to maximize their self-interest through perquisite consumption, the compensation incentive remains a relatively important incen-tive measure and execuincen-tives do not waive higher salaries in exchange for personal control power.
The incentive of political promotion is as meaningful as monetized salary incentives and personal control power. The heads of CSOEs are located near or directly within China’s political center and have greater poten-tial for political promotion. Many heads of CSOEs have been directly promoted as provincial officials. For example, Finance Minister Xie Louwei served as the president of CIC and the Governor of Fujian Province used to be the CEO of Sinopec. CSOEs have become incubators for economic officials and political promotion may be more of an incentive for the heads of CSOEs than making money or achieving personal profit. The SASAC is the evaluation and regulation institution of the heads of CSOEs. Its evaluation of these heads can decide their promotion to a great degree. Therefore, the heads of CSOEs have reasons to improve the operating ideas of their enterprises and maximize value according to the wishes of the SASAC. As such, creating value has become a central effort of the heads of CSOEs in the daily operating process.
CSOE executives are in the optimal position of choosing what should be evaluated and created to maximize
their own interests. The SASAC introduced the Interim Measures for Business Performance Appraisals of
Persons-in-Charge at Central Enterprisesin 2010, with the objective of choosing reasonable performance eval-uation indexes to solve the agency problem between CSOE stockholders and executives. The SASAC formerly used return on equity as the main performance evaluation index before EVA. Indexes based on accounting performance may push enterprises to go after net profit and ignore the costs of equity capital. As a result, the value of an enterprise’s stockholders suffers as the enterprise expands. CSOEs generally enjoy loose fund-ing policies and endure lower cost of debt capital. Therefore, executives can easily ignore the costs of capital when making operating decisions. EVA comprehensively accounts for the total capital costs and eliminates the disadvantage of classic accounting computation, which occupies the money of stockholders for free. As rational“economic men,”CSOE executives have a greater motive to think about the costs of equity and debt capital and spend more money on projects that may truly increase the value of their enterprises after the eval-uation policy has been taken into account.
According to the premise of the separation of ownership and control rights, inside executives use residual control power to affect cash-holding decisions and encourage investments that damage stockholder value through abnormally high cash holdings (Jensen, 1986) and to maximize their personal control power. It is relatively easy for SOEs to gain the credit support of banks and equity capital from the capital market, which
may increase cash holdings. Increased cash holdings have two effects on investment, overinvestment and underinvestment, both of which decrease a company’s value and cash holdings.
The heads of CSOEs may use cash holdings more prudently and consider the costs of capital after an EVA evaluation. Furthermore, overinvestment and underinvestment may be curbed to a certain level. Therefore, we present our first hypothesis as follows:
H1(a). The SASAC’s EVA evaluation policy lowers the overinvestment of CSOEs.
H1(b). The SASAC’s EVA evaluation policy lowers the underinvestment of CSOEs.
The corporate value of cash holdings often decreases due to underinvestment and overinvestment (Jensen, 1986). If overinvestment or underinvestment improves after an EVA performance evaluation, then the value of the CSOE’s cash holdings is enhanced due to the efforts of the head of the CSOE to actively or passively improve its business philosophy.
There are two ways to improve EVA. The first is to lower capital productivity. The second is to decrease the weighted cost of capital calculated from the costs of debt and equity. The more cash held by an enterprise, the larger the enterprise’s occupied capital. Cash returns and even negative cash returns are almost zero. The cost of capital remains the same under the weighted condition. The more cash held by an enterprise, the more the occupied capital is wasted. The higher the cost of capital, the lower the EVA.
However, cash holdings also have a transaction motivation (Miller and Orr, 1966; Mulligan, 1997) and pre-cautionary motivation (Opler et al., 1999; Riddick and Whited, 2009; Bates et al., 2009).Miller and Orr (1966) support the cash transaction motivation.Mulligan (1997)argues that an enterprise stores less cash due to the cost savings motivation of economic scale. Precautionary motivation supporters believe that when companies enter the capital market, they hold more cash to cope with unexpected situations (Opler et al., 1999; Riddick and Whited, 2009). If enterprises face risks such as a higher risk of cash flows, they will retain a large amount of cash to deal with these risks. Therefore, a certain amount of cash held by a company is accompanied by more investment opportunities (Mikkelson and Partch, 2003).
Under the pressure of the EVA performance evaluation, management seeks to decrease the cost of capital and maintain normal business operations. Therefore, its ultimate goal is to control cash within a reasonable scope to improve the value of the enterprise and its personal interests. Cash holding management can also increase the value of cash holdings to some extent.
Because EVA performance evaluation is only enforced within CSOEs, the effect of a CSOE’s operating phi-losophy and management style may be stronger than that of an LSOE. Therefore, the CSOEs’ performance evaluation mode has a stronger effect on cash holdings than that of general SOEs. In summary, we make the following hypotheses.
H2(a). The value of a CSOE’s cash holdings increases following an EVA performance evaluation.
H2(b). Compared with those of a non-CSOE, the value of CSOE’s cash holdings increases following an EVA performance evaluation.
4. Research design 4.1. Research sample
As this paper focuses on the association between EVA evaluation performance and the value of CSOE cash holdings, we choose A-share listed companies under the control of central enterprises as our research sample. Considering that the share reform process may affect the value of a company, we use data from the 2006–2011 period. When the SASAC of the State Council was first established in 2003, it managed 196 enterprises. Through recombination, this number decreased to 117 by the end of November 2011. According to the list of state-controlled stock codes, the sample comprises 1128 companies. After excluding companies with missing data and ST and *ST companies, the number of companies decreases to 987. To investigate the effect of the EVA appraisal system, we compare CSOEs with general SOEs. Therefore, non-CSOEs are also included in the
analysis. We use the difference-in-difference method to test the implementation of the EVA performance eval-uation policy. To avoid the disparity inherent in CSOEs and LSOEs, we adhere to the principle of same year, same industry and similar total assets and find 987 matching samples for the 987 companies. The final sample is 1974. Considering the influence of outliers, we winsorize the continuous variables at the 0.01 level. We obtain company financial data from the WIND advisory financial and CCER databases.
4.2. Model design
The regression model and variable design used in this paper mainly follow those used byPinkowitz and
Williamson (2007). To test our first hypothesis, we design the following model:
Overinvest¼a1þb1centralþb2impþb3impcentralþother variablesþe ðModelð1ÞÞ
Our model relating factors to the value of cash holdings relies on a study byPinkowitz et al. (2006). To test H2, we include the dummy variable imp of the EVA evaluation year in our model and modify the design as follows:
V ¼a1þb1cashþb2impþb3impcashþother variablesþe ðModelð2ÞÞ
V ¼a1þb1cashþb2impþb2centralþb2impcashþb2centralcashþb2impcentral
þb3impcentralcashþother variablesþe ðModelð3ÞÞ
4.3. Variable definitions
Corporate market value is treated as dependent variable V. Due to the past split-share structure of the Chinese capital market, it consists of the market value of circulating shares, the value of non-tradable shares and the value of corporate debt. As the value of corporate debt lacks market data, we use the book value of liabilities instead. Due to the share reform of CSOEs and other reasons, the value of non-tradable shares does not have a corresponding market price and the transfer price of non-tradable shares is generally based on net assets. Therefore, followingXia and Fang (2005), we use the product of non-tradable shares and net assets per share as the value of non-tradable shares.
Following Faulkender and Wang (2006), we define cash holdings as cash and tradable financial assets.
Before International Accounting Standards (IAS) were introduced to China, similar tradable financial assets were reflected in short-term investment items. After IAS were introduced, they were reflected in tradable finan-cial asset items. As the sample period in this paper begins in 2006, we add the two together, along with mone-tary funds. The result can be considered a proxy variable for cash holdings.
We calculate the EVA for each company according to theTemporary regulations of performance evaluation
on the central state enterprise legal person, which were revised and implemented by the SASAC. EVA is equal to the net operating profit after tax less the capital costs. The formula is written as follows: EVA = the net operating profit after taxthe capital costs = the net operating profit after tax-adjusted capital * average cost of capital rate. The net operating profit after tax is calculated as follows: net profit + (interest expense +
re-search and development expenses adjustmentsnon-recurring income adjustments * 50%) * (1–25%). The
adjusted capital is calculated as follows: average owner’s equity + average liabilitiesaverage interest-free liabilities-average construction-in-process. The average cost of capital rate, which should be 5.5% in principle, can be adjusted slightly in accordance with the circumstances. It should stay the same three years after con-firmation.4Following the regulation, we adjust the net operating profit after tax and the capital, with a cost-of-capital rate of 5.5% required in principle. We then calculate EVA manually. To control for the influence of enterprise scale on EVA, we use the rate equal to EVA divided by the capital used as a variable of EVA.
As we account for the effect of the EVA performance evaluation on the value of cash holdings and excessive investment, we calculate the excess investment variable. The measurement of excessive investment mainly
4
The 22ndTemporary regulations of performance evaluation on the central state enterprise legal person, revised and implemented by the SASAC.
refers to the model put forward byRichardson (2006). The total investment consists of value and new invest-ments. The value investment is equal to the depreciation and amortization of the previous period. The new investment is divided into expected and unexpected investments. The expected investment is relevant to cor-porate growth opportunities, financing constraints and other factors. The unexpected investment is equal to the new investment less the expected investment. In regression Model(1), the dependent variable NItis the
new investment (equal to the total investment less the value investment). The fitted values NI *treflect the
expected investment. The residual e is the unexpected overinvestment. A positive sign indicates excess
investment.
NIt¼a1þb1Growtht1þb2Cft1þb3DDebttþb4DEquitytþb5Levt1þb6Art1
þXIndþXYearþe ðModelð4ÞÞ
Our study is an event study that focuses on the influence that the EVA performance evaluation policy had on the value of CSOE cash holdings in 2010. The key to an event study is whether the event window is“clean”
and whether something that can affect the cash holding value exists or a similar event occurs. We review the events of the capital market during 2010 and find that the Central Bank raised the RRR six times in 2010,5 from 15.5% at the end of 2009 to 18.5% at the end of 2010. Studies have shown that monetary policy is an important factor affecting cash holdings (Chen and Chen, 2012). Thus, we control for the monetary policy per year (RRR). If the monetary policy is adjusted several times, we take its maximum value.
Differences in a company’s operating, investment and financing capacities may affect any changes in the company’s value. To estimate the value of the cash holdings, we require control variables that may affect com-pany value. Cf is the comcom-pany’s annual operating cash flow. Na is the comcom-pany’s net assets, or the balance of assets less its cash and trading financial assets. GI is the annual dividend and interest paid by the company, represented by the dividend and interest in the cash flow statement. Capex is the company’s capital expendi-ture, represented by the cash used to build and dispose of fixed, intangible and other long-term assets.Xtis the level of variablexin yeart.dXtis the change in variablexfrom yearst1 tot, orXtXt1, anddXt+1is the
change in variablexfrom yearsttot+ 1, orXt+1Xt. Referring to the research ofPinkowitz et al. (2006), we standardize all of the variables by dividing them by total assets. To control for year and industry effects, we add year and industry control variables to our model, represented by Year and Industry, respectively. The specific variables are defined inTable 1.
5. Descriptive statistics
5.1. Descriptive statistics: Analysis of main variables
Table 2shows the descriptive statistics for the main variables. The mean value of CSOEs is 1.611. The mean value of non-CSOEs is higher, at 1.667. This illustrates that the total market value of non-CSOEs exceeds that of CSOEs. The mean value of Cash is 0.152 for CSOEs and 0.16 for non-CSOEs. The mean value of EVA, which represents the value creation of CSOEs, is 0.021, indicating that companies create EVA by 2.1% on average.Table 2shows the descriptive statistics for the main variables.
Considering the two cases of enterprise value creation and value loss and the effect of policy implementa-tion, we investigate the descriptive statistics for CSOEs by group.Table 3 shows the descriptive statistics for the main variables in enterprises that create value and suffer value loss. The descriptive statistics for the main variables in different years are shown in Tables 4 and 5.
According to Table 3, 416 enterprises suffer value loss, accounting for 42% of the 987 observations. The enterprises that create value account for 58%, indicating that the majority of CSOEs create value. However, the 42% value loss rate reveals that the value creation ability of CSOEs requires improvement. The mean value of 1.686 for the enterprises that create value exceeds that of 1.506 for the enterprises that suf-fer value damage. The level of cash holdings in enterprises that create value is also higher.
5
In 2007, the Central Bank began to raise the RRR to control the currency circulation of the commercial banks. It did so 10 times in 2007, 10 times in 2008 and 6 times in 2010.
Table 4shows that the mean company value of CSOEs is 1.1 in 2006 and has no fixed pattern in the years afterward. The lowest company value is 1.098, indicating that the Asian Financial Crisis had a negative effect on corporate growth, consistent with the macroeconomic environment circumstance. In addition, from the end of 2008–2010, the development and implementation of the national “4 trillion” investment policy also affect company value. The mean value rebounds to 1.841 in 2009 and reaches its highest level of 2.019 in 2010. The mean level of CSOE cash holdings fluctuates between 2006 and 2011, reaching its lowest level of 0.145 in 2008 and its highest level of 0.164 in 2009. From 2006 to 2009, EVA maintains a relatively stable mean val-ue, with a maximum of 0.015 and a minimum of 0.010, representing a range of no more than 20% and a small Table 1
Variable definitions.
Variable Name Definition
V Market value of the company (Company’s equity value + creditor value)/total assets
EVA Economic value added rate Economic value added/capital occupancy
Imp Implementation Dummy variable that takes the value of 1 for all of the years after
year 2009 and 0 otherwise
VC Value creation Dummy variable that takes the value of 1 if EVA exceeds 0 and 0
otherwise
Cash Level of cash holding Cash and cash equivalents/total assets at the end of yeart
Cft Cash flow from operating activities Cash flow from operating activities/total assets at the end of yeart
dCft Change in cash flow from operating
activities
(CFO at the end of yeartCFO at the end of yeart1)/total assets
dCft+1 Change in cash flow from operating
activities
(CFO at the end of yeart+ 1CFO at the end of yeart)/total assets
dNat Change in net assets (Net assets at the end of yeartnet assets at the end of year
t1)/total assets
dNat+1 Change in net assets (Net assets at the end of yeart+ 1net assets at the end of year
t)/total assets
GIt Dividend and interest paid Dividend and interest paid in yeart/total assets
dGIt Change in dividend and interest paid (Dividend and interest paid in yeartdividend and interest paid
in yeart1)/total assets
dItt+1 Change in dividend and interest paid (Dividend and interest paid in yeart+ 1dividend and interest paid in yeart)/total assets
Capext Capital expenditures Capital expenditures at the end of yeart/total assets
dCapext Change in capital expenditures (Capital expenditures at the end of yeartcapital expenditures at
the end of yeart1)/total assets
dCapext+1 Change in capital expenditures (Capital expenditures at the end of yeart+ 1capital expenditures at the end of yeart)/total assets
Mp Monetary policy RRR per year
TIt Total investment (Cash used to build fixed assets, intangible assets and long-term
assets in the current period + cash for equity investment + cash for debt investment)/total assets in the previous period
MIt Hedging investment (Depreciation of fixed assets + amortization of intangible assets in
the previous period)/total assets in the previous period
NIt New investment (Total investmenthedging investment)/total assets in the
previous period NI*
t Expected investment Fitted value of the model
Overinvest Overinvest Residuals of Model (4)
GROWTHt1 Growth Tobin’s Q value in the previous period
DDEBT New debt (New loans + new bonds in the current period)/total assets in the
previous period
DEQUITYt New equity financing New equity financing in the current period/total assets in the
previous period
LEVt1 Debt ratio Assetliability ratio in the previous period
SIZEt1 Size Natural logarithm of total assets in the previous period
ARt1 Excess return on equity The previous yieldthe previous market yield
Industry Industry dummy variables Classified by one-digit industry codes of CSRC
Table 2
Descriptive statistics for the main variables.
Variable Number of observations Mean Median Standard deviation
CSOEs V 987 1.611 1.253 1.029 Cash 987 0.152 0.122 0.12 EVA 987 0.021 0.009 0.076 Cf 987 0.048 0.047 0.078 Gl 987 0.034 0.03 0.025 Capex 987 0.061 0.043 0.055 Non-CSOEs V 987 1.667 1.399 0.997 Cash 987 0.16 0.133 0.109 Cf 987 0.063 0.058 0.077 Gl 987 0.027 0.024 0.018 Capex 987 0.061 0.049 0.058 Table 3
Descriptive statistics for main variables in enterprises that create value and suffer value loss.
Variables Value loss Value creation
Number of observations Mean Number of observations Mean
V 416 1.506 571 1.686
Cash 416 0.128 571 0.169
EVA 416 0.04 571 0.065
Note: if EVA > 0, it is an enterprise that creates value; otherwise, it is an enterprise that suffers value damage.
Table 4
Descriptive statistics for the main variables by year.
Year V Cash EVA
2006 1.1 0.142 0.012 2007 1.969 0.147 0.015 2008 1.098 0.145 0.01 2009 1.841 0.164 0.013 2010 2.019 0.159 0.029 2011 1.543 0.151 0.026 Table 5a
Panel A: Effect of the implementation of policy on CSOE efficiency.
Variables Before 2010 After 2010 The mean test (T)
Number of observations Mean Number of observations Mean
V 661 1.511 326 1.812 24.63*** Cash 661 0.15 326 0.155 23.44*** EVA 661 0.017 326 0.028 7.33*** ROA 661 0.045 326 0.051 17.90*** ROE 661 0.069 326 0.096 18.61 OROA 661 0.037 326 0.043 15.06*** AR 661 0.003 326 0.002 2.41** Overinvest 661 0.011 326 0.002 1.36
Note:*represents significance at the 0.1 level. **Represents significance at the 0.05 level. *** Represents significance at the 0.01 level.
degree of fluctuation. However, the mean value of EVA changes drastically in 2010 and after 2011, reaching 0.029 and 0.026, respectively, an obvious increase compared with previous values.
5.2. Does the EVA performance evaluation policy improve company efficiency?
Table 5shows the descriptive statistics for the main variables before and after policy implementation. The SASAC implemented the EVA performance evaluation of the heads of CSOEs in 2010. The number of obser-vations after 2010 is 326, accounting for 33% of the total sample. The mean company value of CSOEs is 1.511 before 2010 and rises to 1.812 after 2010. The difference in company value before and after the implementation of the policy is obvious. Through differences tests, we find the value oft, representing the difference in com-pany value, which is 24.63 around 2010 and significant at the 0.01 level. The implemented policy thus improves the value of the CSOEs and enterprise growth changed around 2010.
The level of CSOE cash holdings is 0.15 before 2010 and rises to 0.155 after 2010, showing no obvious dif-ference in mean value. The value-creating ability of CSOEs, i.e., the mean value of EVA, is 0.017 before 2010 and rises to 0.028 after 2010 without obvious improvement. Through significance testing, we find that the val-ue oftrepresenting the difference of EVA is2.055 around 2010 and significant at the 0.05 level. The policy was therefore effectively implemented and improves the value-creating ability of the CSOEs. We also examine the effect of the EVA performance evaluation policy on accounting and market performance. The test results show that after the policy implementation, ROA, ROE and OROA (operating profit/total assets) increase sig-nificantly at the 0.01 level. AR also sigsig-nificantly increases at the 0.05 level. Univariate test results show that the EVA performance evaluation system improves CSOE efficiency.
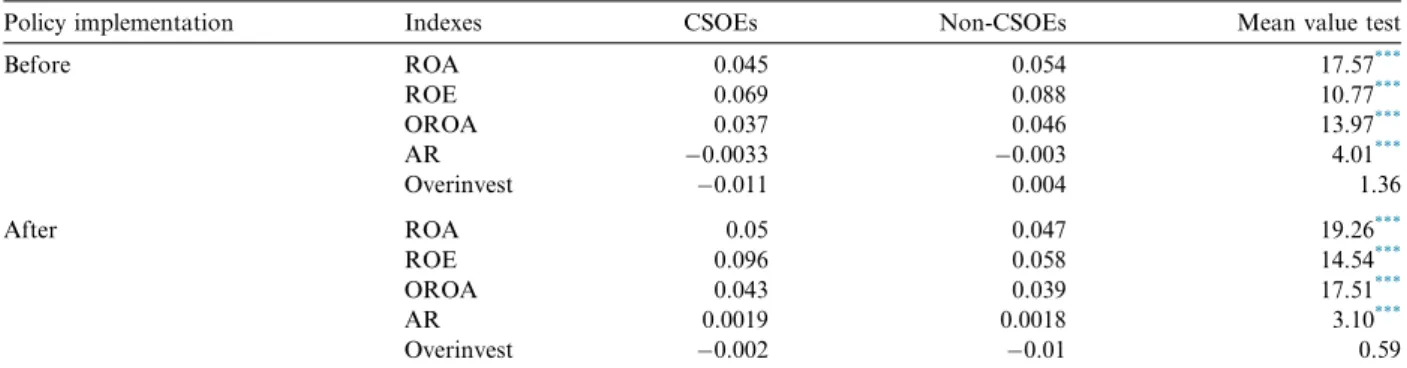
We test the efficiency of the CSOEs and non-CSOEs before and after the policy implementation.Table 5
Panel B shows the test results. Table 5b
Panel B: Efficiency of CSOEs and non-CSOEs before and after the policy implementation.
Policy implementation Indexes CSOEs Non-CSOEs Mean value test
Before ROA 0.045 0.054 17.57*** ROE 0.069 0.088 10.77*** OROA 0.037 0.046 13.97*** AR 0.0033 0.003 4.01*** Overinvest 0.011 0.004 1.36 After ROA 0.05 0.047 19.26*** ROE 0.096 0.058 14.54*** OROA 0.043 0.039 17.51*** AR 0.0019 0.0018 3.10*** Overinvest 0.002 0.01 0.59
Note: ROA = total profit/total assets, ROE = net profit/net assets, OROA = operating profit/total assets and AR = annual return on equitymarket returns. Overinvest is the excess investment variable, calculated according to theRichardson (2006)model.
*Represents significance at the 0.1 level. **Represents significance at the 0.05 level. *** Represents significance at the 0.01 level.
Table 6
Pearson correlation coefficients of the main variables.
Variables V Cash EVA Imp
V 1
Cash 0.2100*** 1
EVA 0.2033*** 0.2211*** 1
Imp 0.1372*** 0.0198 0.0653** 1
Note:*represents significance at the 0.1 level. **
Represents significance at the 0.05 level. ***
As Table 5Panel B shows, before the policy implementation, ROE of CSOEs is significantly lower than that of non-CSOEs. However, ROE of CSOEs is significantly higher after the policy implementation. The results indicate that the implemented policy improves accounting performance. Judging from the market per-formance, the excess returns on CSOE stocks are significantly higher around the policy implementation.
5.3. Correlation analysis of the main variables
We conduct a correlation analysis of the main CSOE variables. The Pearson correlation coefficient matrix inTable 6shows that the variable correlations are consistent with expectations and also provide a basis for the study’s hypotheses. Cash andVhave a significant positive correlation at the 1% level, consistent with the find-ings of previous studies. This indicates a positive correlation between a company’s cash holdfind-ings and value, and that an increase in the former can increase the latter. EVA and V also have a significant positive corre-lation at the 1% level, indicating that the stronger a company’s ability to create value, the higher the compa-ny’s value. Furthermore, Imp andVhave a significant positive correlation at the 1% level, indicating that the implemented policy effectively improves company value. EVA and Cash are significantly associated at the 1% and 5% levels, as are Imp and EVA. Other control variables are also significantly correlated at a certain level. In addition, to avoid the effects of multicollinearity on the results, we investigate the variance inflation factors (VIFs) of the variables used in the regression. The VIFs of the variables are less than 5.
6. Empirical tests 6.1. Test of H1
We conduct an OLS multiple regression for the effect of the level of cash holdings of the CSOEs, LSOEs and entire sample on overinvestment and underinvestment before and after the policy implementation.Table 7 Panel A shows the results.
As shown in regression (1) inTable 7Panel A, the cash regression coefficient of 0.129 is significantly positive at the 0.05 level, indicating that the more cash a SOE holds before the implementation of the EVA performance evaluation policy, the more it overinvests. The regression coefficient of the interaction term imp * cash is
0.053, indicating that the effect of cash holdings on overinvestment is weakened but not significantly so after the policy implementation. The EVA performance evaluation policy has less of an effect on the LSOEs and overinvestments. Regression (2) focuses on CSOEs. The cash regression coefficient is 0.172 and is significant at the 0.01 level. The regression coefficient of imp * cash is 0.13, which is also significant at the 0.01 level. The results show that the more cash holdings a CSOE has, the more likely it is to overinvest before policy imple-mentation. In addition, the influencing factor is 0.042 (0.1720.13), indicating that the effect of cash holdings on overinvestments is significantly weakened after the policy implementation. However, in regression (3), which focuses on LSOEs, we find no significant change before and after the policy implementation.
To further examine the effect of the EVA performance evaluation policy on CSOE overinvestment and underinvestment, we divide the CSOE sample into overinvestment and underinvestment sub-samples, corre-sponding with regression (4) and regression (5), respectively. In regression (4), the cash regression coefficient is 0.257 and the imp * cash regression coefficient is0.158. Both values are significant at the 0.01 level, indi-cating that the EVA policy implementation significantly decreases the effect of CSOEs’ cash holdings on over-investment. However, in regression (5), we do not find the CSOEs’ cash holdings to have a great effect on underinvestment before or after the implementation of the EVA performance evaluation policy.
In regression (6), we examine the differences in CSOEs and LSOEs before and after policy implementation. The regression coefficient of imp * central * cash is 0.198. It fails to pass the significance test, probably because the cash holdings influence different investments in different directions before and after the policy implemen-tation. Regressions (7) and (8) investigate the effects of the two types of enterprises on overinvestment and underinvestment before and after the policy implementation. The regression coefficient of imp * central * cash is0.233 in regression (7) and significant at the 0.01 level. The result shows that the effect of CSOEs’ cash holdings on overinvestment is significantly weakened after the implementation of the EVA policy compared with those of LSOEs. The regression coefficient of imp * central * cash is 0.266 in regression (8) and fails to
pass the significance test. This indicates that the level of CSOEs’ cash holdings does not improve underinvest-ment after the EVA policy impleunderinvest-mentation compared with LSOEs.
We use the difference-in-difference method, which has its own inherent limitations (Bertrand et al., 2004), to investigate the economic consequences of the CSOEs after EVA performance evaluation. The effects of the cash holdings of CSOEs and LSOEs on investment may have their own systemic differences. Using the interaction term imp * central * cash may not allow us to solve this problem. Thus, we conduct a falsification test as a sup-plement to the difference-in-difference method. We cross-multiply the dummy variables and the central * cash variable of each year to set a multitude of three intersecting variables. If we do not find the same result before and after the policy implementation, we confirm the empirical results obtained from the difference-in-difference method and conclude that the policy implementation leads to a systemic change in the two types of enterprises. Table 7Panel B shows the regression results. From 2006 to 2009, the cross-variable regression coefficients are insignificant regardless of overinvestment or underinvestment. This verifies the empirical results obtained from the difference-in-difference method to some extent. Thus, the regression results inTable 7support H1.
6.2. Test of H2
After validating H1, we further investigate the effect of the level of cash holdings on firm value.Table 8 shows the results.
According toTable 8Panel A, the regression coefficients of cash are 1.118 and 1.262 in regressions (1) and (2) before and after the EVA performance evaluation of CSOEs, respectively, and significant at the 0.01 and 0.05 levels, respectively. In regression (3), the regression coefficient of imp * cash is 1.157 and significant at the 0.01 level. This indicates that the effect of cash on firm value increases significantly after CSOEs’ implemen-tation of the EVA assessment. Compared with no assessment, firm value increases 1.157 units when the ratio of monetary capital to total assets increases by 1 unit and is economically significant. In contrast, the regres-sion coefficients of the cash variable and imp*cash are not significant in regresregres-sion (4) for LSOEs.
In regression (5), which covers the entire sample, the regression coefficient of imp * central * cash is 1.701 and significant at 0.05 level, indicating that the value of CSOEs’ cash holdings improves significantly after the EVA performance evaluation compared with that of LSOEs.
We also conduct a falsification test for the value of the cash holdings.Table 8Panel B shows the specific regression results.
As shown in the falsification test results inTable 8Panel B, from 2006 to 2009, the interaction term has no significant positive relationship with the dependent variable, reinforcing the conclusion of regression (5) in Table 8Panel A. Compared with the value of the cash holdings of LSOEs, the value of CSOEs’ cash holdings significantly increases after the implementation of the EVA policy.
Therefore, the regression results shown inTable 8support H2.
6.3. Does curbing overinvestment or improving underinvestment account for the increase in value of the cash holdings?
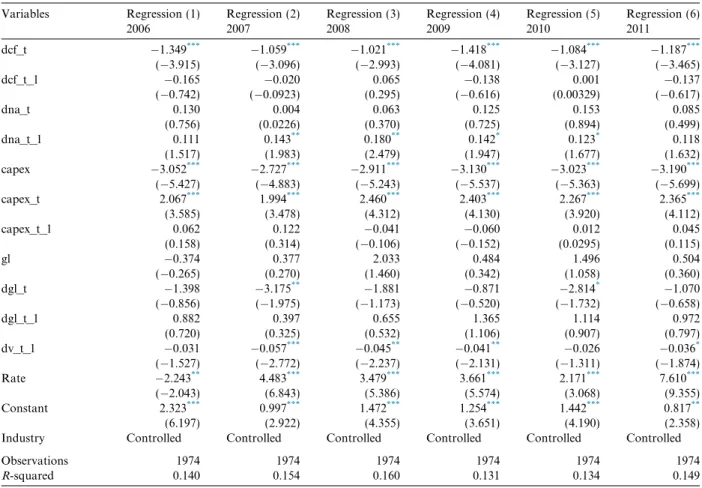
In our analysis, we find that CSOEs significantly decrease their overinvestment levels and improve the value of their cash holdings after implementing the EVA performance evaluation, beginning in 2010. In the theore-tical analysis, our claim is that the EVA performance evaluation ultimately affects the value of the cash hold-ings by improving corporate investment. We conduct a test to determine whether the EVA performance evaluation policy improves the value of the cash holdings by curbing overinvestment or improving underin-vestment.Table 9shows the results.
Table 9shows the value of the cash holdings under different investment conditions. In regression (1), which focuses on the CSOE overinvestment sub-sample, the regression coefficient of cash is 1.814 and significant at the 0.01 level. This indicates that cash holdings have a positive effect on the value of CSOEs that invest exces-sively before the policy implementation and no significantly positive effect on the value after the policy imple-mentation. In regression (2), which focuses on the CSOE underinvestment sub-sample, the regression coefficient of cash is 0.566, indicating that cash holdings have a negative yet insignificant effect on CSOE value before the policy implementation. The regression coefficient of imp*cash is 1.317 and significant at
Panel A: OLS multiple regression of the effect on overinvestment before and after implementation of the EVA performance evaluation policy. Variables Regression (1) Regression
(2)
Regression (3)
Regression (4) Regression (5) Regression(6) Regression (7) Regression (8) CSOEs and local
enterprises
CSOEs Local enterprises
CSOEs CSOEs CSOEs and local enterprises
CSOEs and local enterprises
CSOEs and local enterprises Whole sample Whole
sample
Whole sample
Overinvestment Underinvestment Whole sample Overinvestment Underinvestment Cash 0.129** 0.172*** 0.199 0.257*** 0.040 0.148* 0.162*** 0.075 (1.970) (5.148) (1.573) (7.263) (0.759) (1.654) (4.545) (0.412) Imp 0.003 0.028** 0.065 0.001 0.026* 0.057* 0.013 0.065 (0.138) (2.414) (1.299) (0.0781) (1.792) (1.722) (0.956) (1.016) Central 0.036 0.010 0.109** (1.473) (0.952) (2.298) imp_cash 0.053 0.130*** 0.056 0.158*** 0.005 0.059 0.070 0.262 (0.513) (2.698) (0.271) (2.922) (0.0691) (0.389) (1.214) (0.754) central_cash 0.069 0.100** 0.332 (0.571) (2.171) (1.233) imp_central 0.088** 0.010 0.095 (2.186) (0.598) (1.247) imp_central_cash 0.164 0.233*** 0.266 (0.791) (2.936) (0.587) Cf 2.481*** 2.307*** 2.840*** 1.888*** 2.155*** 2.519*** 1.884*** 2.331*** (23.81) (41.33) (13.52) (24.55) (25.41) (24.13) (38.00) (9.311) dcf_t 2.534*** 2.370*** 2.712*** 2.024*** 2.245*** 2.561*** 2.035*** 2.409*** (30.97) (62.29) (16.22) (35.64) (34.29) (31.31) (47.56) (11.41) dcf_t_1 0.031 0.006 0.098 0.046 0.027 0.022 0.000 0.027 (0.580) (0.201) (0.795) (1.209) (0.751) (0.410) (0.0114) (0.283) dna_t 0.266*** 0.139*** 0.665*** 0.067*** 0.267*** 0.303*** 0.097*** 0.574*** (6.556) (7.532) (6.781) (2.893) (11.24) (7.318) (5.292) (7.455) dna_t_1 0.021 0.005 0.039 0.003 0.020* 0.014 0.002 0.050 (1.235) (0.638) (0.708) (0.443) (1.711) (0.789) (0.390) (1.259) Capex 0.990*** 1.187*** 1.014*** 1.033*** 1.080*** 1.023*** 0.911*** 0.714*** (7.396) (16.49) (4.064) (9.589) (12.42) (7.666) (12.97) (3.027) capex_t 0.052 0.027 0.041 0.096 0.090 0.002 0.126* 0.032 (0.380) (0.396) (0.158) (1.017) (1.136) (0.0132) (1.860) (0.138) capex_t_1 0.030 0.018 0.080 0.015 0.107 0.027 0.079* 0.095 (0.319) (0.371) (0.427) (0.252) (1.609) (0.284) (1.879) (0.541) Gl 0.843** 0.074 2.515*** 0.128 0.230 1.204*** 0.123 2.681*** (2.578) (0.493) (3.064) (0.778) (1.015) (3.506) (0.934) (3.580) dgl_t 0.185 0.170 0.351 0.010 0.401 0.099 0.134 0.078 (0.466) (0.968) (0.385) (0.0545) (1.468) (0.245) (0.895) (0.0876) dgl_t_1 0.372 0.107 1.079 0.022 0.440** 0.651** 0.100 1.318** (1.279) (0.739) (1.636) (0.143) (2.032) (2.199) (0.892) (2.082) (continued on next page)
Y. Shen et al. /China Journal of Accounting Research 8 (2015) 213–241 229
Variables Regression (1) Regression (2)
Regression (3)
Regression (4) Regression (5) Regression(6) Regression (7) Regression (8) CSOEs and local
enterprises
CSOEs Local enterprises
CSOEs CSOEs CSOEs and local enterprises
CSOEs and local enterprises
CSOEs and local enterprises Whole sample Whole
sample
Whole sample
Overinvestment Underinvestment Whole sample Overinvestment Underinvestment
dv_t_1 0.004 0.004* 0.010 0.001 0.006* 0.004 0.002 0.002 (0.918) (1.729) (1.039) (0.331) (1.802) (0.846) (1.073) (0.235) Rate 0.043 0.109 0.073 0.320** 0.002 0.022 0.340*** 0.151 (0.177) (0.902) (0.156) (2.212) (0.0134) (0.0908) (3.410) (0.329) Constant 0.078 0.158*** 0.050 0.107** 0.246*** 0.079 0.093*** 0.131 (0.930) (3.828) (0.318) (2.330) (4.303) (0.948) (2.823) (0.783) Industry Controlled Controlled Controlled Controlled Controlled Controlled Controlled Controlled
Observations 1974 987 987 491 496 1974 1008 966
R-squared 0.400 0.853 0.304 0.807 0.764 0.408 0.764 0.190
Note: The dependent regression variable in this table is overinvest. Regression (1) is for the entire sample of CSOEs and LSOEs; regression (2) is for the entire sample of CSOEs; regression (3) is for the entire sample of LSOEs; regression (4) is for the overinvestment sample of CSOEs (overinvest greater than zero); regression (5) is for the underinvestment sample of CSOEs (overinvest less than zero); regression (6) is for the entire sample of CSOEs and LSOEs; regression (7) is for the overinvestment sample of CSOEs and LSOEs; and regression (8) is for the underinvestment sample of CSOEs and LSOEs, witht-statistics in brackets.
* p< 0.1. ** p< 0.05. *** p< 0.01. Y. Shen et al. /China Journal of Accountin g Research 8 (2015) 213–241