Frequent Occurrence of Hypogonadotropic
Hypogonadism in Type 2 Diabetes
SANDEEP DHINDSA, SATHYAVANI PRABHAKAR, MANAK SETHI, ARINDAM BANDYOPADHYAY,
AJAY CHAUDHURI, AND PARESH DANDONA
Division of Endocrinology, Diabetes, and Metabolism, State University of New York at Buffalo and Kaleida Health, Buffalo, New York 14209
Type 2 diabetes is associated with lower total testosterone (T) levels in cross-sectional studies. However, it is not known whether the defect is primary or secondary. We investigated the prevalence of hypogonadism in type 2 diabetes by mea-suring serum total T, free T (FT), SHBG, LH, FSH, and pro-lactin (PRL) in 103 type 2 diabetes patients. FT was measured by equilibrium dialysis. FT was also calculated by using T and SHBG (cFT). Hypogonadism was defined as low FT or cFT. The mean age was 54.7ⴞ1.1 yr, mean body mass index (BMI) was 33.4ⴞ0.8 kg/m2, and mean HbA1c was 8.4ⴞ0.2%. The mean T was 12.19 ⴞ 0.50 nmol/liter (351.7 ⴞ 14.4ng/dl), SHBG was 27.89ⴞ1.65 nmol/liter, and FT was 0.250ⴞ0.014 nmol/liter. Thirty-three percent of patients were hypogonadal. LH and
FSH levels were significantly lower in the hypogonadal group compared with patients with normal FT levels (3.15ⴞ0.26vs. 3.91ⴞ0.24 mIU/ml for LH and 4.25ⴞ0.45vs.5.53ⴞ0.40 mIU/ml for FSH;P<0.05). There was a significant inverse correlation of BMI with FT (rⴝ– 0.382;P<0.01) and T (rⴝ– 0.327;P<0.01). SHBG correlated inversely with BMI (rⴝ– 0.267;P<0.05) but positively with age (rⴝ0.538;P<0.001) and T (rⴝ0.574;P< 0.001). FT correlated strongly with cFT (rⴝ0.919;P<0.001) but not with SHBG. LH levels correlated positively with FT (rⴝ0.287;P<0.05). We conclude that hypogonadotropic hy-pogonadism occurs commonly in type 2 diabetes. (J Clin En-docrinol Metab89: 5462–5468, 2004)
T
YPE 2 DIABETES IS associated with low total testoster-one (T) in cross-sectional studies (1– 8). Barrett-Connor (1) in the Rancho Bernardo Study, demonstrated that the 44 elderly men (mean age 72 yr) with type 2 diabetes had lower total T levels than age- and body mass index (BMI)-matched nondiabetics. Prediabetes was also associated with lower levels of total T and bioavailable T (BT) in the Rancho Ber-nardo study (3). Another population-based case control study conducted in New Caledonia (CALDIA survey) found lower total T levels in 16 European and 77 Melanesian men with type 2 diabetes compared with an equal number of controls (6). Anderssonet al.(7) reported lower total T and SHBG levels in 46 diabetics compared with 11 healthy men of similar BMI and age.Total T concentrations are determined to a large extent by circulating SHBG concentrations. In the blood of normal men, 44% of total T is bound to SHBG, 2% is unbound [free T (FT)], and 54% circulates bound to albumin and other proteins (9). Because albumin-bound T has 1000 times lower affinity than SHBG, it can freely disassociate in capillaries. Virtually all the non-SHBG-bound T (also called BT) is there-fore available for tissue uptake (10). Circulating SHBG con-centrations are also dependent upon a number of factors, the most important association being with obesity. SHBG levels decrease in obesity and increase with aging. Type 2 diabetics
have even lower SHBG levels compared with age- and BMI-matched nondiabetics (2).
A complete assessment of hypogonadism should therefore include measurement of FT. FT levels were low in diabetics in the CALDIA study (6). However, the FT was measured by RIA, a method that is now considered unreliable because it represents a variable fraction (20 – 60%) of the FT measured by equilibrium dialysis (ED) (11–13). The purpose of FT and BT is to correct the total testosterone concentration for the effect of variable binding with SHBG. Winterset al.(14) found that SHBG is an important determinant of FT measured by analog RIA in men. Furthermore, RIA measures a constant percentage of total testosterone (0.5– 0.65%).
ED is considered to be the gold standard for measuring FT. FT measured by this technique represents 1.5– 4% of total T and is not dependent upon SHBG concentrations (14). To our knowledge, no study has compared FT levels done by ED in diabetics and nondiabetics. The probable reason for this is that ED is a delicate, tedious, and time-consuming technique and therefore not suitable for population-based or large stud-ies. It is therefore not clear whether the lower SHBG levels in diabetics can account for all the differences in T levels between diabetics and nondiabetics.
It is also not known whether the lower T levels in diabetics are associated with changes in LH and FSH. We have pre-viously published data showing that the commonest form of gonadal dysfunction associated with type 2 diabetics with erectile dysfunction is hypogonadotropic hypogonadism (15). Andoet al.(5) reported low total T and normal LH levels in diabetics, whereas Aliet al.(16) found that subjects with diabetic neuropathy had low T and high LH and FSH levels. Neither of these studies presented data on FT concentrations. Abbreviations: BLSA, Baltimore Longitudinal Study of Aging; BMI,
body mass index; BT, bioavailable testosterone; cFT, calculated free testosterone; ED, equilibrium dialysis; FT, free testosterone; MRI, mag-netic resonance imaging; NIRKO, neuron-specific insulin receptor knockout; PRL, prolactin; T, testosterone.
JCEM is published monthly by The Endocrine Society (http://www. endo-society.org), the foremost professional society serving the en-docrine community.
doi: 10.1210/jc.2004-0804
and to differentiate whether the nature of hypogonadism is hypogonadotropic or hypergonadotropic. We hypothesized that hypogonadism occurs frequently in type 2 diabetes and that it is secondary to a hypogonadotropic defect.
Patients and Methods
The study was conducted in the Diabetes-Endocrinology Center of Western New York, a tertiary referral center affiliated with the State University of New York and Kaleida Health in Buffalo, NY. The study was done with male patients with type 2 diabetes referred to the center for management of diabetes. Patients with known history of hypogo-nadism, panhypopituitarism, or chronic debilitating disease such as renal failure, cirrhosis, or HIV were excluded from the study. Demo-graphic parameters were collected, and height, weight, glucose, and HbA1c were measured. Data related to the duration of diabetes, med-ications, and clinical history, including the presence of erectile dysfunc-tion, neuropathy, retinopathy, and coronary artery disease were col-lected systematically. Fasting blood samples were then obtained to measure serum total T, FT, SHBG, LH, FSH, PRL, glucose, and HbA1c. All these tests are done in our clinic as part of the work-up at the initial visit. We evaluate T routinely in type 2 diabetes patients in view of the frequency of low T concentrations in our patients. Informed consent was therefore not obtained.
Total T was measured by solid-phase RIA (Coat-A-Count from Di-agnostic Products Corp., Los Angeles, CA). The lower limit of normal for T in our clinical lab is 10.4 nmol/liter (300 ng/dl). SHBG was tested at Specialty Laboratories, Santa Monica, CA, by immunochemilumino-metric assay.
FT was measured by ED. FT was calculated by multiplying the total T by the dialyzable fraction. The lower limit of FT in our reference lab is 0.174 nmol/liter (50 pg/ml). ED is considered to be the gold standard for measuring FT.
FT was also calculated from SHBG and T using the method of Ver-meulenet al.(12) and using a computer program and web site address supplied by Dr. T. Fiers, University Hospital Ghent, Ghent, Belgium (http://www.issam.ch/freetesto.htm). This calculated FT (cFT) has been shown to correlate very well with FT measured by ED (11). For cFT, 0.225 nmol/liter (64.8 pg/ml) was taken as the lower limit of normal (17). It is known that cFT values are generally 10 –15% higher than FT mea-sured by ED. This reason is not clear but could be because of the type of SHBG standardization or because of a bias in the association constant used for SHBG in the equation of Vermeulenet al.(12).
BT (non-SHBG-bound T) was also similarly calculated using SHBG and T. The lower limit of normal was considered to be 5.2 nmol/liter (150 ng/dl) (17).
LH and FSH were measured by chemiluminescent immunometric assays.
Because FT is the gold standard for diagnosing hypogonadism and cFT values are reliable for estimating FT (17), hypogonadism was de-fined as low FT or low cFT.
Data are presented as mean⫾se. Kruskal-Wallis ANOVA on ranks was used to compare data across groups. Mann Whitney rank sum test was used to compare nonparametric data, andttest was used to compare parametric data. Fisher exact test or2test was also used to compare the
groups whenever appropriate. Spearman correlation (for nonparametric data) or Pearson correlation (for parametric data) was used to establish correlations. Multiple regression analysis between variables was per-formed if there was more than one independent variable.P⬍0.05 was considered significant. Sigma Stat software was used for analysis.
Results
Data from 103 consecutive new male patients in our clinic were analyzed. All the patients had type 2 diabetes mellitus.
All patients had either FT measured by ED or cFT (FT calculated using SHBG and T). Hypogonadism was defined as low FT or cFT. The mean total T in our study patients (n⫽ 103) was 12.19⫾0.50 nmol/liter (351.7⫾14.4 ng/dl; range, 1.73–28.36 nmol/liter), and 45 patients (43.7%) had T levels less than 10.4 nmol/liter (300 ng/dl).
Of 103 patients, 57 had FT measured by ED. The mean FT level was 0.250⫾0.014 nmol/liter (72.1⫾4.17 pg/ml; range, 0.040 – 0.529 nmol/liter). Fourteen of the 57 patients (24.6%) had levels less than 0.174 nmol/liter (50 pg/ml) and were therefore hypogonadal.
SHBG was available in 75 of 103 patients, allowing the calculation of cFT and BT. The mean SHBG concentration was 27.89⫾1.65 nmol/liter (range, 6 –70.1 nmol/liter). The average cFT level was 0.269⫾0.012 nmol/liter (77.45⫾3.5 pg/ml; range, 0.087– 0.625 nmol/liter). Twenty-seven pa-tients (36%) had levels less than 0.225 nmol/liter (64.8 pg/ ml) and were therefore hypogonadal.
Thus, of a total of 103 patients who had either FT or cFT measured, 34 patients (33%) were hypogonadal. If only total T had been used to define hypogonadism, there would have been 36% false positives and 12% false negatives, and the frequency of hypogonadism would have been 43.7%.
Twenty-nine patients had values available for both FT and cFT. cFT values in our study were 12% higher than FT mea-sured by ED. As reported in the literature, cFT values cor-related excellently with FT obtained by ED (r⫽ 0.92;P⬍ 0.001) (11, 12).
The average BT levels were 6.28⫾0.29 nmol/liter (range, 1.88 –14.67 nmol/liter), and 36% of the patients had values below the lower limit (5.2 nmol/liter).
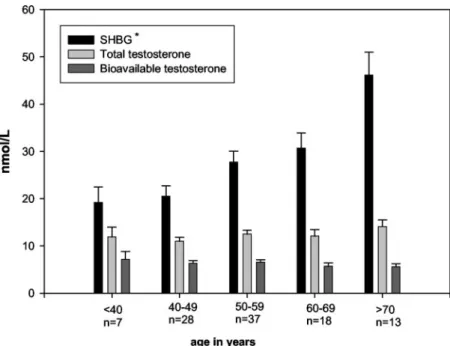
T, SHBG, and BT levels across different age groups are depicted in Fig. 1. The rise in SHBG was significant (P⬍ 0.001) across the age groups, but there was no significant change in T or BT levels with age.
The mean values for LH, FSH, and PRL were 3.94⫾0.24 mIU/ml, 5.93⫾0.49 mIU/ml, and 7.04 ⫾1.26 ng/ml, re-spectively. Nine patients had either high LH or FSH levels (three patients had high concentrations of both LH and FSH; two patients had isolated high LH levels, whereas four pa-tients had isolated high FSH levels). Three of these nine patients had low FT or cFT concentrations, and the remaining six had normal FT or cFT concentrations. None of the patients had abnormal PRL values.
The LH concentrations and FSH concentrations were sig-nificantly lower in the hypogonadal group (Table 1). To rule out the possibility that the cause of hypogonadotropic hy-pogonadism was a pituitary lesion, we carried out magnetic resonance imaging (MRI) in 10 randomly selected hypogo-nadal subjects. None of the MRIs showed pituitary or hy-pothalamic abnormalities.
Dividing patients into hypogonadal and eugonadal groups based on FT (only) yielded similar results for LH and FSH. Both LH and FSH were significantly lower in the
hy-pogonadal group (LH levels were 2.98⫾0.25vs.4.41⫾0.44 mIU/ml,P⬍0.001; FSH levels were 3.24⫾0.27vs.5.25⫾ 0.53 mIU/ml,P⫽0.01).
The data were then analyzed after dividing patients into categories based on BMI (Table 2): lean (⬍25.0 kg/m2),
over-weight (25.0 –29.9 kg/m2), obese (30.0 –39.9 kg/m2), and
se-verely obese (⬎40.0 kg/m2). Total T, BT, and FT levels (both
calculated and measured by dialysis) fell progressively with increase in BMI, and the trend was significant across the groups. SHBG concentrations were significantly higher (P⬍ 0.05) in the lean group compared with the severe obesity group.
Figure 2 illustrates the prevalence of hypogonadism (based on low FT or cFT) in our study across decades of age from 40 –79 yr.
Correlations
Total T correlated inversely with weight and BMI (r ⫽ – 0.303 for weight and – 0.327 for BMI;P⬍0.01 for both) but not with age.
SHBG correlated inversely with weight (r⫽– 0.300;P⬍ 0.01) and BMI (r⫽– 0.262;P⬍0.05) but positively with age (r⫽0.538;P⬍0.001) and T (r⫽0.574;P⬍0.001).
In a multiple regression analysis using T as the dependent variable and BMI and SHBG as independent variables, both BMI and SHBG were significant predictors of T (P⬍0.01). Inclusion of age and LH in this model did not modify the results.
FT correlated strongly and directly with T (r⫽0.884;P⬍ 0.001). FT correlated inversely with weight (r⫽– 0.413;P⬍ 0.01) and BMI (r⫽– 0.382;P⬍0.01) (Fig. 3). However, the prevalence of hypogonadism in the normal BMI group (Table 2) was 31.3%. Thus, despite the relatively weak but signifi-cant inverse correlation of FT with BMI, low FT or cFT values were common in the normal BMI group.
LH levels correlated significantly and positively with FT concentrations (r⫽0.287;P⬍0.05). However, in multiple regression analysis using FT as the dependent variable and BMI and LH as independent variables, only BMI remained a significant predictor of FT (P⫽0.005). FT did not correlate with age or SHBG.
As reported in the literature, cFT values correlated excel-lently with FT obtained by ED (r⫽0.919;P⬍0.001) (11, 12). FIG. 1. Serum concentrations of total T, SHBG, and BT
according to age. The rise in SHBG was significant (*, P ⬍0.001) across the age groups, but there was no significant change in T or BT levels with age. Lower limit of normal for T is 10.4 nmol/liter and for BT is 5.2 nmol/liter. Normal range for SHBG is 7–50 nmol/liter. To convert T from SI units (nmol/liter) into conventional units (ng/dl), multiply by 28.8.
TABLE 1. Clinical and biochemical features of patients with normal or low FT or cFT Hypogonadal Eugonadal n 34 69 Age (yr) 57.2⫾2.4 53.5⫾1.5 BMI (kg/m2) 35.7⫾1.7 31.7⫾1.0 T (nmol/liter) 8.07⫾0.65 14.58⫾0.62a FT (nmol/liter) 0.146⫾0.011 0.306⫾0.015a cFT (nmol/liter) 0.172⫾0.007 0.326⫾0.013a LH (mIU/ml) 3.15⫾0.26 3.91⫾0.24b FSH (mIU/ml) 4.25⫾0.45 5.53⫾0.40b PRL (mIU/ml) 6.69⫾0.58 6.69⫾0.46 SHBG (nmol/liter) 28.87⫾2.79 27.31⫾1.96 HbA1c (%) 8.5⫾0.3 8.42⫾0.3 LDL (mg/dl) 105.3⫾9 113.5⫾4.4 HDL (mg/dl) 39.6⫾3.8 39.2⫾1.3 Triglycerides (mg/dl) 183.3⫾28.8 164.6⫾28 Cholesterol (mg/dl) 179.8⫾11.5 177.1⫾5 24-h microalbuminuria (mg) 51.5⫾37.4 48.1⫾19.5 Retinopathy 27% 20% Neuropathy 43% 35% Erectile dysfunction 17% 20%
Coronary artery disease 30% 38%
Use of statins 33% 38%
Use of insulin 50% 35%
Use of thiazolidinediones 35% 26% Creatinine (mg/dl) 1.16⫾0.06 1.01⫾0.03 Duration of diabetes (yr) 9.03⫾1.31 7.12⫾0.97
To convert testosterone from SI units (nmol/liter) into conventional units (ng/dl), multiply by 28.8. LDL, Low-density lipoprotein; HDL, high-density lipoprotein.
aP⬍0.001vs.hypogonadal group.
bP⬍0.05vs.hypogonadal group. For comparison of the
cFT also correlated significantly and negatively with weight (r⫽– 0.229;P⬍0.05) and BMI (r⫽– 0.267;P⬍0.05).
BT correlated inversely with BMI (r⫽– 0.317;P⬍0.01) and weight (r⫽– 0.289;P⬍0.05) but not with age or SHBG. BT correlated strongly and positively with FT (r ⫽0.871;P⬍ 0.001) measured by ED. In a multiple regression analysis using BT as the dependent variable and BMI, SHBG, age, and LH as independent variables, only BMI was a significant predictor of BT (P⬍0.001).
There was no correlation of either T or FT with FSH, PRL, age, HbA1c, duration of diabetes, or the use of insulin or thiazolidinediones.
Discussion
Our data clearly show that hypogonadotropic hypogo-nadism is a common defect in type 2 diabetes, irrespective of the glycemic control, duration of disease, and the presence of complications of diabetes or obesity. The prevalence of hy-pogonadism is much higher than that expected based on the age of subjects. Normal aging is associated with a decrease in total T levels of the order of 0.5–2% per year. The fall in
T is gradual and constant over all decades and starts early in life, probably after the third decade. In longitudinal data from the Massachusetts Male Aging Study, total T decreased at a rate of 1.6% per year, whereas SHBG increased by 1.2% per year (18). In the Baltimore Longitudinal Study of Aging (BLSA), one of the most quoted studies describing age-related decline of T, the decrease in T averaged 0.110 nmol/ liter per year. We compared the prevalence of hypogonadism obtained in our study with that in the BLSA (19). The in-vestigators in that study performed an analysis of 3661 sam-ples for T and SHBG. The BLSA study population was largely middle class with 87% Caucasians. BLSA had 16% diabetics in its population, and there was no association between T levels and the presence of diabetes (19). Diabetes was diag-nosed by performing oral glucose tests in all the study vol-unteers. It is therefore likely that their diabetic cohort con-sisted primarily of milder diabetics who were early in their stage of disease compared with the population we have studied. Hypogonadism was described in that study as T less than 325 ng/dl (11.28 nmol/liter). We compared the prev-alence of hypogonadism in our study (using the same criteria as BLSA) across various age ranges with the prevalence from BLSA. The average age of our patients was 54.7 yr (compared with 53.8 yr in BLSA) and had a higher BMI (33.4 vs.25.6 kg/m2) than BLSA subjects. Our patients were markedly
more hypogonadal in all age groups from 40 –70 yr (preva-lence of hypogonadism in age group 40 – 49 yr, 54vs.8%; age group 50 –59 yr, 46vs.12%; age group 60 – 69 yr, 56vs.19% in our study and the BLSA, respectively).
We also compared the BT levels in our study with those in nondiabetics from a population-based study done in Utrecht, The Netherlands (20). In this study, Mulleret al.(20) measured total T and SHBG concentrations in 400 male vol-unteers (age range, 40 – 80 yr; mean, 60.2 yr). BT levels were calculated from T and SHBG using the method of Vermeulen et al.(12). We found that diabetics from our study had lower BT levels at all age groups (age 40 –50, 6.36vs.9.90 nmol/liter; age 51– 60, 6.56vs. 8.40 nmol/liter; age 61–70, 5.70vs.7.40 nmol/liter; age 71– 80, 5.63vs.7.00 nmol/liter for our study and the Utrecht study, respectively).
No large studies are available describing levels of FT
(mea-⫾ ⫾ ⫾ ⫾ Total T (nmol/liter)a 15.50⫾1.52b 13.45⫾1.03b 12.06⫾0.74b 9.38⫾0.86 BT (nmol/liter)a 8.00⫾0.93b 6.70⫾0.57b 6.40⫾0.40b 4.49⫾0.35 FT (nmol/L)a 0.325⫾0.053b 0.279⫾0.025b 0.244⫾0.020b 0.175⫾0.021 cFT (nmol/liter)a 0.330⫾0.043b 0.286⫾0.024b 0.275⫾0.017b 0.200⫾0.016 % hypogonadal 31.3% 21.1% 27.9% 57.9% SHBG (nmol/liter) 34.45⫾3.61b 32.13⫾4.83 27.28⫾2.56 23.50⫾2.20 LH (mIU/ml) 3.61⫾0.42 4.21⫾0.57 4.16⫾0.31 3.40⫾0.53 FSH (mIU/ml) 5.12⫾0.74 6.81⫾0.87 6.51⫾0.81 4.48⫾0.89 PRL (mIU/ml) 6.61⫾0.88 5.89⫾0.43 7.24⫾0.67 6.44⫾0.78 HbA1c 9.0⫾0.6% 8.6⫾0.5% 8.2⫾0.2% 8.4⫾0.3%
Duration of diabetes (yr) 7.4⫾1.8 8.9⫾1.6 7.2⫾0.9 8.2⫾1.9
aP⬍0.05 across groups.
bP⬍0.05 as compared with severe obesity group.
FIG. 2. Percentage of hypogonadal (low FT or cFT) patients with type 2 diabetes in age groups ranging from 40 –79 yr.
sured by ED) in different age groups for comparison with results obtained in our study. Tsaiet al.(21) measured T and SHBG levels and cFT and BT values in 221 nondiabetic men with a mean age of 57 yr and BMI of 29 kg/m2. Mean cFT
concentration was 0.32 nmol/liter, BT was 7.9 nmol/liter, T was 18 nmol/liter, and SHBG was 42.2 nmol/liter. In con-trast, our study patients (diabetics with a mean age of 54.7 yr and BMI 33.4 kg/m2) had mean cFT levels of 0.269 nmol/
liter; BT was 6.28 nmol/liter, T was 12.19 nmol/liter, and SHBG was 27.89 nmol/liter.
Although the techniques for measurement of T and SHBG levels are well established and consistent among most labs, it cannot be denied that there may be variability in the T and SHBG concentrations obtained in different labs with differ-ent kits. Therefore, we also compared T levels obtained in our study with those in the CALDIA survey study (6), a popu-lation-based study conducted in New Caledonia (a French South Pacific island). T in this study was measured by the same commercial kit and method as the one used in our study (RIA; Coat-A-Count). In the study, Defay et al. (6) compared T levels in 16 European men with 16 controls from the same population. The mean age was similar in both groups (46.9 yr). Subjects with diabetes had a higher BMI (32.8 kg/m2in diabeticsvs.25.1 kg/m2in controls). The mean
duration of diabetes was 1.8 yr. The mean T levels were 13.8 nmol/liter (397 ng/dl)vs.20.73 nmol/liter in controls. The mean total T levels in our study patients were similar to levels in their diabetic population, 12.19⫾0.5 nmol/liter (351.7⫾ 14.4 ng/dl).
It is not clear whether the age-related decline in T levels is because of the chronic illnesses, which increase with aging. Some studies have found that age-associated decline in T is diminished or abolished in healthy men (defined as absence of chronic illnesses and/or healthy lifestyle) (20). Chronic illnesses that have been consistently associated with low T
levels are malignancy and HIV infection (22). The etiology of hypogonadism in chronic illness appears to be complex, with both hypo- and hypergonadotropic hypogonadism having been reported (22). In the BLSA, the presence of cancer was associated with a greater decline in T levels than that ob-served with aging alone (23). T levels have been reported to be higher in smokers and lower in subjects who take more than 40 g/d of alcohol (20).
The cause of age-related decline in T is likely a combina-tion of testicular and pituitary/hypothalamic defects. Tes-ticular response to gonadotropins is diminished in older men, gonadotrope responsiveness to androgen suppression is attenuated, and the pulsatility of the hypothalamic pulse generator is altered (22). Cross-sectional as well as longitu-dinal studies have generally suggested that LH/FSH levels rise slightly with age (23, 24). The increase in LH does not correlate with the decrease in T, suggesting an age-related alteration in this feedback mechanism (24, 25). It is not clear whether there is attenuation of the GnRH signal as well (26). Prolonged exogenous GnRH infusion restores daily LH se-cretory activity but fails to normalize T levels (27). PRL levels remain constant or either increase or decrease slightly with age (18, 23). In our study, PRL levels were not different between hypogonadal and nonhypogonadal groups, and they did not correlate with age. The levels were comparable to those in normal subjects. Gonadotropin concentrations were not elevated in the hypogonadal patients in our study, and thus the primary defect in these patients would appear to be either in the pituitary gland or hypothalamus. In fact, the LH and FSH levels were significantly lower in the hy-pogonadal group than the eugonadal group. This may sug-gest that the cause of hypogonadism in these patients could be decreased gonadotropin secretion. To rule out the possi-bility that the cause of hypogonadotropic hyopogonadism was a pituitary lesion, we carried out MRI in 10 randomly FIG. 3. Correlation of FT (nmol/liter)
erectile dysfunction, we had conducted some tests with GnRH (15). These tests had revealed a normal LH and FSH rise, suggesting a hypothalamic rather than a pituitary defect.
The existence of a hypothalamic defect resulting in hy-pogonadotropic hypogonadism in type 2 diabetes is of in-terest in view of its association with insulin resistance. Neu-ron-specific insulin receptor knockout (NIRKO) mice with a specific knockout of the insulin receptor in neurons exhibit hypogonadotropic hypogonadism (28). Plasma LH levels were decreased by 60 –90% in NIRKO mice compared with controls. When these mice were injected with lupron, a GnRH receptor agonist, they displayed a normal to 2-fold increase in LH levels compared with control mice. These mice also had increased adipose tissue and insulin resistance. Metabolic syndrome, insulin resistance, and visceral obe-sity have all been associated with low SHBG and low total T levels in men (29, 30). Tsaiet al.(21) found that in nondi-abetic men, cFT and BT correlate inversely with regional and overall body fat (measured by computed tomography and dual-energy x-ray absorptiometry, respectively) as well as with measures of insulin resistance [homeostasis model assessment for insulin resistance (HOMA-IR), fasting insu-lin]. However the association of cFT and BT with insulin resistance was no longer significant when adjustments were made for regional and total body fat. In our study, total T correlated inversely with BMI (r⫽ – 0.327;P ⬍0.01). In a multiple linear regression model using T, BMI, and SHBG, both BMI and SHBG were independent predictors of T. Thus, it seems that in diabetics, BMI has an effect on T indepen-dently of SHBG concentrations.
It is believed that the low total T in obesity is caused by low SHBG concentrations. However, FT levels have also been found to be low in massively obese males, and the defect appears to be at the hypothalamic or pituitary level. Zumoff et al.(31) studied 48 healthy men (mean age, 33.2 yr) with BMI ranging from 21–95 kg/m2 and found that both FT and
non-SHBG-bound T (calculated from T and SHBG) corre-lated inversely with BMI. Vermeulenet al.(32) found that 35 obese men (mean BMI, 41.1 kg/m2) had significantly lower
FT levels than 54 lean men (0.31vs.0.42 nmol/liter). The FT levels correlated inversely with BMI. They also compared LH pulsatility over 12 h in eight obese and lean men and found that the mean integrated LH levels over 12 h were signifi-cantly lower in obese men. FT levels correlated positively with the sum of LH pulse amplitudes in each individual (32). It is remarkable that 57.9% of massively obese (BMI⬎40) patients in our study were hypogonadal. Furthermore, LH levels in our study correlated significantly and positively with FT concentrations (r⫽0.287;P⬍0.05). Thus, data from the literature in humans and NIRKO mice and from our study seem to suggest that obesity/insulin resistance is as-sociated with hypogonadism and that the hypogonadism appears to be hypogonadotropic in nature. Obesity is
asso-BMI (r⫽– 0.382 and – 0.317, respectively). These data are the first to show that FT (measured by ED) correlates inversely with BMI in type 2 diabetics. However, on the basis of the correlation coefficient, it can be derived that only 10 –15% of variability (r2) in FT can be explained by BMI. Furthermore,
a large number (31.3%) of lean subjects in our study were hypogonadal. Thus, although obesity may explain part of the high prevalence of hypogonadism, it is likely that other fac-tors associated with type 2 diabetes also contribute signifi-cantly. This area is clearly ripe for further investigation.
A diagnosis of hypogonadism commits the patient to life-long androgen replacement therapy. Experts disagree on how hypogonadism should be defined. Although in many studies (including ours), hypogonadism is defined solely on the basis of T levels, others argue that hypogonadism should be defined by the presence of a clinical syndrome in asso-ciation with low total T and FT levels. A practical bioassay of T activity is not yet available. Furthermore, different androgen-dependent physiological processes appear to re-quire a different serum level of T (38). Serum T levels in the lower range of normal are able to maintain aspects of sexual functions, but muscle strength, muscle size, and fat-free mass increase progressively in a dose-dependent fashion with in-crease in circulating T concentrations even within the normal range (39, 40). Because there is no clear consensus as to what the normal range for total T should be, both diagnosis of hypogonadism and monitoring of therapy after T treatment pose problems.
Even fewer data are available for normal ranges of FT. In our study, we found that if hypogonadism had been defined as a total T of less than 300 ng/dl, there would have been 12% false negatives and 36% false positives on the basis of low FT (FT or cFT). Therefore, any patient with type 2 diabetes who has a low or low normal T should have FT measured before he is labeled as hypogonadal. Because the technique for ED is cumbersome and not readily available, whereas cFT values (using T and SHBG) are reliable, cFT can also be used instead of FT in a clinical setting (41).
Hypogonadism is associated with an increase in fat mass, decreased muscle mass, accelerated bone loss, and decreased libido, and treatment with T results in improvement in these parameters (42). The high prevalence of hypogonadism in type 2 diabetes raises important issues about its possible consequences on libido, erectile dysfunction, body muscu-lature, abdominal adiposity, bone density, mood, and cog-nition. It has been recently shown that T has an antiinflam-matory and antiatherogenic effect in experimental animals and in humans (43). This raises the question of whether T deficiency can be proatherogenic. Thus, the question of T replacement becomes an important issue. This question needs to be addressed in prospective randomized studies (44).
In conclusion, hypogonadotropic hypogonadism is a com-mon defect in type 2 diabetes that requires further
assess-ment in terms of the etiology of the defect and the possible consequences, complications, and treatment.
Acknowledgments
We acknowledge the assistance of Patty Kepler, L.P.N., and the clin-ical staff of the Diabetes-Endocrinology Center of Western New York, Millard Fillmore Gates Hospital, for helping us with this study. We thank Dr. T. Fiers (University Hospital Ghent, Ghent, Belgium) for providing us with the website address for calculation of FT using T and SHBG.
Received April 29, 2004. Accepted July 26, 2004.
Address all correspondence and requests for reprints to: Paresh Dan-dona, B.Sc., M.B. B.S., D.Phil., F.R.C.P., Director, Diabetes-Endocrinol-ogy Center of Western New York, Chief of EndocrinolDiabetes-Endocrinol-ogy, State Uni-versity of New York at Buffalo, 3 Gates Circle, Buffalo, New York 14209. E-mail: [email protected].
References
1. Barrett-Connor E1992 Lower endogenous androgen levels and dyslipidemia in men with non-insulin-dependent diabetes mellitus. Ann Intern Med 117: 807– 811
2. Barrett-Connor E, Khaw KT, Yen SS1990 Endogenous sex hormone levels in older adult men with diabetes mellitus. Am J Epidemiol 132:895–901 3. Goodman-Gruen D, Barrett-Connor E2000 Sex differences in the association
of endogenous sex hormone levels and glucose tolerance status in older men and women. Diabetes Care 23:912–918
4. Chang TC, Tung CC, Hsiao YL1994 Hormonal changes in elderly men with non-insulin-dependent diabetes mellitus and the hormonal relationships to abdominal adiposity. Gerontology 40:260 –267
5. Ando S, Rubens R, Rottiers R1984 Androgen plasma levels in male diabetics. J Endocrinol Invest 7:21–24
6. Defay R, Papoz L, Barny S, Bonnot-Lours S, Caces E, Simon D1998 Hormonal status and NIDDM in the European and Melanesian populations of New Caledonia: a case-control study. The CALedonia DIAbetes Mellitus (CALDIA) Study Group. Int J Obes Relat Metab Disord 22:927–934
7. Andersson B, Marin P, Lissner L, Vermeulen A, Bjorntorp P1994 Testos-terone concentrations in women and men with NIDDM. Diabetes Care 17: 405– 411
8. Betancourt-Albrecht M, Cunningham GR2003 Hypogonadism and diabetes. Int J Impot Res 15(Suppl 4):S14 –S20
9. Dunn JF, Nisula BC, Rodbard D1981 Transport of steroid hormones: binding of 21 endogenous steroids to both testosterone-binding globulin and cortico-steroid-binding globulin in human plasma. J Clin Endocrinol Metab 53:58 – 68 10. Pardridge WM1986 Serum bioavailability of sex steroid hormones. Clin
En-docrinol Metab 15:259 –278
11. Morley JE, Patrick P, Perry 3rd HM2002 Evaluation of assays available to measure free testosterone. Metabolism 51:554 –559.
12. Vermeulen A, Verdonck L, Kaufman JM1999 A critical evaluation of simple methods for the estimation of free testosterone in serum. J Clin Endocrinol Metab 84:3666 –3672
13. Rosner W2001 An extraordinarily inaccurate assay for free testosterone is still with us. J Clin Endocrinol Metab 86:2903
14. Winters SJ, Kelley DE, Goodpaster B1998 The analog free testosterone assay: are the results in men clinically useful? Clin Chem 44:2178 –2182
15. Tripathy D, Dhindsa S, Garg R, Khaishagi A, Syed T, Dandona P2003 Hypogondotrophic hypogonadism in erectile dysfunction associated with type 2 diabetes mellitus: a common defect? Metabol Syndr Relat Disord 1:75– 81
16. Ali ST, Shaikh RN, Ashfaqsiddiqi N, Siddiqi PQ1993 Serum and urinary levels of pituitary-gonadal hormones in insulin-dependent and non-insulin-dependent diabetic males with and without neuropathy. Arch Androl 30: 117–123
17. Vermeulen A, Kaufman JM2002 Diagnosis of hypogonadism in the aging male. Aging Male 5:170 –176
18. Gray A, Feldman HA, McKinlay JB, Longcope C1991 Age, disease, and changing sex hormone levels in middle-aged men: results of the Massachusetts Male Aging Study. J Clin Endocrinol Metab 73:1016 –1025
19. Harman SM, Metter EJ, Tobin JD, Pearson J, Blackman MR2001 Longitu-dinal effects of aging on serum total and free testosterone levels in healthy men: Baltimore Longitudinal Study of Aging. J Clin Endocrinol Metab 86:724 –731 20. Muller M, den Tonkelaar I, Thijssen JH, Grobbee DE, van der Schouw YT
2003 Endogenous sex hormones in men aged 40 – 80 years. Eur J Endocrinol 149:583–589
21. Tsai EC, Matsumoto AM, Fujimoto WY, Boyko EJ2004 Association of bio-available, free, and total testosterone with insulin resistance: influence of sex hormone-binding globulin and body fat. Diabetes Care 27:861– 868 22. Bhasin S, Bremner WJ1997 Emerging issues in androgen replacement
ther-apy. J Clin Endocrinol Metab 82:3– 8
23. Feldman HA, Longcope C, Derby CA, Johannes CB, Araujo AB, Coviello AD, Bremner WJ, McKinlay JB2002 Age trends in the level of serum testosterone and other hormones in middle-aged men: longitudinal results from the Mas-sachusetts male aging study. J Clin Endocrinol Metab 87:589 –598
24. Morley JE, Kaiser FE, Perry 3rd HM, Patrick P, Morley PM, Stauber PM, Vellas B, Baumgartner RN, Garry PJ1997 Longitudinal changes in testos-terone, luteinizing hormone, and follicle-stimulating hormone in healthy older men. Metabolism 46:410 – 413
25. Veldhuis JD1999 Recent insights into neuroendocrine mechanisms of aging of the human male hypothalamic-pituitary-gonadal axis. J Androl 20:1–17 26. Veldhuis JD2000 Recent neuroendocrine facets of male reproductive aging.
Exp Gerontol 35:1281–1308
27. Mulligan T, Iranmanesh A, Kerzner R, Demers LW, Veldhuis JD1999 Two-week pulsatile gonadotropin releasing hormone infusion unmasks dual (hy-pothalamic and Leydig cell) defects in the healthy aging male gonadotropic axis. Eur J Endocrinol 141:257–266
28. Bruning JC, Gautam D, Burks DJ, Gillette J, Schubert M, Orban PC, Klein R, Krone W, Muller-Wieland D, Kahn CR2000 Role of brain insulin receptor in control of body weight and reproduction. Science 289:2122–2125 29. Haffner SM, Karhapaa P, Mykkanen L, Laakso M1994 Insulin resistance,
body fat distribution, and sex hormones in men. Diabetes 43:212–219 30. Laaksonen DE, Niskanen L, Punnonen K, Nyyssonen K, Tuomainen TP,
Salonen R, Rauramaa R, Salonen JT2003 Sex hormones, inflammation and the metabolic syndrome: a population-based study. Eur J Endocrinol 149: 601– 608
31. Zumoff B, Strain GW, Miller LK, Rosner W, Senie R, Seres DS, Rosenfeld RS1990 Plasma free and non-sex-hormone-binding-globulin-bound testos-terone are decreased in obese men in proportion to their degree of obesity. J Clin Endocrinol Metab 71:929 –931
32. Vermeulen A, Kaufman JM, Deslypere JP, Thomas G1993 Attenuated lu-teinizing hormone (LH) pulse amplitude but normal LH pulse frequency, and its relation to plasma androgens in hypogonadism of obese men. J Clin En-docrinol Metab 76:1140 –1146
33. Hotamisligil GS, Shargill NS, Spiegelman BM1993 Adipose expression of tumor necrosis factor-␣: direct role in obesity-linked insulin resistance. Science 259:87–91
34. Dandona P, Weinstock R, Thusu K, Abdel-Rahman E, Aljada A, Wadden T
1998 Tumor necrosis factor-␣in sera of obese patients: fall with weight loss. J Clin Endocrinol Metab 83:2907–2910
35. Weisberg SP, McCann D, Desai M, Rosenbaum M, Leibel RL, Ferrante Jr AW
2003 Obesity is associated with macrophage accumulation in adipose tissue. J Clin Invest 112:1796 –1808
36. Watanobe H, Hayakawa Y2003 Hypothalamic interleukin-1and tumor necrosis factor-␣, but not interleukin-6, mediate the endotoxin-induced sup-pression of the reproductive axis in rats. Endocrinology 144:4868 – 4875 37. Russell SH, Small CJ, Stanley SA, Franks S, Ghatei MA, Bloom SR2001 The
in vitro role of tumour necrosis factor-␣and interleukin-6 in the hypothalamic-pituitary gonadal axis. J Neuroendocrinol 13:296 –301
38. Bhasin S2000 The dose-dependent effects of testosterone on sexual function and on muscle mass and function. Mayo Clin Proc 75(Suppl):S70 –S75; dis-cussion S75–S76
39. Bhasin S, Woodhouse L, Casaburi R, Singh AB, Bhasin D, Berman N, Chen X, Yarasheski KE, Magliano L, Dzekov C, Dzekov J, Bross R, Phillips J, Sinha-Hikim I, Shen R, Storer TW2001 Testosterone dose-response relation-ships in healthy young men. Am J Physiol Endocrinol Metab 281:E1172–E1181 40. Woodhouse LJ, Gupta N, Bhasin M, Singh AB, Ross R, Phillips J, Bhasin S
2004 Dose-dependent effects of testosterone on regional adipose tissue dis-tribution in healthy young men. J Clin Endocrinol Metab 89:718 –726 41. Matsumoto AM, Bremner WJ2004 Serum testosterone assays: accuracy
mat-ters. J Clin Endocrinol Metab 89:520 –524
42. Snyder PJ, Peachey H, Berlin JA, Hannoush P, Haddad G, Dlewati A, San-tanna J, Loh L, Lenrow DA, Holmes JH, Kapoor SC, Atkinson LE, Strom BL
2000 Effects of testosterone replacement in hypogonadal men. J Clin Endo-crinol Metab 85:2670 –2677
43. Malkin CJ, Pugh PJ, Jones RD, Jones TH, Channer KS2003 Testosterone as a protective factor against atherosclerosis: immunomodulation and influence upon plaque development and stability. J Endocrinol 178:373–380 44. Barrett-Connor E, Bhasin S2004 Time for (more research on) testosterone.
J Clin Endocrinol Metab 89:501–502
JCEM is published monthly by The Endocrine Society (http://www.endo-society.org), the foremost professional society serving the endocrine community.