THREE ESSAYS ON COMMODITY MARKETS
BY ZHEPENG HU
DISSERTATION
Submitted in partial fulfillment of the requirements
for the degree of Doctor of Philosophy in Agricultural and Applied Economics in the Graduate College of the
University of Illinois at Urbana-Champaign, 2020
Urbana, Illinois
Doctoral Committee:
Professor Philip Garcia, Co-Chair
Professor Maria Teresa Serra Devesa, Co-Chair Assistant Professor Todd Hubbs
ii ABSTRACT
This dissertation consists of three essays that investigate issues in agricultural commodity futures and cash markets. The first essay uses price discovery measures and intraday data to quantify the proportional contribution of nearby and deferred contracts in price discovery in the corn and live cattle futures markets. On average, nearby contracts reflect information more quickly than deferred contracts in the corn market but have a relatively less dominant role in the live cattle market. In both markets, the nearby contract loses dominance when its relative volume share dips below 50%, which typically occurs when the nearby is close to maturity. Regression results indicate that the share of price discovery is mainly related to trading volume and time to expiration in both markets. In the corn market, the price discovery share between nearby and deferred contracts is also related to inverse carrying charges, crop year differences, USDA announcements, market crashes, and commodity index position rolls. Differences between corn and live cattle markets are consistent with differences in the contracts’ liquidity and commodity storability.
The second essay investigates the effect of algorithmic trading activity, as measured by quoting, on the corn, soybean, and live cattle commodity futures market quality. Using the CME’s limit-order-book data and a heteroskedasticity-based identification approach, we find more intensive algorithmic quoting (AQ) is beneficial in multiple dimensions of market quality. On average, AQ improves pricing efficiency and mitigates short-term volatility, but its effects on liquidity costs are somewhat mixed. Increased AQ significantly narrows effective spreads in the corn and soybean markets, but not in the less traded live cattle futures market. The narrowing in effective spreads emerges from a reduction in adverse selection costs as more informed traders
iii
lose their market advantage. There also is evidence that liquidity provider revenues increase with heightened AQ activity in the corn futures market, albeit the effect is not statistically significant in the soybean and live cattle futures markets.
The third essay investigates how export prices and sales responses to exchange rate
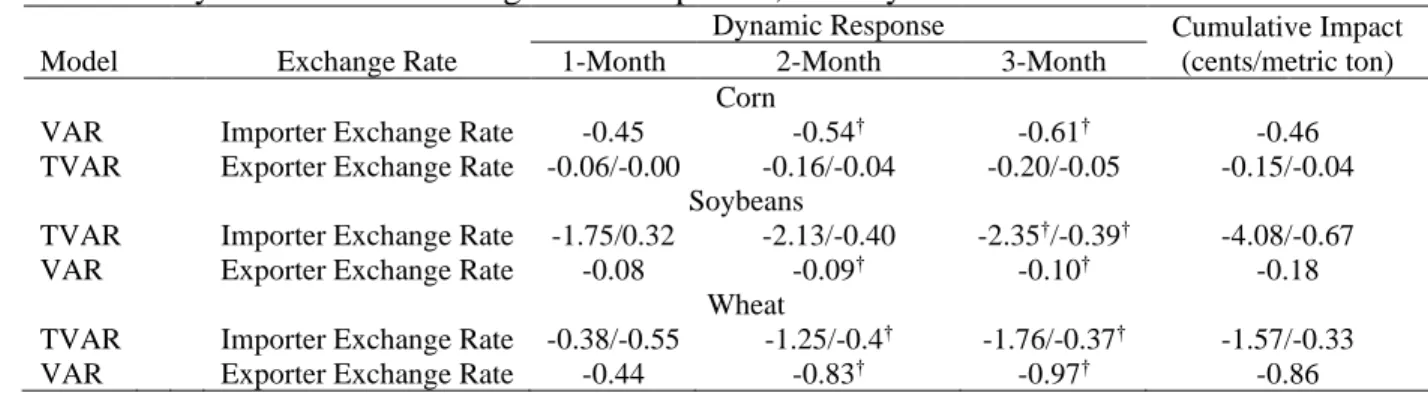
movements are affected by the level of the stocks-to-use ratio. The analysis is performed in the corn, soybean, and wheat export markets using Threshold Vector Autoregressive (TVAR) models and monthly data for the January 1990-December 2019 period. Both importer and exporter exchange rates are considered in our analysis. Results show that the effects of both importer and exporter exchange rates on corn export prices and sales are either insignificant or have small economic value due to the relatively small export share of production. In the more export-oriented soybean and wheat markets, an increase in the value of the dollar relative to other exporters’ currencies causes an expected and significant decrease in the export price, but export sales are not significantly affected which reflects the low substitutability between the U.S. exports and competitors’ exports in terms of marketing seasons and crop classes. The effects of importer exchange rates present significant threshold effects in soybean and wheat markets as export prices and sales are more responsive in the low regime of stocks-to-use ratio. Similar threshold effects are also found in the exporter exchange rate impacts on corn export prices and sales. However, the impacts across regimes are not largely different in economic value.
iv
ACKNOWLEDGMENTS
I would like to gratefully thank my advisors, Dr. Philip Garcia and Dr. Serra Terresa, for their great support and guidance throughout my graduate life. I am also pleased to thank Dr. Mindy Mallory for providing thoughtful suggestions to my dissertation. I would also like to thank Dr. Todd Hubbs for providing his knowledge about agricultural commodity markets.
I also have received great support from other faculty members including Dr. Robe Michel, Dr. Scott Irwin and my peers in the world-class price analysis research group in the department of ACE. Last but by no means least, special thanks are granted to my parents. Without them, I would not have been able to make it this far.
This dissertation was finished in the middle of a global pandemic. I would like to thank all healthcare workers who are fighting on the frontlines.
v
TABLE OF CONTENTS
CHAPTER 1: INTRODUCTION ...1 CHAPTER 2: MEASURING PRICE DISCOVERY BETWEEN NEARBY AND DEFERRED CONTRACTS IN STORABLE AND NON-STORABLE COMMODITY FUTURES
MARKETS ...4 CHAPTER 3: ALGORITHMIC QUOTING, TRADING, AND MARKET QUALITY IN
AGRICULTURAL COMMODITY FUTURES MARKETS ...48 CHAPTER 4: EXCHANGE RATE EFFECTS ON AGRICULTURAL EXPORT PRICES AND SALES IN HIGH-LOW STOCK REGIMES ...94 CHAPTER 5: CONCLUSIONS ...130 REFERENCES ...134
1 CHAPTER 1: INTRODUCTION
In the past decade, agricultural commodity futures and cash markets have witnessed structural changes and market events that created important impacts. In agricultural futures markets, the transformation from open outcry trading to electronic trading has changed the nature of futures trading. The speed at which information enters the market has increased, but this has caused concerns that market quality and efficiency have been harmed. In agricultural cash markets, U.S. exports are facing increasing competition in global export markets. In addition, recent trading tensions between the U.S. and major trading patterners cause tremendous uncertainty in U.S. export markets. In this context, this dissertation examines three contemporary issues in agricultural commodity futures and cash markets, aiming to provide implications for understanding the nature of electronic trading and challenges in U.S. agricultural exports.
The first two essays focus on market microstructure in agricultural commodity futures markets. The first essay uses high frequency trade data and price discovery shares to study price discovery along the futures forward in storable and non-storable markets. The second essay investigates the effects of algorithmic trading on agricultural futures market quality. The last essay focuses on exchange rate effects on agricultural export prices and sales.
The first essay, “Measuring Price Discovery between Nearby and Deferred Contracts in Storable and Non-Storable Commodity Futures Markets,” uses high frequency intraday transaction data and price discovery measures, including Putniņš’ (2013) information leadership share, to measure the share of price discovery between nearby and deferred contracts in corn and live cattle markets. It has been widely shown in previous studies that the nearby contract
2
provides most price discovery in agricultural futures markets. However, price discovery along the forward curve is a dynamic process. Using intraday futures transaction data, this essay studies for the first time when, and the speed at which price discovery switches from the nearby contract to the next nearby contract. The results are helpful to researchers who need to build time series of rolling nearby futures prices. In addition, regression analysis is used to identify the factors that relate to price discovery, considering for the first time Working’s and Tomek’s predictions about the location of price discovery, as well as the effects of commodity index trading and pit trading closure.
While electronic trading changes the nature of price discovery in agricultural commodity futures markets, the change in the speed of trading also influences agricultural futures markets in many other ways. While a growing number of studies on the microstructure of agricultural commodity futures markets have emerged in recent years (e.g., Wang, Garcia, and Irwin 2013; Couleau, Serra, and Garcia 2018, 2019), they do not provide direct identification of the effects of high frequency trading. The second essay, “Algorithmic Quoting, Trading, and Market Quality in Agricultural Commodity Futures Markets,” provides the first empirical evidence for the effects of algorithmic quoting, on the corn, soybean, and live cattle commodity futures market quality. Using limit order book data and a heteroskedasticity based identification approach, this essay shows algorithmic quoting is beneficial to market quality in multiple dimensions.
However, there is evidence that heightened algorithmic quoting is associated with higher
liquidity provider revenues. These findings point to a tradeoff between the dimensions of market quality, and the need for continued monitoring of algorithmic trading activity in agricultural commodity futures markets.
3
While the effect of electronic algorithmic trading on commodity markets can’t be denied, market fundamentals continue to be relevant for understanding agricultural commodity markets. Exchange rate effects of agricultural commodity prices and exports have long been studied since Schuh’s (1974) classic article. However, only a few studies have shown how the underlying market supply-demand conditions affect the exchange rate-exports relationship. The third essay, “Exchange Rate Effects on Agricultural Export Prices and Sales in High-Low Stock
Regimes,” studies export prices and sales responses to exchange rate movements in different stocks-to-use conditions in the corn, soybean, and wheat export markets. The results provide important implications for both policymakers and market participants that stocks-to-use
conditions need to be considered for accurate evaluations and forecasts on exchange rate effects in agricultural markets.
4 CHAPTER 2:
MEASURING PRICE DISCOVERY BETWEEN NEARBY AND DEFERRED CONTRACTS IN STORABLE AND NON-STORABLE COMMODITY FUTURES
MARKETS
2.1 Introduction
Price discovery is a main function of futures markets. Traditional research on price discovery in agricultural futures markets has developed in three main areas: determining which dominates, cash or futures price (Garbade and Silber, 1983; Schroeder and Goodwin, 1991; Ahumada and Cornejo, 2016); which of several geographically differentiated markets dominates (Koontz, Garcia and Hudson, 1990; Janzen and Adjemian, 2017; Arnade and Hoffman, 2018); and whether there is a difference in the quality of price discovery in storable versus non-storable commodities (Leuthold, Junkus and Cordier, 1989; Yang, Bessler and Leatham, 2001). Overwhelming evidence suggests that futures markets lead cash markets in price discovery.
The recent introduction of electronic trading in futures markets has heightened their liquidity and increased the speed of response to new information. Relative to cash markets, which
typically report prices daily, this has strengthened the leadership of futures markets in price discovery. But futures markets are not completely homogeneous; instead a market contains contracts with different maturities to meet trader needs that differ in time. Little is known about where along the futures forward contract curve new information gets impounded into prices. Understanding how each contract contributes to price discovery is essential for market participants making sound hedging and trading decisions.
5
Working (1948, 1949) developed a theory explaining price relationships along the futures forward curve for storable commodities. Prices for a storable commodity are linked through time by the net costs of carrying inventories. Exceptions may occur in periods of inverse carrying charges as low inventories break down the normal storage linkage. Working’s view of deferred futures prices implies that they may play a less dominant role in price discovery compared to the nearby futures prices as they only adjust to nearby prices based on changes in storage costs. However, Tomek and Gray (1970) and Tomek (1997) argue that commodity futures not only provide guidance for carrying inventories, but also forecasts of expected futures prices reflecting future supply and demand conditions. Hence, their view implies that price discovery along the forward curve is not always dominated by the nearby contract. In particular, when traders act on market news that affects their expectations about the supply and demand conditions in a deferred month, price discovery is more likely to occur first in a deferred contract.
While Working’s and Tomek’s theories offer different predictions on the price discovery role of the nearby contract, empirical studies find the nearby contract, on average, provides most price discovery in futures markets for agricultural commodities (Sanders, Garcia and Manfredo, 2008; Schnake, Karali and Dorfman, 2012), as well as other financial assets (Chen and Tsai, 2017). However, price discovery along the forward curve is dynamic. The forward curve shifts as days to expiration decrease for each contract and new contracts are added. The nearby contract loses importance as the delivery period approaches, evidenced by falling volume and open
interest. However, no research has directly examined when and the speed at which price
discovery switches from the nearby contract to the next. In addition, while long-run cointegration between commodity prices has been widely examined in previous studies on price discovery, the
6
cointegration relationship between agricultural commodity futures prices for different time horizons within a day has never been studied.
In this paper we measure price discovery between nearby and deferred futures for each day from 2008 to 2015. We use Chicago Mercantile Exchange (CME) transactions data for corn and live cattle that are time-stamped to the second. We employ the information leadership share (Putniņš, 2013), which is designed for high frequency data samples and is robust to differences in noise in price series. This price discovery share (PS) measure enables us to determine the relative proportion of information impounded in nearby and deferred futures prices. The use of high frequency data allows us to measure price discovery daily and offer a day-to-day dynamic characterization of how futures price discovery switches from one contract to the next as the nearby nears expiration.
We first document patterns in daily PSs between nearby and deferred futures contracts. Findings reveal PSs are strongly related to the contracts’ relative volume shares (VSs). The nearby contract dominates deferred contracts in price discovery when it has more trading volume, which typically occurs until several days before the nearby enters the delivery period. The nearby contract systematically loses dominance when its relative VS dips below 50%. Also, the nearby contract plays a more important role in price discovery in the corn than in the live cattle market. Using regression analysis, we investigate the factors that are related to PS between nearby and deferred futures. We find PS is strongly related to trading volume and
days-to-expiration. In corn, PS is also related to inverse carrying charges, the nearby and deferred contracts representing different crop years, USDA reports, price declines, and commodity index rolls. Differences between corn and live cattle markets are consistent with differences in
7
This paper contributes to the literature in two ways. First, this is the first paper that uses high frequency data to study daily price discovery dynamics in physical commodities with different degrees of storability. Previous studies typically use daily data and focus on price discovery in the long run (Covey and Bessler, 1995; Yang, Bessler and Leatham, 2001). We provide day-to-day dynamics on how fast price discovery switches from the nearby contract to the next. This is especially useful to empirical research that relies on futures prices and builds a time series of rolling nearby futures prices. Two rolling techniques are common: rolling on a fixed number of days prior to expiration and rolling when volume in the first deferred overtakes volume in the nearby. Our paper shows the latter is preferable from a price discovery perspective. Second, we identify the factors that relate to PS, considering for the first time Working’s and Tomek’s predictions about the location of price discovery, as well as the effects of commodity index trading and pit trading closure.
2.2 Price Discovery Measures
Garbade and Silber (1983) first developed a measure (the GS measure) to quantify price discovery. It is based on lead-lag relationships captured by the following model of price behavior: [𝑝𝑝1,𝑡 2,𝑡] = [ 𝛼1 𝛼2] + [ 1 − 𝛽1 𝛽1 𝛽2 1 − 𝛽2] [ 𝑝1,𝑡−1 𝑝2,𝑡−1] + [ 𝜔1,𝑡 𝜔2,𝑡] (2.1) where 𝑝1,𝑡 and 𝑝2,𝑡 are the prices for nearby and deferred futures contracts at time 𝑡, repectively. The coefficients 𝛽1 and 𝛽2 measure the effect of one-period lagged deferred futures price on the current nearby futures price and vice versa, respectively. The shares:
𝐺𝑆1 = 𝛽2
𝛽1+𝛽2 , 𝐺𝑆2 = 𝛽1
8
are used for measuring the proportional contribution of each contract to the price discovery process. However, the GS measure ignores the possibility that the two prices share a common stochastic trend that represents the common efficient price being discovered.
More recent price discovery measures are derived from structural models of the data generating process based on cointegration and error correction models. Hasbrouck (1995)
information share (IS) and Harris, McInish and Wood (2002) component share (CS) are the most widely used. The fundamental value of a commodity at contract maturity (𝑤) is unknown but discovered through a dynamic process. Let 𝑤𝑡 be the fundamental value of price conditional on the information available at time t. 𝑤𝑡 is assumed tofollow a random walk:
𝑤𝑡 = 𝑤𝑡−1+ 𝑣𝑡, 𝑣𝑡~𝑁(0, 𝜎𝑣), (2.3) where 𝑣𝑡 is i.i.d. Market participants incorporate information and expectations about
fundamentals with a delay of 𝛿𝑖 periods into the observed futures price 𝑝𝑖,𝑡, as they need time to interpret the information and take appropriate positions. As a result, 𝑝𝑖,𝑡 is:
𝑝𝑖,𝑡 = 𝑤𝑡−𝛿𝑖+ 𝑠𝑖,𝑡, 𝑠𝑖,𝑡~𝑁(0, 𝜎𝑠𝑖) (2.4) where 𝑖 = 1 and 2 are nearby and deferred contracts and 𝑠𝑖,𝑡 represents i.i.d noise. Thus, price deviations from the fundamental value are only transient which results in cointegration between prices for nearby and deferred contracts. Both IS and CS are derived by estimating a (bivariate) VECM:
∆𝒑𝒕 = 𝜶(𝜷′𝒑
𝒕− 𝜇) + ∑𝐽𝑗=1𝜞𝒋∆𝒑𝒕−𝒋+ 𝒆𝒕 (2.5) where 𝒑𝒕 = (𝑝1,𝑡, 𝑝2,𝑡)′ is a vector of nearby and deferred futures prices at time 𝑡. 𝜷 ∈ ℝ2is a cointegrating vector of parameters that allows for a constant term μ which reflects the difference between nearby and deferred prices. Since storage costs are typically quoted in cents per day in commercial settings, it is reasonable to assume that they are constant within the day and thus
9
reflected in μ. The parameter vector 𝜶 = (𝛼1, 𝛼2)′ contains error correction coefficients that measure the speed at which disruptions of the long-run price equilibrium are corrected. 𝜞𝒋 ∈ ℝ2×2 is a vector of autoregressive coefficients representing short-run dynamics and 𝐽 is the number of lags in the model. The error term 𝒆𝒕 is a zero-mean vector of white noise residuals with covariance matrix:
𝛴 = ( 𝜎1
2 𝜌𝜎
1𝜎2
𝜌𝜎1𝜎2 𝜎22 ). (2.6) Harris, McInish, and Wood (2002) show CS can be calculated from the normalized orthogonal to the vector of error correction coefficients, 𝛼⊥= (𝛾1, 𝛾2)′. By noting that 𝐶𝑆1+𝐶𝑆2=1,
𝐶𝑆1 = 𝛾1 = 𝛼2
𝛼2−𝛼1, 𝐶𝑆2 = 𝛾2 = 𝛼1
𝛼1−𝛼2 (2.7) are the CS measures for nearby and deferred contracts, respectively.
The IS measures for nearby (𝐼𝑆1) and deferred (𝐼𝑆2) contracts can be derived from the error correction coefficients and the variance-covariance matrix of the error terms as follows
(Hasbrouck, 1995):
𝐼𝑆1 = (𝛾1𝑚11+𝛾2𝑚12)2
(𝛾1𝑚11+𝛾2𝑚12)2+(𝛾2𝑚22)2, 𝐼𝑆2 =
(𝛾2𝑚22)2
(𝛾1𝑚11+𝛾2𝑚12)2+(𝛾2𝑚22)2, (2.8) where 𝛾1 and 𝛾2 are the CS measures in equation (2.7), and 𝑚11, 𝑚12, and 𝑚22 are from the Cholesky factorization of the VECM residual covariance matrix, 𝛴 = 𝑀𝑀′, where
𝑀 = ( 𝜎1 0
𝜌𝜎2 𝜎2(1 − 𝜌1/2)1/2) = (
𝑚11 0
𝑚12 𝑚22). (2.9) The Cholesky factorization eliminates the contemporaneous relationship between price
innovations (Hasbrouck, 1995). However, this procedure makes the IS results order dependent. Following Baillie et al. (2002) and others, we calculate IS by averaging the measures of the two price orderings.
10
Price discovery metrics are designed to reflect the leadership in the speed in impounding new information (Hasbrouck, 1995). However, Yan and Zivot (2010), and Putniņš (2013) show that IS and CS measure a combination of speed in impounding new information and noise due to trading frictions. Although contract specifications such as tick size and price limits are the same for nearby and deferred contracts, differences in noise levels in nearby and deferred prices can be large due to differences in trading frequency or high frequency trading activities (Wang, Garcia and Irwin, 2013; Couleau, Serra and Garcia, 2019). Price discovery incorporates information into the market through active trading and higher volume, which leads to increased price updating and more microstructure noise. In contrast, less trading activity is associated with less
information entering the market, but also less noise. When the difference in noise levels between nearby and deferred is larger than the difference in the speed at which information is impounded, IS and CS may lead to an over-stating of the price discovery contribution of the contract with lower trading volume. Yan and Zivot (2010) propose a combination of IS and CS that nets out transitory frictions which cause the noise. Their measure, termed “information leadership” (IL) in Putniņš (2013), is expressed as:
𝐼𝐿1 = | 𝐼𝑆1 𝐼𝑆2 𝐶𝑆2 𝐶𝑆1| , 𝐼𝐿2 = | 𝐼𝑆2 𝐼𝑆1 𝐶𝑆1 𝐶𝑆2| (2.10) where 𝐼𝐿1 and 𝐼𝐿2 are the IL measures for nearby and deferred contracts, respectively. The IL is not a “share.” For comparability and interpretation, Putniņš (2013) defines information
leadership shares for nearby (𝐼𝐿𝑆1) and deferred (𝐼𝐿𝑆2) as:
𝐼𝐿𝑆1 = 𝐼𝐿1
𝐼𝐿1+𝐼𝐿2, 𝐼𝐿𝑆2 = 𝐼𝐿2
𝐼𝐿1+𝐼𝐿2. (2.11) Since the ILS is more robust to differences in noise, when prices are cointegrated, we use the ILS measure.
11 2.3 Data
The analysis uses corn and live cattle futures contracts traded at the Chicago Mercantile Exchange (CME). These markets represent the most actively traded storable and non-storable agricultural commodities. The sample period studied for corn is from January 14, 2008 through December 14, 2015, and the period used for live cattle ranges from January 1, 2008 to December 31, 2015. This period is characterized by a growing relevance of electronic trading in agricultural commodity futures markets. The electronic platform’s shares of corn and live cattle futures trades were about 80% and 10% at the beginning of 2008 (Irwin and Sanders, 2012), and both rose to over 95% in July 2015, after which CME closed pit trading (Gousgounis and Onur, 2017). The period examined also includes pit trade closure, price boom-bust cycles, as well as periods when the markets were inverted, i.e., when the price of deferred futures contracts was lower than the price of the nearby contract.
We use high frequency transactions prices time stamped to the second and ordered chronologically by sequence numbers. Data are obtained from CME Group’s Top-of-Book Electronic Platform database. To study price discovery, we need to define an intraday sampling frequency. Janzen and Adjemian (2017) use 1-minute sampling intervals and take the first transaction price in each 1-minute interval. When there is no transaction within a given minute, they replace the missing value using the most recent transaction price. However, this can
generate two problems. First, since trading is becoming more frequent, multiple trades can occur even within such a short-time interval, making it difficult to accurately identify which price moves first. Second, prices can vary little during periods of the day and replacing missing observations can lead to stale prices, increasing difficulties in model specification, making residuals serially dependent, and reducing the ability to accurately identify price discovery.
12
Researchers facing similar problems in empirical microstructure price discovery studies (Brogaard, Hendershott, and Riordan, 2014; Hansen and Lunde, 2006; Hasbrouck, 2018) have switched to event time analysis which in our case limits the analysis to prices which correspond to an actual transaction in at least one of the contracts. Our event time analysis is consistent with the evidence that information flows take place through trading (Kyle and Obizhaeva, 2016; Evans and Lyons, 2008). Beginning with seconds, we keep only seconds when at least one transaction occurs in either the nearby or deferred contract. In the situation where only one contract has transactions, these prices are matched with the last transaction price in the other contract.1 When the two contracts have a different number of transactions within a second, we first match them by their sequence number, then match any remaining (unmatched) transactions in one contract with the most recent transaction in the other contract. While CME electronic trading system is open nearly 24 hours a day, we only consider the day-time trading session for both the corn and live cattle contracts when the most active trading occurs. On each day, we have an average between 19 to 30 thousand observations for each contract pair in the corn market, and between 4 and 7 thousand observations for contract pairs in the live cattle market (see
supplementary result 2 for detailed summary statistics on the number of daily observations). The corn futures contract has five delivery months (March, May, July, September, and December) and live cattle futures have six delivery months (February, April, June, August, October, and December). Since volumes in the distant deferred contracts are quite low, we use the first five (four) nearby contracts for corn (live cattle), and refer to them as the nearby,
1 See supplemental result 1 for the percentage of cases where a transaction’s price in one contract is
matched with the last transaction in the other contract. We also tried using sampling intervals of 1-second and results are similar.
13
deferred 1, deferred 2, and so on. Corn futures contracts expire on the business day prior to the 15th calendar day of the delivery month and live cattle futures contracts expire on the last business day of each maturity month. We define a contract to be the nearby from the business day after the previous nearby contract expires through the current nearby contract expiration. We do not roll the nearby contract to the next, since we clearly want to identify how price discovery share in the nearby declines as expiration approaches.
2.4 Empirical Results 2.4.1 Cointegration Tests
Since the ILS, as well as CS and IS, are based on a VECM, we test for cointegration first. Daily nearby and deferred futures prices are often found to be cointegrated in the literature. However, intraday prices for nearby and deferred futures may not be cointegrated due to the presence of inverse carrying charges in a storable commodity, short-run market inefficiency (Schroeder and Goodwin, 1991), and pricing of the nearby contract being altered by delivery conditions (Garcia, Irwin and Smith, 2015).
For each sample day, we employ Johansen tests to assess cointegration between the nearby and each deferred contract. Lags for the test are selected based on the Bayesian Information Criteria (BIC) for each day. Consistent with equation (2.5), a constant term is included in the cointegrating vector to allow for storage costs. We have 1992 and 2015 sample trading days for corn and live cattle, respectively. However, we excluded slightly more than 10 days for live cattle as prices varied little due to primarily limit moves, but also because deferred contracts were not sufficiently active to allow for testing.
We follow Fricke and Menkhoff (2011) and use Johansen rank test to categorize data in each day into three categories: 1) Stationarity: intraday nearby and deferred futures prices are both
14
stationary I(0) series, in which case we fail to reject the null hypothesis of a rank of 2 at the 5% significance level. 2) Cointegration: intraday nearby and deferred futures prices are cointegrated I(1) series, in which case we fail to reject the null hypothesis of a rank of 1 at the 5%
significance level. 3) Non-cointegration: intraday nearby and deferred futures prices are both non-stationary and not cointegrated, in which case we fail to reject the null hypothesis of a rank of 0 at the 5% significance level.
Table 2.1 summarizes the percentage of days that belong to each category. The probability of both prices being stationary ranges from 8% to 11% in the corn market and about 6% across contract pairs in the live cattle market. The percentage of days in which the nearby and deferred futures are cointegrated is about 80% across all contract pairs for corn and 70% for live cattle. The percentage of non-cointegration days ranges from 4% to 12% for corn and from 16% to 27% for live cattle. The percentage of non-cointegration generally increases at more deferred
contracts. This is consistent with Tomek and Gray (1970) and Tomek (1997) and shows that contracts at more distant maturities may reflect different price information (i.e., expected supply and demand), particularly in live cattle where prices are not linked through storage costs.
Figure 2.1 and figure 2.2 present the distribution of Johansen test results through time for corn and live cattle, respectively. Each observation is colored coded to reflect the test results and located relative to the vertical axis to represent the nearby contract volume share (VS). VS equals the volume of the nearby contract divided by the total volume of the nearby and deferred
contracts on the same day. Shaded areas represent periods of inverse carrying charges. In both figures, we see VS presents a cyclic pattern, with the nearby contract’s VS decreasing as
expiration approaches and then increasing with the shift to the next nearby contract. In figure 2.1, a clear pattern emerges for corn, with most non-cointegration days (red squares) appearing in
15
periods of inverse carrying charges. This result shows that an inverted market reduces the link between different maturities in storable commodities and is consistent with Working’s (1948 and 1949) theory. Consistent with live cattle’s storable character, figure 2.2 shows
non-cointegration in live cattle does not concentrate in periods when the market was inverted. In both markets, we find that as expiration approaches, the number of non-cointegration days increases.2 Further, in the corn market nearby and deferred futures prices are less likely to be both stationary in the first few weeks after entering the nearby period.
2.4.2 Price Discovery Shares for the Nearby Contract Relative to Deferred Contracts We calculate ILS for each day when intraday nearby and deferred transaction prices are cointegrated. For days when both prices are stationary, we use the GS measure.
Non-cointegration days are not included in the price discovery analysis as these prices do not share and discover a common efficient price (Fricke and Menkhoff, 2011). We calculate daily price discovery shares for the nearby contract relative to each deferred contract separately. For ILS, the BIC recommends estimating a VECM that has between 1 and 10 lags for both commodities. Following Garbade and Silber (1983), we set negative estimates of 𝛽1 and 𝛽2 to 0 when
calculating the GS measure, since they have no conceptual meaning. Hereafter, we refer to PS as the combination of ILS and GS as they reflect the same basic notion of price discovery.
Table 2.2 reports the averages of daily price discovery and volume shares for the nearby contract and deferred contracts for corn and live cattle. Although ILS is the preferred price discovery measure when data are cointegrated, we also report CS and IS for comparison. In both markets, price discovery shares as well as VS for the nearby contract generally increase with the
16
temporal distance between the nearby and deferred contract.3 This term structure is expected
because volume and accompanying liquidity at distant horizons are usually lower which implies less market information. Although CS, IS, and ILS suggest the same term structure, in both markets, CS and IS for the nearby contract are consistently lower than the ILS when the nearby contract has a higher VS. As the CS and IS give higher share to less noisy price series relative to the ILS, their relatively lower values suggest that the more actively traded nearby contracts are noisier than deferred contracts.4 Since CS and IS are biased compared to ILS, hereafter, we focus on PS as the price discovery measure. For corn futures, the nearby contract only slightly
dominates the first deferred contract with an average PS of 53%. However, the nearby PS rises quickly when the nearby is compared to more deferred contracts. By the deferred 4 contract the nearby PS has reached 83%.
Compared to corn, the nearby live cattle contract is less dominant in price discovery. On average, the nearby contract does not provide more price discovery than the next nearby contract with an average PS of 37%. Compared to the second and third deferred contracts, the nearby contract contributes about 57% and 67% of the price discovery. Informatively, VSs for deferred 1 contract are appreciably below 50%, and only reach 50% for the deferred 2 contract suggesting much less trading in the nearby contract which again contrasts with the corn contract. For live cattle futures, since there is no storage arbitrage to link the contracts with differing maturities, contracts for different delivery dates provide information of equilibrium conditions at different
3VS and PS are not statistically different at the 5% level only in the first contract pair for corn and the
first and last contract pair for live cattle
17
future dates (Leuthold, Junkus and Cordier, 1989). Thus, the difference in the dominance of the nearby contract for corn and live cattle can be attributed to their difference in storability.
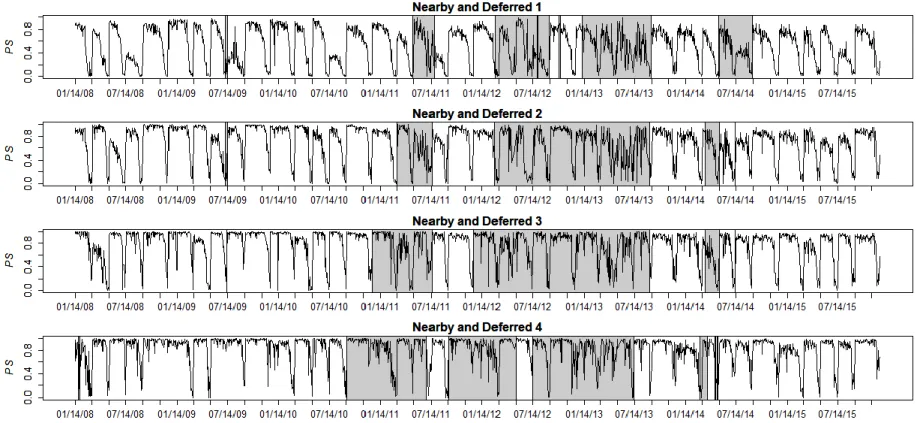
Figures 2.3 and 2.4 show the daily dynamics of PS for the nearby contract relative to each deferred contract for corn and live cattle.5 In both figures, we observe a cyclic pattern where the nearby contract’s PS decreases as expiration approaches which is similar to the behavior of VS presented in figures 2.1 and 2.2. This pattern is stable in the corn market, except when the market is inverted during which price discovery shares become more volatile. In the live cattle market, although PS follows a similar general cyclic pattern, it is more volatile relative to the corn market. Examination of the plots also suggests a dominance of the nearby contract relative to distant contracts particularly in the corn market. The nearby PS is progressively more
concentrated near the top of the PS range at more deferred contracts, which is consistent with the term structure of PS (table 2.2).
2.4.3 Price Discovery Shares in the Nearby Period for Each Contract Month
To examine more closely the behavior of price discovery, we average VS and PS for nearby contracts across years and plot them for each contract (figures 2.5 and 2.6). The horizontal axis in all plots measures the trading days to contract expiration. Because the December corn contract becomes important for hedging and pricing early in the marketing year as it reflects information on the new crop, we also compare the nearby July contract to the December contract (figure 2.5, panel 6).
PSs for corn are presented in figure 2.5 and exhibit similar patterns for most contract months, except when September is the nearby contract. Initially, most nearby contracts have a PS around 80% and continue to dominate (i.e. a share higher than 50%) price discovery until 2-3 weeks
18
prior to contract expiration. In general, the PS moves in tandem with the VS, declining sharply as trading volume decreases in the nearby contract. The nearby contract loses its dominance in price discovery nearly at the same time as it loses dominance in volume. This typically happens 2-3 weeks prior to contract expiration which roughly coincides with the beginning of the delivery window.
The notable exception to the price discovery pattern described is the September-December contract pair (figure 2.5, panel 4). While most contracts begin with a PS at nearly 80%, the September contract only initially and briefly breaks 50%, and then remains well below 40% to expiration. This suggests that the September contract does not have a dominant role in price discovery even when it is the nearby contract. Since the December contract reflects information on the new crop which becomes highly relevant in the summer months, we also examine the PS and VS for the July contract relative to December contract (figure 2.5, panel 6). This exhibits a pattern more similar to the other corn panels.6 Hence, as the July contract approaches expiration,
price discovery shifts rapidly to the December contract. The relative lack of importance of the September contract in the pricing process is likely due to its position between two crop years. Other researchers have suggested avoiding using the September contract for constructing nearby series based on its price volatility patterns (Smith, 2005) and ability to predict subsequent cash prices (Leath and Garcia, 1983). While the September contract does not dominate the price discovery process, it still accounts for 30-40% of the price discovery before entering the delivery month and therefore should not be totally ignored as a price signal. However, the leadership of
6 We also compare the December and May contracts. Results show a similar pattern, except the May
19
the December contract for such an extended period indicates that December futures prices become the focus of hedgers and market participants even early in the summer months.
Figure 2.6 plots the PS for the live cattle market. Both PS and VS exhibit a similar general downward trend across all contract months. The nearby contract loses its pricing dominance almost at the same point when VS declines below 50%. Both the dominance of price discovery and trading volume of the nearby contract switch to the next nearby contract about 2 weeks prior to the delivery, which is earlier than in the corn market. The earlier switch is likely because of the added days in delivery months in the live cattle market. Compared to the corn market, PS is more volatile in delivery in the live cattle market. The PS initially decreases but declines more slowly or remains relatively stable close to expiration. In some contract months, PS can even increase in the final trading days,7 which reflects unstable intertemporal price relationships near expiration in the live cattle market that has been widely identified in the literature (Leuthold, 1972; Naik and Leuthold, 1988). Similar behavior, although to a much less extent, can be found in the corn market which could reflect price distortions in the nearby futures in delivery found in grain markets in recent years (Garcia, Irwin and Smith, 2015).
2.4.4 Regression Analysis
In this section, we assess the relationships between the nearby contracts’ PS relative to deferred contracts and several factors using a regression framework. The analysis focuses on equations (2.12) and (2.13) for the corn and live cattle markets, respectively:
𝑃𝑆𝑐𝑜𝑟𝑛,𝑑 = 𝑓(𝑉𝑆𝑑, 𝐸𝑥𝑝𝑖𝑟𝑎𝑡𝑖𝑜𝑛𝑑, 𝐸𝑥𝑝𝑖𝑟𝑎𝑡𝑖𝑜𝑛2
𝑑, 𝐼𝑛𝑣𝑒𝑟𝑡𝑒𝑑𝑑, 𝑇𝑜𝑚𝑒𝑘𝑑,
𝑊𝐴𝑆𝐷𝐸&𝐶𝑃𝑑, 𝐺𝑅𝑆𝑑, 𝐷𝑟𝑜𝑢𝑔ℎ𝑡𝑑, 𝐶𝑟𝑎𝑠ℎ𝑑, 𝑃𝑖𝑡𝑑, 𝐼𝑛𝑑𝑒𝑥𝑟𝑜𝑙𝑙𝑑, 𝑆𝑡𝑎𝑡𝑖𝑜𝑛𝑎𝑟𝑖𝑡𝑦𝑑). (2.12)
7Examination of the individual PSs revealed that the values in figure 2.6 are not driven by outliers or
20
𝑃𝑆𝑙𝑖𝑣𝑒𝑐𝑎𝑡𝑡𝑙𝑒,𝑑 = 𝑓(𝑉𝑆𝑑, 𝐸𝑥𝑝𝑖𝑟𝑎𝑡𝑖𝑜𝑛𝑑, 𝐸𝑥𝑝𝑖𝑟𝑎𝑡𝑖𝑜𝑛2
𝑑, 𝐼𝑛𝑣𝑒𝑟𝑡𝑒𝑑𝑑,
𝐶𝐹𝑑−1, 𝑊𝐴𝑆𝐷𝐸&𝐶𝑃𝑑, 𝐺𝑅𝑆𝑑, 𝐷𝑟𝑜𝑢𝑔ℎ𝑡𝑑, 𝐷2015𝑑, 𝐼𝑛𝑑𝑒𝑥𝑟𝑜𝑙𝑙𝑑, 𝑆𝑡𝑎𝑡𝑖𝑜𝑛𝑎𝑟𝑖𝑡𝑦𝑑). (2.13) where PS is the day d price discovery share for the nearby relative contract. VS and Expiration are the nearby contract volume share and a variable that counts the number of days to expiration, respectively. Similar factors were identified as relevant in explaining PS in the VIX (Chen and Tsai, 2017) and bond futures markets (Mizrach and Neely, 2008; Fricke and Menkhoff, 2011). To allow for the non-linear pattern observed in the price discovery (Figure 2.3 and 2.4), we include a quadratic term, 𝐸𝑥𝑝𝑖𝑟𝑎𝑡𝑖𝑜𝑛2. Because we use a combination of GS and ILS as our price discovery measure, the magnitude of the PS on a given day may be affected by the price discovery measure applied. Thus, we introduce a dummy variable 𝑠𝑡𝑎𝑡𝑖𝑜𝑛𝑎𝑟𝑦 that equals one if the prices are both stationary in which case the GS is used.
To measure the relationship between PS and an inverted market, we create a dummy variable
𝐼𝑛𝑣𝑒𝑟𝑡𝑒𝑑 that equals one on days when deferred futures settlement price is below the nearby futures settlement price. We expect 𝐼𝑛𝑣𝑒𝑟𝑡𝑒𝑑 to be non-significant in the non-storable live cattle futures’ regressions. However, consistent with Working’s (1948, 1949) view of price discovery, an inverted market may be negatively correlated with PS in the storable corn market. To test Tomek’s hypothesis, we create a dummy variable Tomek, which equals 1 when the deferred contract represents a new crop year and the nearby contract represents the old crop. As the nearby and deferred 4 contracts always represent prices for different crop years, the dummy variable Tomek is not included in the equation for those contracts. As predicted by Tomek and Gray (1970) and Tomek (1997), we expect the nearby contract to have a smaller share of price discovery when nearby and deferred contracts represent prices for different crop years.
21
In addition, we include several market factors which may be related to the price discovery process. The first is USDA market reports which impart important information about
fundamentals that is quickly reflected in futures prices across maturities (McKenzie, 2008; Adjemian, 2012; Dorfman and Karali, 2015). For the corn market, we consider three important USDA grain market reports: World Agricultural Supply and Demand Estimate (WASDE) report, Crop Production (CP) report and Grain Stocks (GRS) report. Since the WASDE and CP reports are usually released in the second week of each month on the same day, we create a single dummy variable 𝑊𝐴𝑆𝐷𝐸&𝐶𝑃 for the two reports. The GRS report releases are quarterly and release days, captured by the dummy variable 𝐺𝑅𝑆, are usually in mid-January and the end of March, June and September. For live cattle, we use the Cattle on Feed (captured by the dummy variable 𝐶𝐹) report that has the largest impact on the live cattle market among all USDA reports (Isengildina, Irwin, and Good, 2006). We also include corn market reports as corn is used as feed for live cattle.8
Another set of factors is included to account for period events. Both markets experienced dramatic price declines which we capture through the dummy 𝐶𝑟𝑎𝑠ℎ. For corn, 𝐶𝑟𝑎𝑠ℎ equals one from July 03, 2008 when prices peaked to December 08, 2008 when prices hit bottom. The brief period of rapid corn price declines from August 09, 2012 to September 14, 2012, which followed a run up due to the severe drought in the summer of 2012, is captured by the dummy
8 Grain market reports are released either before market opening or during the regular trading session and
thus should affect prices on the release day. CF reports are released on the third Friday of each month after regular trading hours and thus should affect price the next day. Therefore, the dummy variables for the grain market reports equal 1 on the release day and the dummy variable for CF reports equals 1 on the following trading day.
22
variable 𝐷𝑟𝑜𝑢𝑔ℎ𝑡. During this one-month period, corn nearby futures price declined 7.89%. Since the drought also affected the live cattle market, the variable 𝐷𝑟𝑜𝑢𝑔ℎ𝑡 for live cattle equals 1 from December 19, 2012, when nearby futures’ price peaked at 134.40 cents/lb after the drought, to May 20, 2013 when the price bottomed at 118.00 cents/lb. A more sustained collapse in cattle prices occurred in 2015 causing concerns about the price discovery function of the live cattle futures market. This period overlaps the time of CME’s pit trading closure, which was announced in February 2015 and started officially in July 2015. Therefore, we create the dummy
𝐷2015 which equals 1 in the year of 2015, to capture the possible joint price decline and pit closure. The corn market remained relatively stable during 2015, providing a good opportunity for identifying changes related to the pit trading closure. Consistent with Gousgounis and Onur (2017), we create a dummy variable 𝑃𝑖𝑡 that equals 1 after February 4, 2015 when the closing of pit trading was announced for corn.9 Commodity index funds have increased investments in commodity futures markets (Irwin and Sanders, 2012). These funds typically follow a predetermined schedule to roll their positions from the nearby to the next nearby contract. Considering the vast position changes involved in the rolling process, changes may occur in the discovery process. We include a dummy variable 𝐼𝑛𝑑𝑒𝑥𝑟𝑜𝑙𝑙 that equals 1 between the fifth and tenth business days of the month prior to expiration, which includes the roll periods of the two largest commodity indices: S&P Goldman Sachs and Dow Jones UBS commodity indices. 2.4.5 Regression Results
Regression models are estimated for each pair of contracts in corn and live cattle markets using the OLS and presented in Table 2.3 and 2.4, respectively. Heteroscedasticity and autocorrelation
23
robust standard errors using the Newey-West (1994) estimator are presented in parentheses and adjusted R-squared values are in the lower panel in each table. Adjusted R-squared values in corn models are consistently higher than in live cattle models, reinforcing the graphical analysis which demonstrates that price discovery in the corn market is more correlated with observable variables than in the live cattle market. In each market, R-squared values decrease as the length of time between the nearby and deferred contracts increases, indicating the model fits better for contract pairs with closer maturities. The coefficients for stationarity are not significant
suggesting that our results are robust to the selection of price discovery measures.
Consistent with the economic intuition that information is incorporated in the market through volume, the VS coefficient is significant and positive across contract pairs in both markets. A 1% increase in the nearby contract’s VS is associated to a 0.56% to 0.69% increase in the nearby contract’s PS in the corn market, and between 0.30% and 0.39% in the live cattle market.
In the corn market, the coefficients of the days to expiration variable and its quadratic term are both significant. The coefficients of Expiration are positive and indicate that one day closer to contract expiration is associated with a 0.6%-1.1% decrease in the nearby contact’s PS. The significant negative Expiration2 parameters indicate the decline in PS occurs in a non-linear fashion, first declining gradually and then dropping off more sharply as expiration approaches. The relationship between days-to-expiration and PS is only significant in the first contract pair in the live cattle market. The coefficient of Expiration in the nearby and deferred 1 contract pair is significant and negative, while its quadratic term is significant and positive. This evidence supports the earlier observation in figure 2.6 that the PS for the live cattle nearby contract declines as expiration approaches but can increase in the last few days.
24
The coefficients of Inverted and Tomek provide some support for the implications of Working’s and Tomek’s theories on price discovery. Consistent with Working’s theory, price discovery along the forward curve is uncorrelated with the inverted market indicator in the non-storable live cattle market. In the corn market and for the first deferred pair, the nearby contract’s PS increases about 6.8% when the market is inverted. However, in the other corn contract pairs, the PS is not significantly related to Inverted. As expected, the coefficient for Tomek has a negative sign in all cases, albeit it is not statistically different from zero in the nearby and first deferred contract pair. These findings indicate a decline in the price discovery dominance of the nearby contract when the deferred contract represents a different crop year.
The correlations of PS with USDA reports, price declines and commodity index position rolls, are significant in the corn market but not in the live cattle market. In addition, no statistically significant relationship between the closure of pit trading and PS along the forward curve are found in either market. On average, the PSs for corn nearby contracts are generally lower on USDA report days. Coefficients for WASDE&CP are negative across all contract pairs and statistically different from zero in the second and third pairs. There is a statistically significant and negative correlation between GRS and PS in the nearby and deferred 4 contract pair. The result likely reflects that grain reports contain outlook information and market participants use this information to adjust their forecasts for longer horizons, therefore improving price discovery in deferred contracts. These findings are consistent with Tomek and Gray’s (1970) and Tomek’s (1997) view that futures along the forward curve provide information about expected future supply-demand information.
Several small positive relationships between price declines and PS are found in the corn market. PS is correlated with the dummy Drought. During that period, the PS of the nearby
25
contract relative to the second deferred contract significantly increased by 4.4%. However, no significant coefficients are found in other contract pairs. The response to the July-early December 2008 crash in prices appears more relevant. Nearby and deferred 1 contracts
responded similarly to the sharp decline in prices. At more distant horizons, the nearby contracts, which were most closely tied temporally to the initial sharp decline and possessed greater
liquidity, responded more quickly. The insignificant coefficient in the nearby and deferred 4 contract pair is positive and follows what appears to be a declining importance of the nearby contract through time.
Index commodity roll periods are positively correlated with the PS of the nearby contract for the first two contract pairs. However, the magnitude and significance of the parameter decreases from 3.9% in the first contract pair to 3.6% in the second contract pair and becomes insignificant in the third and fourth contract pairs. Several studies have documented a “sunshine trading effect,” which consists of a predetermined commodity index roll period attracting counterparties and increasing liquidity supply (Shang, Mallory and Garcia, 2018). Since traders are highly concentrated in the nearby contract during index rolling periods (Aulerich, Irwin and Garcia, 2014), one possible explanation for the positive correlation between index rolling and PS could be that liquidity improvement caused by the “sunshine trading effect” is more pronounced in nearby contracts than deferred contracts.
2.5 Conclusions
Understanding price discovery along the futures forward curve is important for market participants in making sound trading, hedging, and production decisions. In the corn and live cattle futures markets, we quantify price discovery using intraday data, and graphical and
26
the closure of pit trading. We measure the price discovery share between nearby and deferred contracts and identify when the dominance of price discovery switches between contracts. We also estimate the importance of the factors related to price discovery.
Our results provide nuanced support for the theory of price of storage. We find price discovery is more dominated by the nearby contract in the storable corn market than the non-storable live cattle market. In addition, except when the market is inverted, intraday nearby and deferred futures prices are more likely to be cointegrated in the storable corn market than in the non-storable live cattle market. However, deferred contracts play a non-trivial role in price discovery not only in the non-storable live cattle market, but also in the storable corn market, particularly when the deferred contract prices represent a new crop year. This demonstrates the importance of futures’ forward pricing role in price discovery as argued by Tomek and Gray (1970) and Tomek (1997).
The price discovery share of the nearby contract decreases in both markets as expiration approaches and trading becomes less active. The nearby contract leadership in price discovery is tightly related to trading volume. This finding has a practical implication for researchers and practitioners who need to construct a continuous series of nearby contracts. Since price discovery is closely linked to volume share, we recommend rolling to the next nearby contract when it achieves more than 50% of the volume share, instead of using date-based methods. Another informative finding is that the September corn contract rarely dominates the next nearby
(December) contract. This suggests that price discovery is dominated by the December contract as early as the beginning of July.
The regression results show in both markets the share of price discovery along the forward curve is strongly linearly correlated with trading volume and nonlinearly correlated with time to
27
expiration. Other market-related factors only have statistically meaningful correlations with the share of price discovery in the corn market. During periods of price declines and commodity index rolls, price discovery in the corn market is more likely to concentrate in the more traded nearby contract than in deferred contracts. Consistent with Working’s theory, we find that an inverted market increases price discovery in the corn nearby contract, though only in the first deferred pair. In addition, Tomek and Gray’s (1970) and Tomek’s (1997) view that futures not only provide guidance for carrying inventories but also forecasts of expected futures prices, is supported. We find that deferred contracts’ price discovery role becomes more important when they represent a new crop year and on days when the USDA releases important forward-looking market information.
Overall, while the result that price discovery occurs principally in nearby futures contracts is consistent with earlier more descriptive analyses based on daily prices (e.g., Working, 1948, 1949; Tomek, 1997; Leuthold et al., 1989), our findings highlight the dynamic and systematic aspects of the price discovery process in agricultural markets. Differences exist between storable and non-storable markets, but their importance in price discovery can also vary in time and by market. Despite these differences, the clear relationship across markets between volume share and relative price discovery is striking. Informatively, while nearby contracts tend to dominate the price discovery process, we identify the non-trivial role that deferred contracts play in today’s fast-moving markets. This information should be of value to the pricing and hedging decisions that market participants make and to researchers interested in uncovering relevant relationships in electronically traded agricultural markets. Future research might expand our analysis to other markets, examine the relationships at more disaggregate temporal units and
28
intervals within the day, and focus more specifically on how the intraday price discovery process changes on USDA announcement days.
29 2.6 Tables and Figures
Table 2.1 Distribution of Days Based on Johansen Rank Test Results, 2008-2015
Stationarity Cointegration Non-cointegration Total
Corn
Nearby and Deferred 1 11.75% 84.14% 4.11% 1992
Nearby and Deferred 2 9.59% 83.89% 6.52% 1992
Nearby and Deferred 3 8.89% 83.28% 7.83% 1992
Nearby and Deferred 4 8.38% 79.62% 12.00% 1992
Live Cattle
Nearby and Deferred 1 6.85% 75.73% 16.92% 2005
Nearby and Deferred 2 5.91% 72.26% 21.29% 2003
Nearby and Deferred 3 5.61% 65.76% 27.99% 2002
Note: Results are based on Johansen rank hypothesis tests between intraday nearby and deferred futures prices at the 5% significance level using trace statistics. Percentages are given as
30
Table 2.2 Average Price Discovery and Volume Shares for the Nearby Contract, 2008-2015
Contract Pair CS IS ILS GS PS VS
Corn Nearby vs Deferred 1 0.515 0.504 0.535 0.571 0.537 0.532 Nearby vs Deferred 2 0.473 0.590 0.697 0.724 0.699 0.700 Nearby vs Deferred 3 0.524 0.662 0.784 0.761 0.783 0.797 Nearby vs Deferred 4 0.438 0.701 0.830 0.801 0.831 0.855 Live cattle Nearby vs Deferred 1 0.425 0.394 0.369 0.571 0.367 0.332 Nearby vs Deferred 2 0.569 0.550 0.574 0.724 0.571 0.504 Nearby vs Deferred 3 0.517 0.637 0.680 0.761 0.672 0.621 Note: Days with cointegrated I(1) intraday nearby and deferred prices are used for CS, IS, and ILS. Days with stationary intraday nearby and deferred prices are used for the GS. PS represents the combination of ILS and GS estimates. VS is the nearby contract’s volume share that equals the volume of the nearby contract divided by the total volume of the nearby and deferred contracts on the same day.
31
Table 2.3 Regression Results for the Corn Futures Contracts, 2008-2015
Nearby and Deferred 1 Nearby and Deferred 2 Nearby and Deferred 3 Nearby and Deferred 4 VS 0.683*** 0.560*** 0.625*** 0.687*** (0.037) (0.041) (0.043) (0.057) Expiration 0.007*** 0.011*** 0.009*** 0.006*** (0.002) (0.002) (0.002) (0.002) Expiration2 -0.000** -0.000*** -0.000*** -0.000** (0.000) (0.000) (0.000) (0.000) Inverted 0.068*** 0.009 -0.007 -0.005 (0.014) (0.017) (0.014) (0.013) Tomek -0.026 -0.043*** -0.027* (0.016) (0.013) (0.013) WASDE & CP -0.022 -0.044** -0.071*** -0.043 (0.013) (0.017) (0.021) (0.025) GRS 0.006 0.012 -0.021 -0.101* (0.035) (0.042) (0.038) (0.049) Drought -0.005 0.044* 0.038 -0.002 (0.023) (0.021) (0.050) (0.046) Crash -0.010 0.062* 0.067*** 0.044 (0.017) (0.027) (0.019) (0.024) Pit 0.011 -0.004 -0.014 -0.009 (0.010) (0.014) (0.017) (0.017) Indexroll 0.039*** 0.036** 0.006 0.012 (0.010) (0.012) (0.014) (0.012) Stationarity 0.013 0.036*** 0.010 -0.006 (0.008) (0.010) (0.011) (0.011) Intercept 0.038** 0.081*** 0.112*** 0.103* (0.014) (0.024) (0.032) (0.042) Adjusted R2 0.78 0.70 0.64 0.52 Observations 1908 1861 1834 1752
Note: VS is the nearby contract’s volume share. Expiration is the number of days to the nearby contract’s expiration. Inverted is a dummy variable for days in which deferred futures settlement price was below nearby futures settlement price. WASDE&CP is a dummy variable for USDA WASDE and Crop Production report days. GRS is a dummy variable for USDA Grain Stocks report days. Drought is dummy variable for the period of declining corn prices following the 2012 drought. Crash is a dummy variable for the corn market crash period in 2008. Pit is a dummy variable for days after CME’s pit closure announcement. Tomek is a dummy variable which equals 1 when the deferred contract represents a new crop year and the nearby contract represents prices for the old crop. Stationarity is a dummy variable for days in which intraday nearby and deferred prices were both stationary. Heteroscedasticity and autocorrelation robust standard errors are reported in parenthesis. Asterisks ***, **, and * indicate significance at the 0.1%, 1%, and 5% levels.
32
Table 2.4 Regression Results for the Live Cattle Futures Contracts, 2008-2015
Nearby and Deferred 1 Nearby and Deferred 2 Nearby and Deferred 3
VS 0.305*** 0.387*** 0.348*** (0.081) (0.079) (0.080) Expiration -0.008** 0.005 0.006 (0.003) (0.003) (0.004) Expiration2 0.000*** 0.000 0.000 (0.000) (0.000) (0.000) Inverted -0.011 0.020 0.011 (0.013) (0.016) (0.019) CF 0.036 -0.009 -0.041 (0.028) (0.030) (0.033) WASDE & CP -0.026 -0.049 -0.013 (0.020) (0.026) (0.028) GRS 0.041 0.041 0.015 (0.049) (0.052) (0.043) Drought -0.019 -0.032 0.029 (0.015) (0.024) (0.027) D2015 -0.007 -0.045 0.014 (0.023) (0.050) (0.050) Indexroll 0.008 -0.002 -0.004 (0.013) (0.016) (0.018) Stationarity -0.025* -0.021 -0.028* (0.011) (0.013) (0.014) Intercept 0.294*** 0.242*** 0.295*** (0.026) (0.026) (0.034) Adjusted R2 0.29 0.27 0.21 Observations 1661 1570 1436
Note: VS is the nearby contract’s volume share. Expiration is the number of days to the nearby contract’s expiration. Inverted is a dummy variable for days in which deferred futures settlement price was below nearby futures settlement price. CF is a dummy variable for the trading day following the release of Cattle on Feed report. WASDE&CP is a dummy variable for USDA WASDE and Crop Production report days. GRS is a dummy variable for USDA Grain Stocks report days. Drought is dummy variable for the period of declining live cattle prices following the 2012 drought. D2015 is a dummy variable for the year of 2015. Indexroll is a dummy variable for commodity index rolling periods. Stationarity is a dummy variable for days in which intraday nearby and deferred prices were both stationary. Heteroscedasticity and autocorrelation robust standard errors are reported in parenthesis. Numbers are rounded to the third decimal place. Asterisks ***, **, and * indicate significance at the 0.1%, 1%, and 5% levels.
33
Figure 2.1 Johansen Rank Test Results and Volume Shares for the Corn Futures Contracts, 2008-2015
Note: Shaded areas represent backwardation periods. Corn futures contracts expire on the business day prior to the 15th calendar day of the maturity month.
0 .0 0 .4 0 .8 V o lu m e S h a re 01/14/08 07/14/08 01/14/09 07/14/09 01/14/10 07/14/10 01/14/11 07/14/11 01/14/12 07/14/12 01/14/13 07/14/13 01/14/14 07/14/14 01/14/15 07/14/15 01/14/16 0 .0 0 .4 0 .8
Nearby and Deferred 1
V o lu m e S h a re 0 .0 0 .4 0 .8 V o lu m e S h a re 01/14/08 07/14/08 01/14/09 07/14/09 01/14/10 07/14/10 01/14/11 07/14/11 01/14/12 07/14/12 01/14/13 07/14/13 01/14/14 07/14/14 01/14/15 07/14/15 01/14/16 0 .0 0 .4 0 .8
Nearby and Deferred 2
V o lu m e S h a re 0 .0 0 .4 0 .8 V o lu m e S h a re 01/14/08 07/14/08 01/14/09 07/14/09 01/14/10 07/14/10 01/14/11 07/14/11 01/14/12 07/14/12 01/14/13 07/14/13 01/14/14 07/14/14 01/14/15 07/14/15 01/14/16 0 .0 0 .4 0 .8
Nearby and Deferred 3
V o lu m e S h a re 0 .0 0 .4 0 .8 V o lu m e S h a re 01/14/08 07/14/08 01/14/09 07/14/09 01/14/10 07/14/10 01/14/11 07/14/11 01/14/12 07/14/12 01/14/13 07/14/13 01/14/14 07/14/14 01/14/15 07/14/15 01/14/16 0 .0 0 .4 0 .8
Nearby and Deferred 4
V o lu m e S h a re
34
Figure 2.2 Johansen Rank Test Results and Volume Shares for the Live Cattle Futures Contracts, 2008-2015
Note: Shaded areas represent backwardation periods. Live cattle futures contracts expire on the last business day of the maturity month. 0 .0 0 .4 0 .8 V o lu m e S h a re 01/01/08 07/01/08 01/01/09 07/01/09 01/01/10 07/01/10 01/01/11 07/01/11 01/01/12 07/01/12 01/01/13 07/01/13 01/01/14 07/01/14 01/01/15 07/01/15 01/01/16 0 .0 0 .4 0 .8
Nearby and Deferred 1
V o lu m e S h a re 0 .0 0 .4 0 .8 V o lu m e S h a re 01/01/08 07/01/08 01/01/09 07/01/09 01/01/10 07/01/10 01/01/11 07/01/11 01/01/12 07/01/12 01/01/13 07/01/13 01/01/14 07/01/14 01/01/15 07/01/15 01/01/16 0 .0 0 .4 0 .8
Nearby and Deferred 2
V o lu m e S h a re 0 .0 0 .4 0 .8 V o lu m e S h a re 01/01/08 07/01/08 01/01/09 07/01/09 01/01/10 07/01/10 01/01/11 07/01/11 01/01/12 07/01/12 01/01/13 07/01/13 01/01/14 07/01/14 01/01/15 07/01/15 01/01/16 0 .0 0 .4 0 .8
Nearby and Deferred 3
V o lu m e S h a re 01/01/08 07/01/08 01/01/09 07/01/09 01/01/10 07/01/10 01/01/11 07/01/11 01/01/12 07/01/12 01/01/13 07/01/13 01/01/14 07/01/14 01/01/15 07/01/15 01/01/16
35
Figure 2.3 Price Discovery Shares for the Nearby Contract Compared to Deferred 1, 2, 3, And 4 Contracts in the Corn Futures Market, 2008-2015
Note: Shaded areas represent backwardation periods. Corn futures contracts expire on the business day prior to the 15th calendar day of the maturity month.
36
Figure 2.4 Price Discovery Shares for the Nearby Contract Compared to Deferred 1, 2, and 3 Contracts in the Live Cattle Futures Market, 2008-2015
Note: Shaded areas represent backwardation periods. Live cattle futures contracts expire on the last business day of the maturity month.
37
Figure 2.5 Price Discovery and Volume Shares in the Nearby Period for each Contract Month in the Corn Futures Market, 2008-2015
Note: Panels show the average over years of volume share of nearby relative to the first deferred and price discovery share between nearby and first deferred contract. The information is
38
Figure 2.6 Price Discovery and Volume Shares in the Nearby Period for each Contract Month in the Live Cattle Futures Market, 2008-2015
Note: Panels show the average over years of volume share of nearby relative to the first deferred and price discovery share between nearby and first deferred contract. The information is
39 2.7 Supplementary Results
Supplementary Result 1
Supplemental Table 2.1 Percentage of Replaced Observations for each Contract Pair in the Corn Market, 2008-2015
Contract Pair 1 Contract Pair 2 Contract Pair 3 Contract Pair 4 Nearby Deferred 1 Nearby Deferred 2 Nearby Deferred 3 Nearby Deferred 4
Mean 37.33% 46.84% 22.14% 68.17% 16.03% 78.60% 12.34% 83.71%
Min 0.56% 0.00% 0.03% 0.04% 0.01% 0.14% 0.00% 0.91%
Max 99.96% 93.40% 99.88% 99.40% 99.79% 99.75% 98.82% 99.90%
S.D 37.43% 35.20% 32.29% 32.33% 28.39% 29.49% 24.50% 25.34%
Note: percentage of cases where a transaction’s price in one contract is matched with the last transaction in the other contract. While not shown here, these percentages follow a dynamic pattern consistent with volume (they grow for the nearby and decline for the first deferred contract as the nearby contract approaches expiration).
Supplemental Table 2.2 Percentage of Replaced Observations for each Contract Pair in the Live Cattle Market, 2008-2015
Contract Pair 1 Contract Pair 2 Contract Pair 3 Nearby Deferred 1 Nearby Deferred 2 Nearby Deferred 3 Mean 57.53% 23.17% 39.06% 50.10% 29.46% 63.97%
Min 3.99% 0.00% 2.44% 0.49% 1.27% 0.59%
Max 99.89% 80.98% 99.39% 89.80% 99.41% 96.76% S.D 28.83% 21.30% 27.21% 24.26% 24.70% 23.87%
Note: percentage of cases where a transaction’s price in one contract is matched with the last transaction in the other contract. While not shown here, these percentages follow a dynamic pattern consistent with volume (they grow for the nearby and decline for the first deferred contract as the nearby contract approaches expiration).
40 Supplementary Result 2
Supplemental Table 2.3 Number of Daily Observations for each Contract Pair in the Corn Futures Market, 2008-2015
Nearby and Deferred 1 Nearby and Deferred 2 Nearby and Deferred 3 Nearby and Deferred 4
Mean 29,662 22,191 20,168 19,473
Minimum 696 665 253 131
Maximum 152,565 152,059 150,931 154,009
Median 23,868 15,793 14,382 13,756
Standard Deviation 19,607 19,222 18,383 18,423
Supplemental Table 2.4 Number of Daily Observations for each Contract Pair in the Live Cattle Futures Market, 2008-2015
Nearby and Deferred 1 Nearby and Deferred 2 Nearby and Deferred 3
Mean 7,224 4,471 3,901
Minimum 249 96 28
Maximum 30,815 29,024 27,689
Median 6,778 3,509 2,732
41 Supplementary Result 3
Corn Live cattle
Supplemental Figure 2.1 Histograms of Days when Intraday Nearby and Deferred Futures Prices were not Cointegrated, 2008-2015
Note: Histograms for corn and live cattle are in the left and right panels, respectively.
Corn Live cattle
Supplemental Figure 2.2 Histograms of Days when Intraday Nearby and Deferred Futures Prices were both Stationary, 2008-2015