Centralizing information improves market efficiency
more than increasing information:
Results from experimental asset markets
*Iván Barreda-Tarrazonaa, 1, Gianluca Grimaldaa, c,
Andrea Morone a, b, Simone Nuzzob, Andrea Teglioa aLEE & Economics Department, Universitat Jaume I, Castellón, Spain
b Dipartimento di Economia, Management e Diritto d’impresa, Università degli Studi di Bari, Aldo Moro, Italy
c Institut für Weltwirtschaft, Kiel, Germany
Abstract
We study the relationship between market efficiency and the distribution of private information in experimental financial asset markets. Traders receive imperfect signals over the real value of an asset. Agents can share their information within a relatively small – compared to market size - group of agents. Both the number of signals and the way these are allocated among agents are manipulated in four experimental treatments. In two treatments signals are evenly distributed among agents. In two other treatments one group of ‘quasi-insider’ agents receives more signals than all other groups. In the baseline condition no signal is distributed. We show that centralizing information unambiguously achieves higher market efficiency than spreading information evenly. Furthermore, increasing the amount of information has no effect on efficiency either when information is symmetric or when it is asymmetric. We argue that two complementary mechanisms drive these results. First, having more private information ex ante induces traders to rely on their own signals, reducing the expected benefits of sharing information. Second, the presence of quasi-insider being common knowledge prompts agents to extract more information from market prices rather than their own private signals. This leads to swift information aggregation.
Key words: Experimental Markets; Information Aggregation; Market Cooperation
*Financial support by Universitat Jaume I (project P1.1B2015-48) and the Spanish Ministry of Economics and Competitiveness (projects ECO2013-44409-P and ECO2015-68469-R) is gratefully acknowledged.
1Corresponding author: LEE & Economics Department, Universitat Jaume I, 12071 Castellón, Spain. E-mail address: [email protected].
Introduction
The capacity of markets to efficiently aggregate privately dispersed information has been a central topic in economics since Adam Smith and von Hayek. In the context of financial markets, Fama (1965) defines a market as efficient whenever prices "fully reveal" the information dispersed in the market. Intuitively, efficiency can be achieved because traders owning private information on the real value of an asset – so-called “insiders” - will seek to profit whenever prices do not fully embody their own private information. If markets are efficient, insiders’ private information is in the long run worthless and insiders cannot realize higher gains than other traders. In the short run, uninformed traders can try to infer the existence of insider information from the observation of trading activity, in order to also realize profits. This can either accelerate the process of convergence toward the equilibrium, or drive it astray if uninformed traders are mistaken in their inferences, as the literature on informational cascades demonstrates (Bikhchandani et al., 1998).
The experimental literature has extensively examined the conditions at which financial markets achieve efficiency (see the next section for a review). However, this is normally done in settings where agents are either fully informed or not informed, and have no connections with others. In this paper we generalize on both of these conditions. We allow for all agents to have imperfect information and for some agents – whom we call “quasi-insiders” - to have close-to-perfect information. We vary the overall amount of information available in the market and the way this is distributed among agents. In particular, in a two-by-two design, information is either equally distributed among traders or is unequally distributed. In the latter case, “quasi-insiders” receive a higher amount of information than other agents. Moreover, the overall quantity of information is also modified across our experimental conditions.
Secondly, we introduce a simple network structure in our financial markets. Each agent is connected with two other agents and each has the option to share their own private information with the two other agents in their group. The importance of networks in financial markets has been stressed both theoretically and empirically. According to Aboulafia, (1997), financial markets are embedded into a vast and dense network of customary codes of conducts, mutual expectations of appropriate behavior, and trust among individual agents. In fact, some accounts stress that the breakdown in the networks of trust among financial agents played a major role in precipitating and
aggravating the 2008 financial crisis (Kirman, 2010; Anand et al., 2013). According to this view, financial markets may share some characteristics with standard markets for goods, where social norms and trust networks can cause the actual market price to depart from the Walrasian price (Greif, 1993). The effect of trust network in financial markets is a largely unexplored issue. We are the first, to the best of our knowledge, to examine it experimentally. Our main research question is whether and how the amount, distribution, and the spreading of information through the network, increase market efficiency.
Except for the baseline condition where no agent receives any information, in all other experimental conditions all agents receive some noisy signals on the fundamental value of the asset. Such signals only reveal the real value of the asset with 70% probability. We consider two cases where each agent is either allocated the same number of signals as all others or where some “quasi-insiders” are endowed with a larger number of signals. The overall number of signals distributed in the market before transactions is also manipulated across experimental conditions.
Our framework enables us to study two different mechanisms for the diffusion of information in the market. The first is what we call a “leadership mechanism”, where it is common knowledge that one group of quasi-insiders within the market owns ex ante more informative signals than all other groups. In some cases quasi-insiders can expect to know the real value of the asset with probability greater than 95%2. We expect that
this mechanism will have important consequences on “information disclosure” (see next section) and thus on market efficiency. On the one hand, quasi-insiders will presumably try to gain from their informational advantage, and their trading activity should, ceteris paribus, drive the asset price in the direction of the fundamental value faster than in other cases. On the other hand, less informed traders may pay more attention to the price adjustments within the market, because the presence of quasi-insiders should make them aware of the possibility that prices move in the direction of the fundamental faster than in other cases.
The second channel is what we call a “cooperation mechanism”, whereby agents can share their private signal(s) within groups formed by three members, and can in
2The term “insider” normally characterizes traders who know with probability one the real value of the
asset. Since in our study traders having informational advantage can never be absolutely certain of the real value of the asset, we prefer to call them “quasi-insiders”. See also section 2.
turn receive the information shared by the other two members of their group. This is done before trading starts, so agents can access the market with a larger number of per capita signals, if others in their group have decided to share. In the cooperation mechanism, information is therefore multiplied if agents decide to share. If cooperation does occur, we expect that transactions will become more informative and, in aggregate, prices may incorporate the available information. Manipulating the quantity of signals owned by quasi-insiders makes it possible to speculate over the relative strength of these two factors.
Our experimental design includes a baseline condition where no information is available to agents, and four treatment conditions that vary both the amount and the concentration of signals. Information is evenly distributed among agents in two of such treatments,, but the total number of signals is tripled in one treatment compared to the other. That is, in one treatment each agent receives one signal, while in the other treatment each agent receives three signals. In two other conditions information is unevenly distributed between one group of quasi-insiders and three groups of non-insiders. In these two conditions the total number of signals is kept constant. This enables us to evaluate the impact on efficiency of modifying the distribution of signals from even to uneven.
In order to better appreciate the relevance of each of the two mechanisms illustrated above, we draw on two different price benchmarks. The first is the “Bayesian price”. This is the price that would result if all traders aggregated the information at their disposal rationally – namely, according to the Bayes rule – after traders have decided whether to share their signals within their group or not. More precisely, individual Bayesian prices are computed for each trader, and the market Bayesian price is calculated as the arithmetic mean of such individual prices. The second notion is what we call “Fama-market efficiency”, and draws on the idea set out at the beginning of the paper that prices should incorporate all the information present in the market. For Fama-efficiency we do not consider signals being shared in the “cooperation stage”, but we only consider the information available before such a stage. Here we compute what we call the “Fama-efficient” price as that resulting from the assumption that each agent knew the whole information present in the market.
We find that the “leadership mechanism” unambiguously brings about more efficiency than the "cooperation mechanism”. Interestingly, we also find that increasing
the quantity of signals does not necessarily lead to appreciable gains in efficiency. In particular, efficiency is not higher in the symmetric treatment having thrice as many signals as the alternative symmetric treatment. Likewise, efficiency is not higher in the asymmetric treatment having overall twice as many signals as the alternative asymmetric treatment. Nonetheless, the two asymmetric treatments bring about appreciably more efficiency than the symmetric ones. We speculate that the main driver of this result is non-insiders extracting information from market prices more actively than in symmetric treatments.
Our study is of interest for the theoretical issue of whether markets are capable of efficiently aggregating and disseminating private information. We innovate on previous literature (see next section) by generalizing the standard framework in the two directions mentioned above. That is, we allow for all agents to receive imperfect signals, comparing cases of equal distribution of the information and unequal distribution. We also introduce a network structure whereby agents can share their private information. We believe that our study is also relevant for policy issues. Investigating how market efficiency is affected by increasing information or spreading it more evenly, and how information spreads within networks, are all important questions for the optimal management of financial markets. Both in normal times but, even more so, in times of “crisis”, financial authorities may decide to release additional pieces of information to stabilize markets. Our experimental evidence may help understand how to do this optimally.
The remainder of the paper is organized as follows. In the next section we present a review of relevant literature and in the third section the experimental design. In section 4 we present the methodology of the analysis, then in section 5 we report the results obtained. Sections 6 discusses the results and 7 conclude.
2 Related Literature
Experimental studies dealing with informational efficiency are typically divided into three types. The first one is the dissemination of information from identically informed agents - normally referred to as “insiders” - to uninformed traders (Plott and Sunder, 1982). The second strand includes studies about information aggregation among market participants with less than perfect information (Plott and Sunder, 1988). The third one focuses on the simultaneous equilibrium in asset and information markets
(Sunder, 1992). Theoretically, the information aggregation process can be expected to be more sluggish in achieving market efficiency than the dissemination one. In the dissemination case insiders’ transactions release unambiguous signals about the value of the asset, at least when the presence of insiders is common knowledge. Conversely, in the aggregation case the process of retrieving information is by construction subject to errors. Consequently, making inference on the true state of the world is more problematic in the latter case. Comprehensive recent surveys on experimental financial markets can be found in Noussair and Tucker (2013), and Morone and Nuzzo (2016).
Hayek (1945) and Muth (1961) argued that markets never fail in aggregating the available information. In a pioneering work, Plott and Sunder (1988) studied information aggregation in three differently designed markets and showed that this is not generally the case. In particular, while the price mechanism efficiently aggregated the dispersed information both in markets where participants traded a complete set of Arrow-Debreu securities and in markets where traders had identical payoff structures, aggregation failed in single security markets where traders were paid different dividends upon the realization of uncertainty. The authors explained this result arguing that traders cannot infer the contingent state of the market from other agents’ trading behavior when their payoff structures differ. Forsythe and Lundholm (1990) found that, in spite of heterogeneous dividend structures in incomplete markets, information was correctly aggregated whenever the dividend distribution was common knowledge among traders and the subjects had previously experienced the trading institution.
Other studies found even more negative results on the capacity of markets to aggregate information under more general conditions than the ones considered in previous studies. O'Brien and Srivastava (1991) showed that, even with uniform and common dividend distributions, markets did not manage to aggregate the dispersed information if some elements of complexity (multi-period assets, no common knowledge about information distribution) are introduced in the market design. Noeth et al. (1999) found that information aggregation might be hindered by the existence of “information traps”. In particular, misaligned patterns, in which actions are based on wrong beliefs about others’ informative set, can result in information not being correctly revealed into prices. Brandouy et al. (2000) provided further evidence about price formation, asymmetric information and traders’ behaviour, in the context of asymmetric and possibly misleading information in a (double-auction) stock market.
They found that asymmetric information released its effect into the market only when it is common knowledge among market participants. Plott et al. (2003) found that information aggregation strictly depends on the environment complexity. While the competitive equilibrium (rational expectations model) is very likely to hold in simpler contexts, private information based models are generally more accurate in more complicated environments. In a market where information about the intrinsic value of an asset is cumulatively distributed among traders, Huber et al. (2008) proved the existence of a wide range of levels of information for which acquiring additional information did not produce higher gains. A positive relationship between information and higher profits was detected only for very high information levels.
Among the studies that analyzed the impact of insider information, Schotter and Yorulmazer (2009) found that releasing information to some insiders helped to decrease the rate of bank runs in an experiment over banking crisis. As we shall see, we obtain a similar result in the context of financial markets, as the presence of insiders raises efficiency (see section 4).
Similarly to the studies dealing with information aggregation, in our experimental markets all agents are only imperfectly informed on the fundamental value of the asset. No trader is given enough information to know with certainty the future value of the asset. Nonetheless, we introduce two major novelties. First, in two of our experimental conditions “quasi-insiders” receive a larger number of signals than others. Although we can not, strictly speaking, talk about a process of dissemination of information, we are nonetheless interested in studying the impact on market efficiency of centralizing information in the hands of few agents.
Second, differently from all previous studies, in our design traders are given the chance to share their information set with the other members of their group before trading begins. We expect that trust and reciprocity may prove relevant motivations as found in the literature studying standard cooperation problems (Fehr and Fischbacher, 2002). In fact, group attachment and social identity may also play a role (Brewer, 2008). The presence of quasi-insider may either induce a stronger sense of identity in groups of non-quasi-insiders, or a heightened perception of the unfairness of the process (Fehr and Schmidt, 1999; Trautmann, 2009; Krawczyk, 2011). In both cases we would expect groups of less-informed traders to increase cooperation in comparison with symmetric treatments. This would lead to smoothing the information distribution heterogeneity
and to increasing the flow of information among traders3. To the best of our knowledge,
our paper is the first studying information aggregation in a framework where cooperation, reciprocity and leadership all matter to agents’ choices and price dynamics.
3 Experimental Design
3.1 General Design
We run 27 independent experimental markets where a total of 324 agents traded a generic financial asset. Each agent was provided with 1000 tokens and ten units of asset. Each token was worth 0,02 Euros. At the end of the trading period, the asset paid an uncertain dividend D, which could be worth ten tokens or zero tokens, depending on two equally likely states of the world. At the beginning of the period, agents received partially informative signal(s) on the fundamental value of the security. Before trading started, in what we call the sharing stage, each trader independently decided whether or not to reveal her signal(s) to the other two members of her group or not.
We designed four treatments in addition to a baseline condition where no agent received any information. In treatment 1 (T1) all agents received one signal; in treatment 2 (T2) basic-informed agents received one signal and quasi-insider agents received three signals; in treatment 3 (T3) all agents received three signals; in treatment 4 (T4) basic-informed agents received one signal and quasi-insider agents received nine signals. Three markets were run for the baseline condition, while six markets were run for each of the four treatments.
This design allows us to consider several invariants for treatments comparison. T1 and T2 differ because of the presence of quasi-insiders but preserve the amount of information given to basic-informed agents. T3 and T4 differ because of the presence of quasi-insiders agents but preserve the total amount of information in the market. T1 and T3 do not include quasi-insiders agents but differ in the amount of information given to basic-informed agents. T2 and T4 both include quasi-insiders but differ in the amount of additional information given to them.
3 In a companion paper, we study in detail how sensitive the pre-trade cooperation mechanism is to the presence of quasi-insiders.
Each market included 23 trading periods, three of which were trial periods while all of the 20 ensuing periods were paid off. The experiment was programmed in z-Tree (Fischbacher, 2007) and was run at the Laboratory for Experimental Economics (LEE) of Universitat Jaume I (Castello n, Spain). Instructions are reported in the Appendix G.
3.2 State of information
In all cases except the baseline, traders received partially informative signal(s) on the future value of the asset dividend before trading started. Signals were not 100% reliable. Assuming that the true dividend to be paid at the end of the period was ten (zero), the probability of getting a signal indicating that the dividend would be ten (zero) was p. (1 – p) was therefore the probability of getting a private signal indicating that the dividend would be ten (zero) while the true value of the dividend was instead zero (ten). In other words, p was the probability that the signal reveals the true value of the dividend, while 1-p is the complementary probability that the signal indicated a wrong value of the dividend. We set p equal to 70%. The value of p was common knowledge among subjects.
At the beginning of the experimental session, in each market 12 traders were randomly assigned to four different groups, each composed by three traders. The group composition was fixed throughout the session. Before trading began, subjects went through a sharing stage, in which they simultaneously decided whether or not to share their signal(s) with others in their group. Information sharing could only occur with components of the same group. Moreover, if one trader decided to share her information, all his or her signal(s) would be shared within the group. No deception when sharing signals was allowed.
Treatment T1 T2 T3 T4 Baseline
P
ane
l A
Ex-Ante
Number of signals distributed to “basic informed” traders 1 1 3 1 - Number of signals distributed to “quasi insider” traders - 3 - 9 -Per capita number of signals distributed in the market 1 1.5 3 3 -
P
ane
l B
Ex-Post
Per capita number of signals available to “basic informed” traders
2.18 2.16 5.90 2.23 -
Per capita number of signals available to “quasi
insider” traders
- 5.82 - 16.70 -
Per capita number of signals in the
market 2.18 3.07 5.90 5.84 -
Information
sharing multiplier 2.18 2.04 1.96 1.94 -
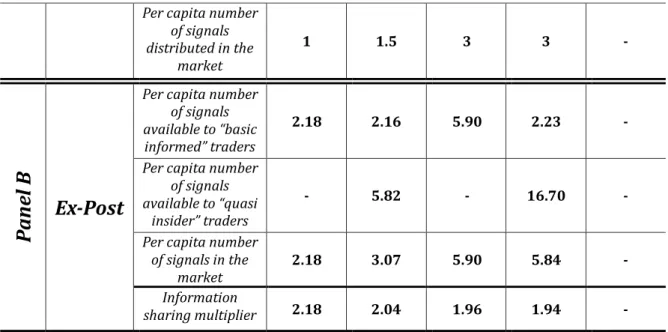
Table 1: Treatments design and distribution of information ex ante and ex post Note: Table 1, Panel A reports the number of signals distributed to basic-informed agents and quasi-insiders in each treatment before the sharing stage takes place. The per capita number of signal is also computed. Panel B reports the per capita number of signals owned by basic-informed traders and quasi-insiders after the sharing stage has taken place. The information sharing multiplier is computed as the ratio between the per capita number of signals after and before the sharing stage. It therefore measures the extent to which information spreads in the market in each treatment as an effect of agents’ sharing behavior.
At the end of each session, the total earnings, computed as the sum of the profits in each of the 20 paying periods, was communicated and paid out to traders. The average earnings were 24.6€ per subject for about two hours of session duration.
The distribution of signals between the two types of agents is summarized in Table 1. We show the structure of both the ex-ante (Panel A) and ex-post (Panel B) signals distribution. While the former displays just the exogenous source of information, the latter crucially depends on whether or not traders decided to share their private information within their group. In the last line of Table 1 we compute the “Information sharing multiplier” as the ratio between the “Average number of ex-post signals in the market” and the “Average number of signals ex-ante distributed in the market”. The “Information sharing multiplier” is then an index to quantify the impact of the “cooperation” mechanism on the increase of subjects’ average private information.
4 Notions of market efficiency and hypotheses
4.1 Benchmark derivation, price discovery and market efficiency
In our empirical analysis we will draw on four different price benchmarks. Each of them embodies a theoretical prediction and will be tested against actual prices from our experimental markets to account for market efficiency.
The dividend value, randomly determined by the z-tree software at the beginning of each period, but unknown to agents until the end of the period, constitutes our first benchmark. The dividend represents the fundamental value of the asset.
A second price benchmark is the expected value of the dividend distribution. In the baseline condition, where no private information is available in the market, we should expect prices to exhibit a random walk process around five tokens, that is, the ex ante expected value of the asset. For this reason, we refer to the ex ante expected value of the dividend distribution using the terminology “uninformed price”.
Our third price benchmark hinges upon the Bayes rule. This describes how agents update their beliefs after they receive new information. The crucial assumption under the Bayes rule is that agents are rational. Then, according to the Bayes rule, agents should be able to efficiently update their prior information by processing the arrival of new signals in their information set.
To compute the Bayes price benchmark, we draw on the approach proposed by Alfarano et al. (2011, 2015). In particular, when computing the Bayes price we take into consideration the ex-post traders’ information set, i.e. the information set after the sharing stage. With reference to each trading period of a given market, the procedure starts from the classic formulation of Bayesian inference:
𝑃𝑟𝑗(𝐷 = 10|𝐼𝑒𝑥−𝑝𝑜𝑠𝑡𝑗 ) = 𝑃𝑟(𝐼𝑒𝑥−𝑝𝑜𝑠𝑡
𝑗
|𝐷 = 10) ∙ 𝑃𝑟(𝐷 = 10) 𝑃𝑟(𝐼𝑒𝑥−𝑝𝑜𝑠𝑡𝑗 )
where D=10 refers to the event of the dividend being equal to ten. We denote with 𝐼𝑒𝑥−𝑝𝑜𝑠𝑡𝑗 the series of signals – i.e. the information set – owned by trader j after the
sharing stage and at the beginning of the trading stage. 𝑃𝑟(𝐷 = 10) denotes the
probability”. This is by construction equal to 1
2 . 𝑃𝑟𝑗(𝐷 = 10|𝐼𝑒𝑥−𝑝𝑜𝑠𝑡 𝑗
) is trader j ‘s
probability of observing the high value dividend conditional on her information set after the sharing stage.
Since there are only two possible states of the world, we can compute the probability that trader j attributes to the event of observing the low value dividend conditional on his or her information set in the trading stage as follows:
𝑃𝑟𝑗(𝐷 = 0|𝐼𝑒𝑥−𝑝𝑜𝑠𝑡
𝑗 ) = 1 − 𝑃𝑟(𝐷 = 10|𝐼
𝑒𝑥−𝑝𝑜𝑠𝑡
𝑗 )
We introduce the following variables:
𝑝 is the probability that a single private signal is correct;
𝑞 = 1 − 𝑝 is the probability that a single private signal is incorrect;
𝑥𝑒𝑥−𝑝𝑜𝑠𝑡𝑗 is the number of signals indicating that the value of the dividend will be 10
in trader j’s information set in the trading stage;
𝑋𝑒𝑥−𝑝𝑜𝑠𝑡𝑗 is the total number of signals in trader j’s information set in the trading
stage.
We then define trader j’s aggregate net private signals in the trading stage as follows:
𝜂𝑒𝑥−𝑝𝑜𝑠𝑡𝑗 = 2 ∙ 𝑥𝑒𝑥−𝑝𝑜𝑠𝑡𝑗 − 𝑋𝑒𝑥−𝑝𝑜𝑠𝑡𝑗 .
Finally, we compute the probabilities of both high and low dividend conditional on trader j’s information set in the trading stage; i.e. the “Bayes probabilities”:
𝑃𝑟𝑗(𝐷 = 10 | 𝐼𝑒𝑥−𝑝𝑜𝑠𝑡 𝑗 ) = [1 + (𝑞 𝑝) 𝜂𝑒𝑥−𝑝𝑜𝑠𝑡𝑗 ] −1 𝑃𝑟𝑗(𝐷 = 0 | 𝐼𝑒𝑥−𝑝𝑜𝑠𝑡𝑗 ) = [1 + (𝑝 𝑞) 𝜂𝑒𝑥−𝑝𝑜𝑠𝑡𝑗 ] −1
Since each trader has her own Bayes probability, in each trading period we take the mean of the Bayes probabilities and we compute the Bayes price by weighting each
dividend value by the respective probability of observing it conditionally on the information set; 𝐵𝑎𝑦𝑒𝑠 𝑝𝑟𝑖𝑐𝑒 = 1 𝑀∑ [10 ∙ 𝑃𝑟𝑗(𝐷 = 10|𝐼𝑒𝑥−𝑝𝑜𝑠𝑡 𝑗 ) + 0 ∙ 𝑃𝑟𝑗(𝐷 = 0|𝐼𝑒𝑥−𝑝𝑜𝑠𝑡𝑗 )] 𝑀 𝑗=1
where M denotes the total number of subjects trading in a period.
Finally, we define our fourth benchmark as the Fama-efficient price. We recall that the market is said to be Fama-efficient if, at any instant of time, all the available information is incorporated into the prices. In our framework, this would mean that each agent trades as if he or she knew both her signals and all other agents’ signals as well. In other words, if traders manage to infer others’ information, prices are expected to converge toward the efficient price.
Differently from the Bayes price formulation, when computing the Fama-efficient price we consider the total number of signals distributed before the sharing stage. This computation is affected neither by the information set of each subject nor by information sharing. Then, we compute the efficient price as follows:
𝐸𝑓𝑓𝑖𝑐𝑖𝑒𝑛𝑡 𝑃𝑟𝑖𝑐𝑒 = 10 ∙ 𝑃𝑟(𝐷 = 10|𝐼𝑒𝑥−𝑎𝑛𝑡𝑒) + 0 ∙ 𝑃𝑟(𝐷 = 0|𝐼𝑒𝑥−𝑎𝑛𝑡𝑒)
As we can see, in the efficient price formulation we consider the ex-ante market information set, i.e. the information set in the sharing stage. Similarly to the previous case, 𝑃𝑟(𝐷 = 10|𝐼𝑒𝑥−𝑎𝑛𝑡𝑒) = 𝑃𝑟(𝐼𝑒𝑥−𝑎𝑛𝑡𝑒|𝐷 = 10) ∙ 𝑃𝑟(𝐷 = 10) 𝑃𝑟(𝐼𝑒𝑥−𝑎𝑛𝑡𝑒) = [1 + (𝑞 𝑝) 𝜂𝑒𝑥−𝑎𝑛𝑡𝑒 ] −1 𝑃𝑟(𝐷 = 0|𝐼𝑒𝑥−𝑎𝑛𝑡𝑒) = 1 − 𝑃𝑟(𝐷 = 10|𝐼𝑒𝑥−𝑎𝑛𝑡𝑒) = [1 + ( 𝑝 𝑞) 𝜂𝑒𝑥−𝑎𝑛𝑡𝑒 ] −1
are the probabilities of observing the low or high dividend conditional on the market information set in the sharing stage.
The crucial difference with respect to the Bayes price is in the interpretation of net signals. When we compute the Bayes price we refer to the net signals owned by each subject. Then, first the Bayes price for each trader is computed; secondly the
arithmetic mean of subjects’ Bayes prices is taken into account as a proxy for the Bayes price in each period. Differently, in the efficient price formulation, we consider the sum of the net signals across all agents. From a theoretical point of view, the Bayesian probability updating is affected by information overweighting. This is the case because any shared piece of information (signal) will be accounted more than once, whenever shared. This occurs because not only is the same signal processed by one agent, but also, if shared, by other group members. For this reason, the Bayes price is theoretically more distortive than the Fama-efficient price. Moreover, contrary to the uninformed and the dividend prices, the Bayes and the Fama-efficient targets crucially depend on both the quantity and the composition of the information in the market. By composition we mean the ratio between the total number of signals indicating that the dividend will be paid and the total number of signals indicating that the dividend will not be paid, as determined by the random generator of information in the market. Since the Bayes price depends on the information available to each agent after the information sharing stage, then both the number of signals with which traders are initially provided, and the number of signals that are shared, matter for the determination of the Bayes price. Conversely, only the total quantity of signals in the market and their composition influence the Fama-efficient price level. Therefore, contrary to the Bayes price, the efficient price is not affected by cooperation among traders. In this sense, for the law of large numbers, a more precise correspondence between the efficient and the dividend price is likely to occur as the number of total signals increases.4
After computing the relevant benchmarks, we measure how accurately actual prices track each benchmark. We do this by computing the root mean squared error (RMSE) between actual prices and each benchmark. We do this for each transaction occurred in the market from the beginning to the end of the trading period. Technically, the RMSE is used as an index of proximity of actual prices with respect to the theoretical predictions. The formulation is reported below:
𝑅𝑀𝑆𝐸 = [1 𝑛∑(𝑇𝑃𝑖− 𝐵𝑃) 2 𝑛 𝑖=1 ] 1 2
4 In fact, our data show that the efficient price is all the time the nearest (or at least equally close) benchmark to the fundamental asset value.
where:
𝐵𝑃 represents the benchmark price;
𝑇𝑃𝑖 represents the actual price of transaction i;
𝑛 stands for the total number of transactions.
The lower the RMSE, the more the market is trading in proximity of a given theoretical prediction. Then, if the market is efficient, we should expect to find smaller value of the RMSE over the efficient price with respect to both the uninformed price and the Bayes price. This would mean that all the relevant information is correctly and instantaneously incorporated into actual prices.
4.2 Hypotheses set
In this section we lay out the main hypotheses that we want to examine in our analysis. Given the exploratory nature of our study, in which two different mechanisms affecting information aggregation are for the first time jointly analyzed, we lack a theoretical basis to make a priori predictions on their relative effects. For this reason, we report below a series of “null hypotheses” corresponding to the case of absence of treatment effects, and two alternative hypotheses where treatment effects can go in either direction.
The first hypothesis we want to examine is whether information distribution affects market efficiency, keeping the amount of information constant in the market. To do this, we compare market efficiency in T3 and T4. 36 signals were distributed in the market in either treatment. However, while in T3 each subject received three signals, i.e. the information distribution was uniform and symmetric, in T4 three subjects belonging to the same group were provided with nine signals each (quasi-insider) and the remaining subjects were given only one signal each. We thus formulate hypothesis 1 and its alternatives.
Hypothesis 1: Keeping constant the total number of signals, when information
is uniformly distributed prices exhibit the same deviation from the efficient price as when quasi-insider agents are present in the market.
Alternative Hypothesis 1(a): Keeping constant the total number of signals,
prices exhibit a significant closer convergence to the efficient price when information is uniformly distributed.
Alternative Hypothesis 1(b): Keeping constant the total number of signals,
prices exhibit a significant closer convergence to the efficient price when quasi-insider agents are present in the market, i.e. when information is centralized.
As a second step, considering those cases in which quasi-insider agents are present in the market (T2 and T4), we test whether an increase in the number of quasi-insiders’ per capita signals improves the convergence toward the efficient price. Indeed, in T2 and T4, while basic informed agents were provided with one signal each, quasi-insider agents (three subjects who belong to the same group) were given three and nine signals each respectively. Therefore, we formulate hypothesis 2 and its alternatives.
Hypothesis 2: Other things being equal, when quasi-insider agents are provided
with three signals each, prices exhibit the same deviation from the efficient price as when quasi-insider agents are provided with nine signals each.
Alternative Hypothesis 2(a): Other things being equal, when quasi-insider
agents are provided with three signals each, prices exhibit a significant closer convergence to the efficient price than when they are provided with nine signals each.
Alternative Hypothesis 2(b): Other things being equal, when quasi-insider
agents are provided with nine signals each, prices exhibit a significant closer convergence to the efficient price than when they are provided with three signals each.
Finally, considering the cases where information is uniformly distributed among traders (T1 and T3), we test whether increasing the number of signals in the market impacts on market efficiency. This can be tested because each agent is provided with one and three signal(s) in T1 and T3, respectively. Our third hypothesis and its alternatives are stated below:
Hypothesis 3: When information is uniformly distributed and traders are
provided with one signal each, prices exhibit the same deviation from the efficient price as when traders are provided with three signals each.
Alternative Hypothesis 3(a): When information is uniformly distributed,
prices exhibit a significant closer convergence to the efficient price when traders are provided with one signal each.
Alternative Hypothesis 3(b): When information is uniformly distributed,
prices exhibit a significant closer convergence to the efficient price when traders are provided with three signals each.
5 Results
5.1 Information sharing
We first analyze how traders use the option to share their private information; secondly we present results on market outcomes.
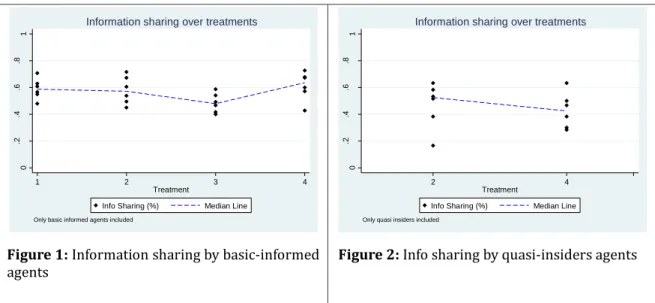
Figures 1 and 2 illustrate how subjects use the cooperation mechanism. They report the average number of signals shared in each of the six markets comprising a given treatment for basic informed agents’ (Figure 1) and quasi-insider agents (Figure 2).
Figure 1: Information sharing by basic-informed
agents Figure 2: Info sharing by quasi-insiders agents
We first compare information sharing patterns in T1 and T3, where no quasi-insider agent is present. Throughout our descriptive analysis, we consider each market as yielding one independent observation. Indeed, since the same group of people within a market interact over several periods, within-group observations are serially interdependent. This property makes it suitable to consider each group (market) as an independent observation, e.g.
0 .2 .4 .6 .8 1 1 2 3 4 Treatment
Info Sharing (%) Median Line
Only basic informed agents included
Information sharing over treatments
0 .2 .4 .6 .8 1 4 2 Treatment
Info Sharing (%) Median Line
Only quasi insiders included
by computing the mean (median) of the variable of interest over the periods comprising a given
market (see Fre chette, 2012). We note that traders cooperate significantly less in T3
(two-tailed k-sample median test: N = 6; Pearson chi square = 5.33; P = 0.021. See also Table A1, Appendix A). This is likely the consequence of traders’ initial information set being larger in T3 compared to T1. Agents can thus be more confident in T3 than T1 that their information set is sufficient to indicate the true state of the world. In other words, the expected benefits from cooperation is lower in T3 than T1, hence the incentives to share information are also lower.
We also find that the level of information sharing among basic informed agents does not significantly change when quasi-insider agents are introduced in the market, as can be seen in the comparison between T1 - agents provided with one signal each - and T2 - basic informed and quasi-insider agents provided with one and three signals each, respectively - (two-tailed k-sample median test: N = 6; Pearson chi square = 0.00; P = 1.000. See also Table A2, Appendix A) and between T1 and T4 - basic informed and quasi-insider agents provided with one and nine signals each respectively – (two-tailed k-sample median test: N = 6; Pearson chi square = 0.00; P = 1.000. See also Table A3, Appendix A).
Furthermore, moving from T2 to T4, the median percentage of basic informed traders sharing their information set switches from 57.22% to 63.61%. Yet, this difference is not statistically significant (two-tailed k-sample median test: N = 6; Pearson chi square = 0.00; P = 1.000. See also Table A4, Appendix A). Finally, no significant difference (two-tailed k-sample median test: N = 6; Pearson chi square = 1.33; P = 0.248. See also Table A5,
Appendix A) emerges between quasi-insiders’ information sharing behavior in T2 and
T4, although it is apparent from Figure 2 that sharing is lower in T4 than T2. This behavior presumably follows the same reasons as the drop in sharing for basic informed agents in T3 relative to T1. That is, a higher number of initial signals for each agent reduces their need to cooperate with others. Our conjecture (see section 2) that procedural unfairness in the asymmetric treatments may have led to stronger “group spirit” in basic-informed agents is thus disconfirmed by the data. As found in a companion paper, though, some other identity effects, which are not relevant for the present paper, seem nonetheless to emerge.
5.2 Market Efficiency 5.2.1 General Overview
Figures 5-8 report the box-plots of the RMSE distribution for each of the benchmark prices in each treatment. These graphs pool RMSE over periods and markets. A more detailed overview can be found in Figures B1, B2, B3, B4, and B5 in Appendix B. There we show the actual evolution of the traded prices in relation to the benchmark prices, broken down by market and period.
First, we note a clear difference between the baseline condition and all other treatments. The uninformed and dividend price RMSE distributions are shifted downward and upward, respectively, in comparison to all other treatments. Through the use of a Tobit regression analysis (see Appendix C, Model C1), we find that the uninformed price RMSE in the baseline is significantly lower than that computed in each of the other treatments (P < 0.001 in all the four pairwise comparisons). On the contrary, we find that the dividend price RMSE distribution in the baseline condition is significantly higher with respect to that computed in each of the other treatments (P < 0.05 in all the four pairwise comparisons). This preliminary analysis shows that when no information is present in the market, trade prices remain significantly closer to the uninformed price and further away from the dividend price than when some information is present in the market. In particular, we note that this difference is more pronounced for the uninformed price than the dividend price. It is relatively easier for markets with information to depart away from the uninformed price than to come closer to the fundamental in comparison to markets without information. In fact, trade prices in the baseline condition exhibit a random walk process around the expected value of the dividend distribution, and in no case prices reach the dividend value (see Figure B5, Appendix B). We employ a Tobit regression model (see Appendix C, Model C2) to assess whether, when no information is in the market, the distance between trade prices and the uninformed price is lower than the distance between trade prices and the fundamental value of the asset. This is the standard assumption in markets with no information, and it is, not surprisingly, confirmed in our case (coeff. = -4.18; P < 0.001). This preliminary evidence ensures that agents were able to exploit the available information and traded at prices that were further away from the uninformed price and closer to the fundamental asset value than in the baseline.
Figure 5: RMSE Distribution, Uninformed Price Figure 6: RMSE Distribution, Bayes Price
Figure 7: RMSE Distribution, Efficient Price Figure 8: RMSE Distribution, Dividend
Among the treatments with information, we note some tendency for the uniformed price RMSE to increase as we move from T1 to T4, and correspondingly (though less markedly so) for the dividend price RMSE to decrease as we move from T1 to T4. This may signal that the combination of adding information and centralizing information helps agents to trade at prices that are closer to the fundamental. Nevertheless, we note no clear pattern with respect to either the Bayes RMSE or the Fama-efficient price.
We conjecture that this apparent lack of treatment differences in the Bayes and Fama-efficient RMSE may be due to learning effects. Learning may occur because agents update their decision-making rules as they accumulate trading experience. Agents can improve their ability to infer information from the other traders’ activity over the course of 20 periods. Agents may also update their cooperation strategies over time, thus also affecting the way markets spread information. In fact, time series plots in Appendix B typically exhibit proximity to uninformed or Bayesian prices in early periods, and proximity to the Fama-efficient price in the late periods of the session. For instance, in market 1 from session 2 and T2 (see appendix B, Figure B2), uninformed trades dominate the first three periods, prices then converge to the Bayes price in
0 1 2 3 4 5
RMSE Uninformed Price
Baseline Treatment 1 Treatment 2 Treatment 3 Treatment 4 0 2 4 6 8
RMSE Bayes Price
Treatment 1 Treatment 2 Treatment 3 Treatment 4 0 2 4 6 8
RMSE Efficient Price
Treatment 1 Treatment 2 Treatment 3 Treatment 4 0 2 4 6 8 10
RMSE Dividend Price
Baseline Treatment 1 Treatment 2 Treatment 3 Treatment 4
periods from four to nine, and prices track the efficient equilibrium price for all later periods. This suggests a pattern whereby agents trade as if they were uninformed in the earliest periods, process their own private information in intermediate periods, and eventually manage to correctly pool the information dispersed in the market in the final periods. Learning may thus be relevant not only to account for individual behavior but also for its impact on market performance.
For these reasons, we split our descriptive results into the first and second block of ten periods in each market5 and report on the benchmarks performance rates over
the four treatments. We identify for each period of each market which benchmark price is best able to approximate the actual transaction prices. More precisely, we select the benchmark price with the lowest RMSE value from actual prices6. Essentially, in each
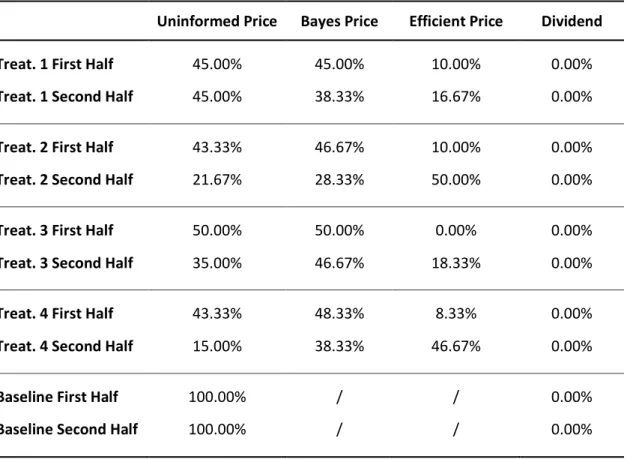
treatment we count how many times a given benchmark best approximates our data. Table 2 reports the percentages of each benchmark being selected as the one with the lowest RMSE.
Performance Rates
Uninformed Price Bayes Price Efficient Price Dividend Treat. 1 First Half 45.00% 45.00% 10.00% 0.00% Treat. 1 Second Half 45.00% 38.33% 16.67% 0.00% Treat. 2 First Half 43.33% 46.67% 10.00% 0.00% Treat. 2 Second Half 21.67% 28.33% 50.00% 0.00%
Treat. 3 First Half 50.00% 50.00% 0.00% 0.00%
Treat. 3 Second Half 35.00% 46.67% 18.33% 0.00%
Treat. 4 First Half 43.33% 48.33% 8.33% 0.00%
Treat. 4 Second Half 15.00% 38.33% 46.67% 0.00%
Baseline First Half 100.00% / / 0.00%
Baseline Second Half 100.00% / / 0.00%
5 Box-Plots are reported in Appendix D.
6In case of ties between RMSE for two or more benchmarks, we select the least efficient benchmark. This is on the one hand the most conservative criterion for our analysis and on the other hand permits performance rates to always sum up to 100%.
Table 2: Benchmark performance rates, grouped by treatment and first or second block of ten periods. First, we note that the Dividend price has never the lowest RMSE, denoting the difficulty of traders of achieving the fundamental price. With regards to the three other benchmarks, in T1 the uninformed and the Bayes prices are the best performing benchmarks in both the first and the second 10-block periods, with a performance rate of 45% and 45%, respectively, in the first 10-block period, and of 45% and 38.33% in the second 10-block period. The efficient price marginally improves from a performance rate of 10% in the early periods to a performance rate of 16.67% in late periods. Trading in T1 is thus still predominantly uninformed or based on private information.
In T2 the uninformed and the Bayes prices are the best performing ones in early periods (with a performance rate of 43.33% and 46.67% respectively). Nevertheless, when we move to late periods the efficient price becomes the best tracked benchmark (with a performance rate of 50%). It is particularly interesting to note how uninformed trades decrease from 43.33% to 21.67% and efficient trades increase from 10% to 50% when moving from early to late periods. This evidence shows that, over time, traders improve their ability to infer and aggregate the information dispersed in the market.
In T3 results are remarkably similar to T1. Both the uninformed and the Bayes prices perform better in accounting for our data than the efficient price in both early and late periods. In particular, in the second ten-round block, the Bayes price is the best tracked benchmark with a performance rate of 46.67%. It is remarkable that, in spite of the number of initial signals being ex ante three times as high in T3, we observe market prices to have the same levels of proximity to the efficient price and the Bayes price as in T1. This is not due to the fact that the ex post number of signals is similar in the two treatments. As Table 1, Panel B, shows, agents in T3 have a significantly (Mann Whitney U test: N7 = 6; z = -2.882; P < 0.0039) larger amount of information (5.90 signals per capita) than in T1 (2.18 signals per capita). The ex post ratio of number of signals is 2.70, which is less than the ex ante ratio of 3:1 because agents shared on average less in T3 than T1. The bad performance of the efficient price suggests that traders are mainly concerned with processing their own private information than trying to infer others’ information through the observation of price signals.
Finally, benchmarks in T4 perform similarly to T2. While the uninformed and the Bayes prices exhibit the highest performance rates in early periods (43.33% and 48.33% respectively), the efficient price performs better in late periods (with a performance rate of 46.67%). Even in this case it is remarkable how the efficient price performance rate switches from 8.33% to 46.67% moving from early to late periods. Here again we note that in spite of a larger number of signals being available in T4 compared to T2 both ex ante - in a proportion of 2:1 - than ex post - in a proportion of 1.9:1 (Mann Whitney U test: N8 = 6; z = -2.892; P < 0.0038) – the performance in terms of efficiency appear to be virtually the same.
5.2.3 Econometric Analysis
In this section we perform a thorough econometric analysis of our hypotheses and of the conjectures that emerged from the descriptive analysis. For this purpose we use the following Tobit regression model:
𝑅𝑀𝑆𝐸𝑖,𝑡 = 𝛼 + ∑ 𝛽𝑖 𝑛 𝑖=1 ∙ 𝑀𝑘𝑡𝑖+ 𝛾 ∙ 𝑃𝑒𝑟𝑖𝑜𝑑 + ∑ 𝜃𝑗 𝑘 𝑗=1 ∙ 𝑋̅𝑖,𝑗+ 𝜀𝑖,𝑡
The RMSE index of actual trader prices with respect to a given price benchmark is the dependent variable of the model. Our covariates include a dummy variable 𝑀𝑘𝑡𝑖 for
each of n markets but one that is omitted. In this way we control for both possible hydiosincracies across markets and for the clustering of our data at the market level.
𝑃𝑒𝑟𝑖𝑜𝑑 is a trend variable capturing the time effect; and 𝑋̅𝑖,𝑗 is a vector of demographics and attitudinal variables9 that are averaged at the market level.
We test for treatment effects performing Wald tests over the difference between the sums of market dummy coefficients belonging to different treatments. That is, to test for the null hypothesis of absence of differences between two treatments, we consider the null hypothesis:
8 Market averages of the ex-post signals distribution are used to account for within market correlation. 9 A detailed description of the demographics and attitudinal variables is reported in the note below Table E1 (Appendix E).
𝐻0: 𝑍𝑟,𝑠≡ ∑ βi,r 𝑛𝑟 i=1 − ∑ βi,s 𝑛𝑠 i=1 = 0
where r and s identify the markets associated with two different treatments. 𝑛𝑟 and 𝑛𝑠 are the numbers of markets belonging to treatment r and s. Our design includes six markets for each treatment. 𝑛𝑟 and 𝑛𝑠 are therefore always equal to six, except for the
treatment to which the omitted category of the model belongs (Treatment 1). Note that the possibility that 𝑛𝑟 > 𝑛𝑠 for comparisons involving Treatment 1 does not affect the
estimation of our pairwise comparisons, since the omitted category coefficient is implicitly zero.
Since our descriptive analysis highlighted the presence of different price patterns between the first and second half market periods, we run the econometric model both in the first and the second block of ten periods as well as over the entire set of market periods.
All the regression outputs are reported in Appendix E; all the treatments pairwise comparisons are available in Appendix F.
Here we mainly focus on the results derived from the second block of ten periods.
Result 1: Hypothesis 1 is rejected. We find that, keeping information constant ex
ante (36 signals in the market), when quasi-insider agents are active in the market (T4), actual prices exhibit a significantly closer convergence to the efficient price with respect to the case in which information is uniformly distributed (T3) (𝑍𝑇4,𝑇3 = -4.40; P = 0.014). Therefore, keeping constant the quantity of information in the market, a centralized information distribution in which some agents are provided with more information guarantees more efficiency than a uniform information distribution in which all subjects receive the same amount of information.
Result 2: We cannot reject Hypothesis 2. We find that, other things being equal,
when quasi-insider traders are given nine signals (T4), market efficiency is not significantly higher than when quasi-insider agents are provided with three signals each (T2) (𝑍𝑇4,𝑇2 = -0.79; P = 0.710). In other words, when information is polarized, providing quasi-insider agents with a greater number of per-capita signals does not significantly increase market efficiency.
Result 3: We cannot reject Hypothesis 3. When information is uniformly
(T1) to a market where three signals are released to each subject (T3) does not lead to a significant increase in the market efficiency level (𝑍𝑇3,𝑇1 = -1.58; P = 0.384). We conjecture that the common knowledge that information is uniformly distributed leads subjects not to recognize the presence of an informed market leader and, as a consequence, not to focus on the others’ trading activity. In fact, the sign of the coefficient indicates that the convergence to the efficient price is higher in T1 than in T3. This is remarkable, as the number of initial signals is three times higher in T3 than in T1 (keeping fixed the uniform distribution in both treatments). We conjecture that the greater amount of information in T3 makes traders more confident in being able to correctly forecast the asset dividend and makes them less prone to use the market trading activity as an inference tool. On the contrary, when provided with only one informative signal (as in T1), traders focus more on the market activity to improve their chance of properly inferring the asset fundamental value and, consequently, market efficiency is improved.
With regard to the remaining benchmarks, we find that additional information is not discarded but is somehow processed by traders. This is evident from the increasing pattern over treatments of the uninformed price RMSE in late periods. In other words, moving from T1 to T4, as the quantity of information (total number of signals) increases, prices depart from the uninformed price. This trend is in place in all the pairwise comparisons (𝑍𝑇1,𝑇2 = -4.93; P = 0.00; 𝑍𝑇1,𝑇3 = -3.89; P = 0.000; 𝑍𝑇1,𝑇4 = -8.29;
P = 0.000; 𝑍𝑇2,𝑇4 = -3.80; P = 0.001; see Table F8, Appendix F) but one (𝑍𝑇2,𝑇3 = 0.40; P
= 0.717; see Table F8, Appendix F). Interestingly, even if not significant, the sign of the Wald test 𝑍𝑇2,𝑇3 appears to contradict the rule “more information less noise”. Indeed, although in T3 traders receive twice as many signals as in T2, prices come closer to the uninformed price when only basic-informed agents are active in the market (T3)10 .
Coherently with our results on the efficient price, we also find that even keeping identical the amount of information within the market (i.e. in T3 and T4), asymmetric information distributions produce lower noise than the case in which information is instead symmetrically spread out (𝑍𝑇3,𝑇4 = -4.21; P = 0.000; see Table F8, Appendix F).
10Interestingly, when information is instead asymmetrically distributed, doubling the overall amount of
Furthermore, even in late periods, trades driven by private information are significantly more widespread in treatments where quasi-insiders are not active within the market than in alternative treatments (𝑍𝑇1,𝑇2 = -5.90; P = 0.000; 𝑍𝑇1,𝑇4 = -3.38; P = 0.000; 𝑍𝑇2,𝑇3 = 3.79; P = 0.002; 𝑍𝑇3,𝑇4 = -1.27; P = 0.192; see Table F5, Appendix F).
The dividend price RMSE distributions over treatments exhibit, as expected, a very similar pattern to the one observed in the efficient price case (see Tables F10, F11, and F12, Appendix F).
6. Discussion
The main result of our paper is that only when quasi-insider agents are active in the market traders manage to infer the aggregate information. Consequently, prices come closer to the competitive equilibrium than in alternative treatments where quasi-insiders are absent. The comparison between T2 and T3 is quite telling in this respect. Quasi-insiders in T2 receive the same number of signals as basic informed agents in T3. The overall number of ex ante signals is twice as high in T3 as in T2. Nonetheless, T2 achieves higher rates of proximity to the efficient price than T3, both in the final ten periods (Z=-3,60; P=0.068) and over the whole 20 rounds (Z=-2,77; P=0.031; see Table F2). This rules out the number of signals as being the relevant aspect to improve efficiency, leaving the “leadership” aspect as the crucial one. Moreover, increasing the number of signals does not necessarily lead to increased efficiency. This is the case for both cases in which quasi-insiders are present or absent. Endowing quasi-insiders with nine rather than three signals did not lead to higher efficiency – as the comparison between T2 and T4 clearly shows. Likewise, tripling the number of signals to basic informed agents, in the absence of quasi-insiders, did not lead to increased efficiency either. - This suggests that it is the presence of agents with privileged information per se, rather than the mere availability of more information, which appears to be the crucial characteristic to increase efficiency in a market.
Why is the presence of leaders, i.e. agents with privileged information, more important than cooperation to increase efficiency? As already mentioned in section 2, Schotter and Yorulmazer (2009) find a similar result in an experiment on bank runs. In line with existing research (see section 2), we conjectured that it is the awareness that someone else is better informed that leads traders to focus on others’ behavior and on the information that prices can convey, rather than concentrating mainly on their own
information. The knowledge that quasi-insiders are active in the market urges basic-informed agents to become more concerned with extracting information from the market rather than their own information set. On the contrary, when information is distributed uniformly, traders do not pay as much attention to market prices, but rather merely focus on processing their own private information. This behavior prevents the market from achieving the efficient equilibrium price. Our design prevents us from exploring alternative accounts. One may argue for instance that quasi-insiders use different trading strategies than basic-informed agents. The specific strategies chosen by quasi-insiders may thus facilitate the transmission of information to the whole market. For instance, quasi-insiders may trade more “aggressively”, i.e. increasing the frequency of transactions and trading at prices closer to the fundamental value of the asset. Future research should ascertain whether it is the awareness mechanism or other mechanisms the main driver of our results.
Our experiment shows the relevant – and somewhat surprising – effects that the distribution of information among agents has on efficiency. Concentration of information in the hands of few leaders, rather than uniform dispersion of information, seems the best mechanism to ensure closer proximity to the efficient price. In this sense, any policy makers’ effort to equalize the information distribution in the market may result to be unsuccessful, at least as far as efficiencyis concerned. Moreover, the cooperation mechanism seems much less relevant than the leadership mechanism in improving efficiency. This may be partly due to traders’ reluctance to share information when they acquire more signals, as the comparison between T1 and T3 shows. Taken at face value, our results would suggest that policy makers should focus their action on making the presence of quasi-insiders common knowledge among market participants. However, this is clearly impractical both on legal and ethical grounds. We believe that a more sensible approach would be to “nudge” traders on the importance to extract information on the market fundamentals from prices (Thaler and Sunstein, 2008). If our interpretation is correct, the lower efficiency achieved in treatments without quasi-insiders is mainly due to their focusing on private information rather than information coming from the markets. Hence, higher efficiency may be achieved by prompting individuals to base their trading decisions on information coming from market transactions in addition to their own private information sets.
7. Conclusions
Motivated by the debate on the relationship between market efficiency and privileged information, we studied a market where heterogeneously informed traders were provided with less-than perfect information about the fundamental value of a generic asset. Differently from previous research on the topic, after providing traders with partially informative signals on the asset real value, we gave them the chance to share their information set before trading. Quasi-insider agents were present in two of the four treatments in which information was released. Uniformly informed traders were active in the market in the other two treatments. Increasing the number of per-capita signals when information is uniformly distributed and increasing the number of quasi-insider traders’ per-capita signals when information is centralized were the two key variants over treatments.
Our research has shown that the way information is distributed within an experimental financial market has a significant effect on efficiency. We contrasted a “cooperation” mechanism – namely, the possibility for agents to share information within a restricted group of agents – and a “leadership” mechanism – that is, the presence of privileged agents, which is common knowledge. At the same time, we manipulated the quantity of signals initially present in the market. Our results clearly indicate that the mere presence of privileged agents suffices to improve efficiency, and that, when this is the case, providing the markets with additional information does not necessarily lead to additional efficiency. We claimed that this result is due to an “attention shift” by basic informed traders. More research needs to be done to better ascertain the validity the underlying mechanisms driving these results. Nonetheless, we believe that the present paper has uncovered important and thus far neglected effects of both the concentration and the overall amount of information present in a financial market.
References
Aboulafia M. (1997). Making Markets: Opportunism and Restraint on Wall Street. Cambridge:
Harvard University Press.
Alfarano, S., Barreda-Tarrazona, I., & Camacho-Cuena, E. (2006). On the role of heterogeneous and imperfect information in a laboratory financial market. Central European Journal of Opera-tions Research, 14(4), 417-433.
Alfarano, S., Camacho, E., & Morone, A. (2015). Do investors rely too much on public information
to be justified by its accuracy? An experimental study (No. 30). Collaborative EU Project
FinMaP-Financial Distortions and Macroeconomic Performance: Expectations, Constraints and Interaction of Agents.
Alfarano, S., Camacho-Cuena, E., & Morone, A. (2011). The role of public and private information in a laboratory financial market. IVIE.
Anand, K., Kirman, A., & Marsili, M. (2013). Epidemics of rules, rational negligence and market crashes. The European Journal of Finance, 19(5), 438-447.
Bikhchandani, S., Hirshleifer, D., & Welch, I. (1998). Learning from the behavior of others: Con-formity, fads, and informational cascades. The Journal of Economic Perspectives, 12(3), 151-170.
Brandouy, O., Barneto, P., Leger, L.A. (2003) Asymmetric Information, Imitative Behaviour and
Communication: Price Formation in an Experimental Asset Market, European Journal of
Finance, 9(5), pp.393-419
Brewer, M. B. (2008). Social Identity Complexity and Outgroup Acceptance. Improving intergroup relations: Building on the legacy of Thomas F. Pettigrew, 2, 160.
Fama, E. F. (1965). The behavior of stock-market prices. The journal of Business, 38(1), 34-105.
Fehr, E., & Fischbacher, U. (2002). Why social preferences matter–the impact of non‐selfish motives on competition, cooperation and incentives. The economic journal, 112(478), C1-C33.
Fehr, E., & Schmidt, K. M. (1999). A theory of fairness, competition, and cooperation. Quarterly
journal of Economics, 817-868.
Fischbacher, U. (2007). z-Tree: Zurich toolbox for ready-made economic experiments. Experimental economics 10.2: 171-178.
Forsythe, R., & Lundholm, R. (1990). Information aggregation in an experimental market. Econo-metrica: Journal of the Econometric Society, 309-347.