DP
RIETI Discussion Paper Series 10-E-013
Management Practices and Firm Performance
in Japanese and Korean Firms
-An Empirical Study Using Interview
Surveys-MIYAGAWA Tsutomu
RIETI
Keun LEE
Seoul National University
KABE Shigesaburo
Japan Center for Economic Research
Junhyup LEE
Seoul National University
Hyoungjin KIM
Seoul National University
EDAMURA Kazuma
Hitotsubashi University / Institute of Intellectual Property
YoungGak KIM
RIETI
RIETI Discussion Paper Series 10-E-013
Management Practices and Firm Performance in
Japanese and Korean Firms
-An Empirical Study Using Interview Surveys-
February 2010
Tsutomu Miyagawa (Gakushuin University and RIETI) Keun Lee (Seoul National University)
Shigesaburo Kabe (Japan Center for Economic Research) Junhyup Lee (Seoul National University) Hyoungjin Kim (Seoul National University) YoungGak Kim (Hitotsubashi University and RIETI)
Kazuma Edamura (Hitotsubashi University and Institute of Intellectual Property)
Abstract
To compare management practices between Japanese and Korean firms, we conducted interview surveys on organizational and human resource management based on Bloom and Van Reenen (2007). The average management scores resulting from the interview surveys in Japanese firms were higher than in Korean firms. The gap in the scores between Japan and Korea can be explained by more conservative human resource management practices in Korean small and medium sized firms. We regressed some indicators representing management practices on firm performance. Estimation results suggest that human resource management affects firm performance in Korean firms. In Japanese firms, we expect that organizational reform plays a role in improving firm performance in the service sector.
Keywords: Intangible assets, Management practices, Organizational capital, Human resource management, Factor analysis JEL classification numbers: D21, L23, M11, M12, M15, M51
Contact: Tsutomu Miyagawa Faculty of Economics, Gakushuin University 1-5-1 Mejiro, Toshima-ku, Tokyo, 171-8588, Japan Tel: +81-3-5992-2257 Fax: +81-3-5992-1007 E-mail:[email protected]
This paper is a revised version of JCER Discussion Paper No. 120. We thank Professors Mitsuhiro Fukao (Japan
Center for Economic Research and Keio University) and Haruo Horaguchi (Hosei University) for their insightful comments. Professors Masahisa Fujita (President of RIETI), Kyoji Fukao (Hitotsubashi University), Mr. Masayuki Morikawa (Vice, President , RIETI), other members of the project entitled ‘Research on Intangible Assets in Japan’ at RIETI, and participants at the seminar in RIETI and CAED Tokyo Conference held in October, 2009 also gave us helpful comments to improve our paper. We also thank Professor Takizawa of Toyo University, and Mr. Kawakami for their excellent research assistance. The interview survey in Korea was supported by Japan Center for Economic Research and Nikkei Inc.
RIETI Discussion Papers Series aims at widely disseminating research results in the form of professional papers, thereby stimulating lively discussion. The views expressed in the papers are solely those of the author(s), and do not present those of the Research Institute of Economy, Trade and Industry.
1. Introduction
The US economy had marked accelerated economic growth from the late 1990s to the
first half of 2000s. At first, many economists and policymakers believed that the rapid growth in
the IT industry and IT investment contributed to the acceleration in US economic growth.
Therefore, many advanced countries supported the IT industry and encouraged IT investment in
their own countries. However, the gaps in rates of economic or productivity growth between the
US and other advanced countries have remained intact even in the early 2000s. Since then,
many economists have paid attention to the complementary role of intangible assets in
productivity growth. That is, they started to believe that without intangible assets, IT assets do
not contribute to productivity growth at the firm and aggregated level.1
Corrado, Hulten and Sichel (hereafter referred to as CHS) (2005, 2009), and estimated the
investment in intangible assets at the aggregate US economy level, classifying intangible assets
into three categories: computerized information, innovative property, and economic
competencies. Following CHS (2009), many researchers in other advanced countries tried to
estimate intangible investment.2 Comparing the estimation results in Japan with those in the US
and the UK, Fukao et al (2009) found the following characteristics of Japanese intangible
1
Economic Report of the President 2007 stated ‘Only when they (businesses) made intangible investments to complement their IT investments did productivity growth really take off.’ (p. 56)
2
See Marrano, Haskel and Wallis (2009) for the UK, Hao, Manole and van Ark (2008) for Germany and France, and Fukao et al. (2009) for Japan.
investment.
(1) Investment in computerized information measured as a share of GDP in
Japan is almost the same as that in the US and the UK.
(2) Due to the large R&D investment levels in Japan, the ratio of investment in
innovative property to GDP in Japan is greater than that in the US and the UK.
(3) As for investment in economic competencies, the investment/GDP ratio in
Japan is much smaller than that in the US and the UK.
The third category includes investment in brand equity, firm-specific human capital, and
organizational reform. Among these, the investment in firm-specific human capital and
organizational reform in Japan is much smaller than that in the US and the UK. However, it is
difficult to estimate these investment amounts at the aggregate level and to compare these
among advanced countries.3 In addition, these investments depend on management practices at
the firm level. Therefore, recent studies on intangible investment have focused on management
practices on human resource management and organizational reform at the firm level using
micro-data.
Black and Lynch (2005) categorized organizational capital into three components:
accumulation in human capital, how employees’ voices are reflected in the workplace, and
3
For example, CHS (2009) does not account for the investment in firm specific human capital through on-the–job training while this type of investment is very important in Japanese and Korean firms.
organizational design. Bloom and Van Reenen (2007) examined the effects of management
practices on firm performance based on interview surveys of plant managers. Management
practices were converted to scores based on interview results, and these scores were included as
independent variables when they estimated the production function. According to their study,
US firms got the highest score of the four countries studied (France, Germany, the UK, and the
US). They believed that the low score in continental European firms was partly explained by
weak competition and the prevalence of many family-owned firms.
In Japan, Kurokawa and Minetaki (2006), Kanamori and Motohashi (2006), and
Shinozaki (2007) examined the effects of organizational reform resulting from IT investment on
firm performance by using the Basic Survey on Business Enterprise Activities and IT Workplace
Survey. Their studies suggested that organizational reform resulting form IT investment was
partially responsible for improving firm performance.
While our paper also focuses on the effects of organizational reform and human resource
management on firm performance, there are three different features from the previous studies in
Japan. First, we examined more comprehensive management practices on organizational and
human resource management than earlier studies in Japan. Second, we studied the effects of
management practices on firm performance using not only official surveys but also interview
firm performances between Japanese and Korean firms.
In the next section, we describe our interview survey. Although our interview survey
basically follows Bloom and Van Reenen (2007), we incorporate some questions that were not
included in Bloom and Van Reenen (2007) to capture some unique features of Japanese and
Korean firms. In the third section, we construct a management score by quantifying the
interview results of Japanese and Korean firms, and compare the management practices in firms
of the two countries. In the fourth section, using management scores and financial statements in
Japanese and Korean firms, we estimate a production function and examine the effects of
management practices on firm performance. In the last section, we summarize our studies.
2. The Interview Surveys in Japan and Korea
Why did we conduct the interview survey?
Recently, it has been recognized that qualitative factors in management practices not
captured by official surveys are affecting firm performance. At first, many researchers
conducted their own mailed surveys to examine these qualitative factors within firms. However,
the response rates to the surveys were very low. For example, the response rate to the mailed
survey conducted by Ichikowski (1990) -- who tried to examine the effect of human resource
management on Tobin’s Q or labor productivity-- was only 10%. In the US, researchers and
the response rate of the interview survey in the National Employers Survey conducted by the
National Bureau of Census was 66% in the manufacturing sector and 61% in the
non-manufacturing sector. Much of the recent research on human resource management has also
incorporated interview surveys. Bloom and Van Reenen (2007) conducted interview surveys by
telephone to examine management practices in firm and attained a 54% response rate.
Following the above experiences, we also decided to conduct an interview survey.
How did we design our interview survey?
In our research, we followed the interview survey conducted by Bloom and Van Reenen.
However, we conducted the survey by meeting the managers of the planning departments of
firms face-to-face, while Bloom and Van Reenen (2007) conducted their survey by telephone.
The reason why we conducted face-to-face interviews is that we were concerned about low
response rates. In Japan and Korea, when we want to ascertain qualitative features in firms,
face-to-face communication is a more useful tool than telephone interviews.
Bloom and Van Reenen (2007) classified their eighteen interview questions into four
categories: product management, monitoring, the firm’s target, and incentives for workers.
While their survey was extended to only manufacturing plants, our survey was also extended to
firms in the service sector. Thus, we excluded questions about product management, as they
on-the-job training. As a result, we can classify our questions into two categories: organizational
management and human resource management.
The first category covers the first four questions (Questions 1 to 4). In this category, we
wanted to examine the managerial vision of the firm, the organizational goals, communication
within the firm, and organizational reform. In the remaining questions (Questions 5 to 13) that
focused on human resource management, we added a question about on-the-job training (OJT)
to the questions in Bloom and Van Reenen (2007), because the effects of OJT in Japanese and
Korean firms are considered significant to firm performance. The detailed interview questions
are shown in Appendix 1.
We quantify the responses to the above questions as follows: In each question, we have
three sub questions. If the firm manager responds negatively to the first sub-question, we give
the response a 1 and move to the next question. If he responds positively to the first
sub-question, we move to the second sub-question. If the manager responds negatively to the
second sub-question, we mark a 2 and move to the next question. If he responds positively to
the second sub-question, we move to the last sub-question. In the last sub-question, the positive
response of the manager is given a 4, while a negative response is given a 3.
Our survey focused on four industries in the manufacturing sector (Electric machinery,
industries in the service sector (Internet-based services and information services, Media
activities, and Retail service). In Japan, we obtained our data from 573 firms. As the total
sample was 1086 firms, the response rate in Japan was 52.8%. In Korea, we obtained the data of
350 of the sample 591 firms, thus the response rate was 59.2%4.
3. Management Practices in Japan and Korea
In this section, we compare the management practices between Japanese and Korean
firms based on interview surveys.5 Table 1 shows the distribution of firms in Japan and Korea
by industry. While the share of manufacturing firms in the total number of firms in Japan is
33.9%, the share of manufacturers in Korea is 84.9%. In particular, the firms in the motor
vehicles industry in Korea account for 40.0% of the total number of firms. In Japan, the share of
firms in the retail services is also 40.1%.
(Place Table 1 here)
Table 2 shows the distribution of firms in Japan and Korea by size as measured by the
number of employees. In Japan, the number of small and medium sized firms with fewer than
300 employees in the survey is 313 of the total 573. In Korea, the number of firms with fewer
than 300 is 260 out of the 350. The share of small and medium sized firms in Korea is larger
than that in Japan.
4
The Japanese survey was conducted from February, 2008 to September, 2008. The Korean survey was conducted from May, 2008 to July, 2008.
(Place Table 2 here)
As explained in the previous section, we assigned scores to the management practices
based on the interview surveys. Figure 1-1 shows the distribution of scores in all firms and all
interview questions in Japan and Korea by using Kernel density. In Japan, the mean value of the
distribution average score for all firms is 2.73 and the variance is 0.23. The average scores in
many firms fall between 2.5 and 3.5. In Korea, the mean value of the distribution is 2.33 and the
variance is 0.32. The mean and the median values in Korea are lower than those in Japan and
the variance of scores in Korea is higher. The average scores in most of the Korean firms range
from 1.5 to 2.5.
(Place Figure 1-1 here)
However, the difference in the distribution of scores in Japan and Korea may reflect the
difference in the industry composition in the samples. Thus, we examined the distribution of
scores by industry. Figures 1-2, 1-3, and 1-4 show the distribution of scores in the
manufacturing sector, the information-related services sector, and the retail sector respectively.6
In Figure 1-2, we find that the mean value of the distribution in the Japanese manufacturing
sector is almost the same as that in all firms. We also find that the distribution of scores of all
firms in Korea is affected by the distribution of scores in the manufacturing sector. While the
6
The information-related services sector consists of internet-based services and information services, and media activities.
mean values of the distributions in the manufacturing and information-related services sectors in
Korea are smaller than those of Japan, the mean value in the retail sector in Korea is the same.
(Place Figure 1-2 to Figure 1-4 here)
We classify our interview questions into two categories: one category consists of
questions about organizational management and the other questions about human resource
management. We show the distribution of scores in organizational capital from Figure 2-1 to
Figure 2-4. In both countries, the mean value of the distribution in organizational management
is higher than that of all questions together. The scores in Japan are higher than in Korea. These
results imply that the organizational targets are clear to all employees in Japan in more cases
than in Korea, or Japanese firms improve their organizational structures more aggressively than
Korean firms, because high scores in organizational management indicate a greater degree of
transparency of organizational goals or aggressive organizational reform.
(Place Figure 2-1 to Figure 2-4 here)
We also show the distribution of scores in human resource management in Figures 3-1 to
3-4. The average scores in human resource management are lower than those in organizational
management in both countries. The average scores in Japanese firms are higher than those in
Korean firms in all sectors. In Korea, the low score in the manufacturing sector pulls down the
management, the results imply that Japanese firms are more flexible in their human capital
management than Korean firms.
(Place Figure 3-1 to Figure 3-4 here)
As seen in Table 2, the Korean sample consists of more small and medium sized firms
than the Japanese sample. Thus, we examine the distribution of average score in both countries
by size in Figures 4-1 and 4-2. In Figure 4-1, where the distributions of average scores in firms
with more than 300 employees are shown, we find a gap in the mean value of the two
distributions in Japan (2.81) and Korea (2.57). The median value (2.87) in Japanese firms is also
higher than that (2.57) in Korean firms.
(Place Figure 4-1 & 4-2 here)
As for firms with fewer than 300 employees, the peak of the distribution for Japanese
firms was at a point higher than the 2.5 mark, while for Korean firms, it was around 2. The
difference in the distribution leads to a wider gap in the average score in firms in medium and
small sized firms in both countries than that in large firms. In contrast to the relatively high
mean in the distribution of Japanese firms (2.64), the mean in Korean firms is 2.25. This gap in
the mean can be explained by the difference in the distribution in the average score in human
resource management. The mean in the average score in resource management in Korean firms
that human resource management practices in Korean small and medium sized firms are more
conservative than those in Japan.7
4. Do Management Practices Affect Firm Performance?
Using the scores indicating management practices explained in the previous section, we
examine the effects of management practices on firm performance. Following Bloom and Van
Reenen (2007) we estimate the following equations:
(1)
ln
Y
i
const
.
1ln
L
i
2ln
K
i
3ln
M
i
4Z
i
Dummy
i
i (2) ij i i i i j j i const W Z E Dummy u FP
3 4 2 1 .
Equation (1) is a standard production function including the management score (Z). Y is
output, L is labor input, K is capital input, and M is intermediate input. Because we have
information about recent organizational reforms from the interview survey, we make a dummy
variable (Dummy) that indicates that organizational reform was conducted in the past 10 years.
We also include a country and an industry dummies in the estimation. E is the logarithm of
employees, which controls the firm size.
In Equation (2), the measure of firm performance (FP) is the dependent variable. We take
labor productivity or TFP as a measure of firm performance. TFP is a Tornqvist measure, which
7
is expressed as follows.
(3)
ln
TFP
t
ln
Y
t
s
Lln
L
t
s
Kln
K
t
s
Mln
M
t,where sX(
X
L
,
K
,
M
) denotes the share of each production factor.W represents both the capital labor ratio (K/L) and the intermediate input labor ratio
(M/L).8 We include the same dummy variables as used in Equation (1).
As for Z, we use two types of variables as explanatory variables: one is the average score
in each firm and the other is the first principal factor calculated by factor analysis. If some of the
questions focus on a specific management factor in our survey, an average score may overstate
that specific management factor. Therefore, using factor analysis, we extract a neutral measure
that reflects each management factor evenly and include it in the estimation. The results in
factor analysis in Japan and Korea are shown in Appendix 2. Because the Kaiser=Meyer= Olkin
measures in Japan and Korea are 0.81 and 0.87 respectively, the application of factor analysis is
appropriate in both countries.
4.1 Estimation Results Using All Samples in Japan and Korea
We estimate Equations (1) and (2) using the average score in all questions in the
interview surveys and all samples in Japan and Korea and show the estimation results in Table
3-1. Because we have only cross-section data, the estimation method utilized is OLS. The
results in Table 3-1 show that the average score has neither the expected sign nor a significant
effect on firm performance. Coefficients in the organizational dummy in Table 3-1 are positive
but insignificant in many estimation results.
(Place Table 3-1 here)
As seen in Section 3, we divide the interview scores into two categories: those in
organizational capital indicating organizational management and those in human capital
indicating human resource management. Table 3-2 shows estimation results using the average
score in organizational capital. In Table 3-2, coefficients in the average score in organizational
capital do not show stable signs these results imply that the organizational management
including manifestation of organizational goals or better communication within an organization
does not contribute to firm performance. However, it is organizational reform that improves
firm performance in Japan.
(Place Table 3-2 here)
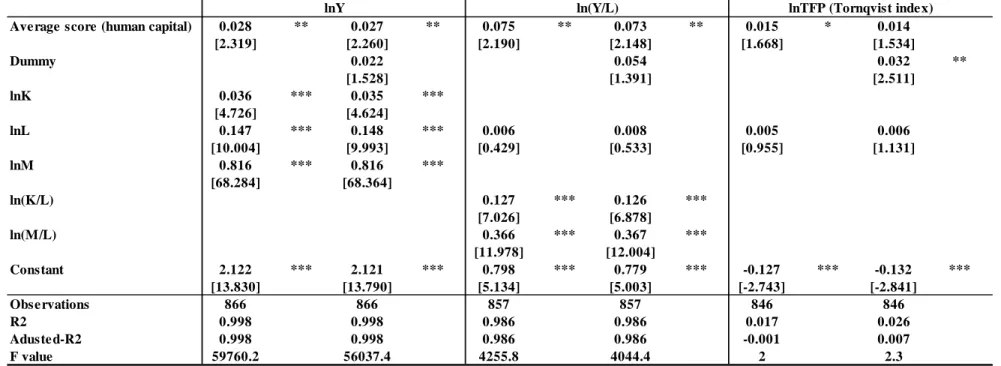
In Table 3-3, we show the effects of the average score with respect to human capital on
firm performance. In contrast to the previous results, the results in Table 3-3 show that the
average score in human capital affects firm performance significantly.
(Place Table 3-3 here)
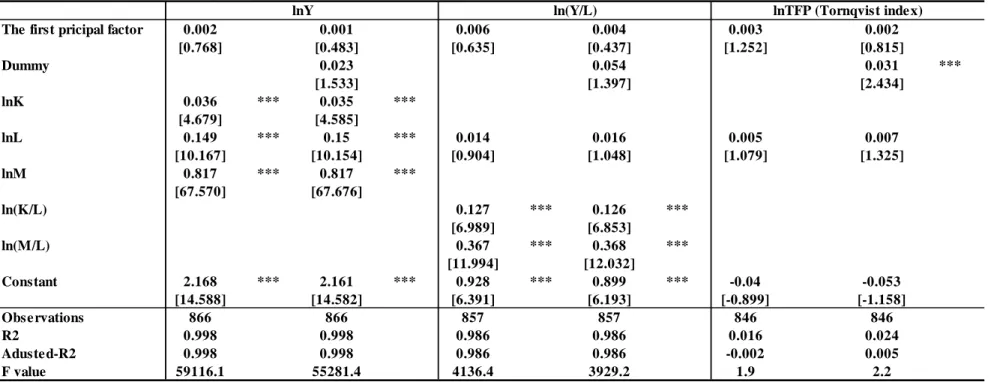
firm performance instead of average score as independent variables in the estimations. The
results shown in Table 3-4 are similar to those in Table 3-1. Although coefficients in the first
principal factor show positive signs in all estimations, they are not significant.
(Place Table 3-4 here)
4.2 Estimation Results by Country
We estimate Equations (1) and (2) by country and show estimation results in Tables 4-1 and
4-2. In Table 4-1, the average score shows neither the expected sign nor a significant effect on
firm performance in Japanese firms. However, in Korean firms, the average score is positive in
all estimations and significant when TFP is a dependent variable. Some coefficients in the
organizational dummy in Japanese firms are positive and significant, while they are negative
and insignificant in Korean firms.
(Place Table 4-1 here)
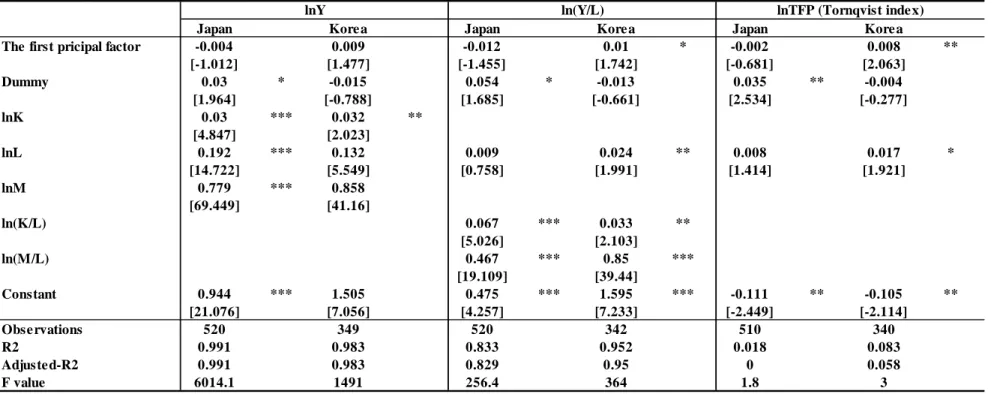
Using the first factor of factor analysis as an independent variable in the estimations, we
find more clear difference between Japanese and Korean firms in Table 4-2. While the results
for Japanese firms show that organizational reform affects firm performance significantly, we
find that the first principal factor improves Korean firm performance significantly. The factor
analysis in Korea implies that the first principal factor represents human resource management.
enhancing firm performance.
(Place Table 4-2 here)
4.3 Estimation results in the manufacturing sector
As seen in Table 1, the industry structure in the Japanese samples is different from that in
Korean sample. Thus, we focus on manufacturing firms in both countries and conduct similar
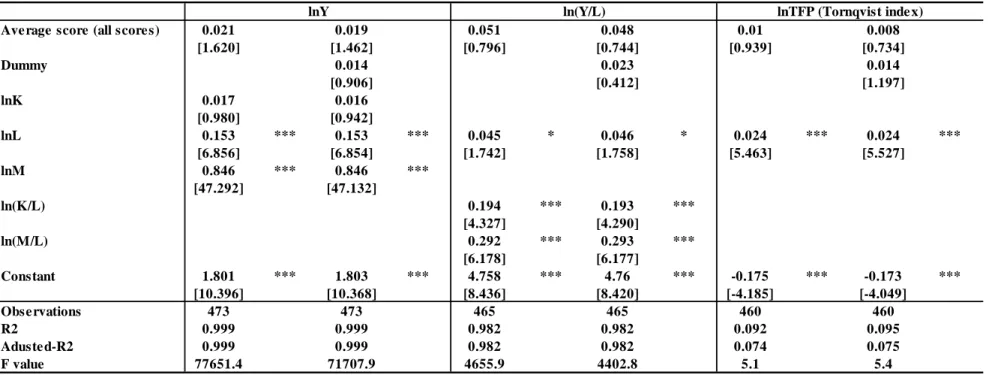
estimations to those in the previous sections. First, we estimate Equations (1) and (2) using the
whole sample in the manufacturing sector in both countries. The estimation results in Table 5-1
are almost similar to those in Table 3-1. While the coefficients of the average score and
organizational reform dummy are positive, they are insignificant.
(Place Table 5-1 here)
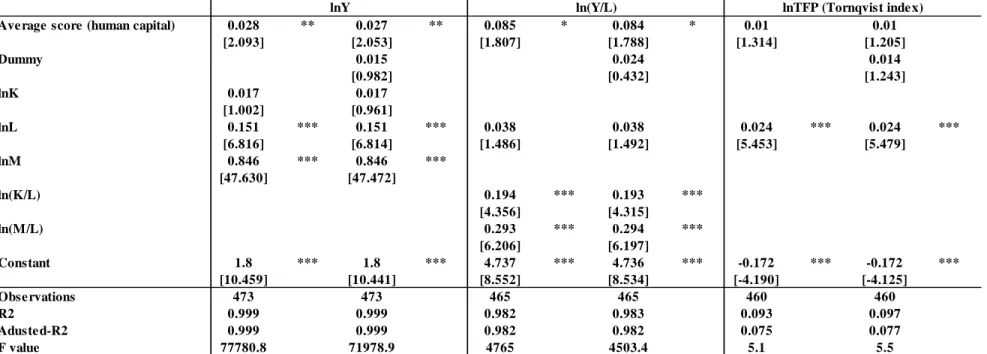
Second, we conduct the same estimations using the score with respect to human capital.
We also find that estimation results in Table 5-2 are similar to those in Table 3-3. Almost all
coefficients in the average score are positive and significant. These results imply that
improvements in human resource management within a firm enhance firm performance in
Japanese and Korean manufacturing firms.
(Place Table 5-2 here)
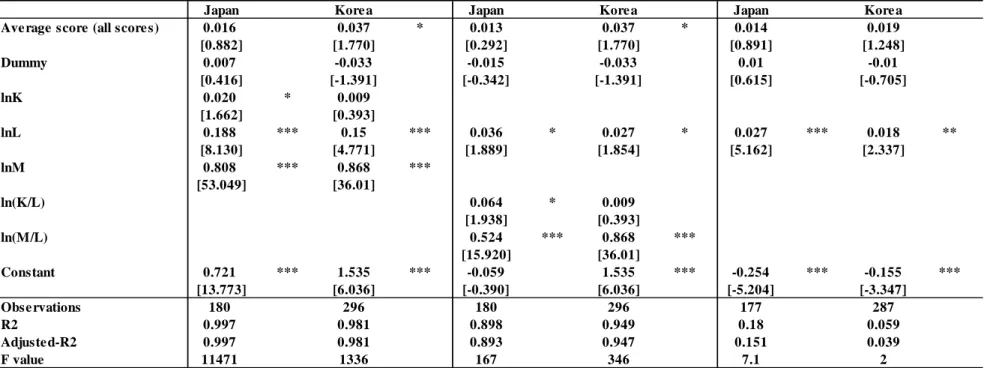
Finally, we estimate Equations (1) and (2) by country. In Table 5-3, we find that some of
while all coefficients in the average score are positive but insignificant in Japanese firms. These
results make us confirm that the improvement in human resource management leads to better
firm performance in Korea. Unlike Table 4-1, organizational reform does not affect firm
performance significantly in Japanese manufacturing firms. From these results, we expect that
organizational reform is effective for better performance in the service sector in Japan.
(Place Table 5-3 here)
4.4 Summary of the Estimation Results
Using the samples in Japanese and Korean firms, we examine the effect of the interview
score indicating management practices and organizational reforms on firm performance. As for
the interview score measuring management practices, we find that the measure indicating
human resource management improves firm performance. Although all coefficients in
organizational reform are positive, we do not find that it affects firm performance significantly.
Estimating a production function by country, we find that improvement in human
resource management leads to better performance in Korean firms. In contrast to Korean firms,
Japanese firms are not affected by management practices. However, organizational reform
improves firm performance in Japanese firms.
Estimation results using the samples in the manufacturing sector are almost similar to the
in Japanese manufacturing firms. The results imply that organizational reforms play a
significant role in improvement in firm performance in the service sector in Japan.
5. Conclusions
Intangible assets have played a key role in productivity growth in the information age.
Among several kinds of intangibles, management skills and human capital are crucial to the
improvement in a firm’s performance. Bloom and Van Reenen (2007) examined the effects of
organizational and human resource management on firm performance using interview surveys
conducted in France, Germany, the UK, and the US. Following their study, we conducted the
interview survey on organizational and human resource management in Japan and Korea.
Based on Bloom and Van Reenen (2007), we constructed scores on management practices
in each firm based on the interview surveys. For organizational management, firms that have
clear organizational targets, better communication amongst employees, and conduct
organizational reforms would have a higher score. For human resource management, firms that
evaluate human resources flexibly and strive to keep employees motivated would mark high
scores.
When we compared the distributions in average management scores between Japanese
and Korean firms, the mean value in Japan was higher than that in Korea. Even when we study
sample in the Korean survey) the result is similar to that in all firms. Comparing the
distributions in the average score between Japan and Korea by size, we found that the gap in the
mean value in firms with fewer than 300 employees is higher than that of firms with more than
300 employees. This gap between Japanese and Korean small and medium sized firms is
explained by the difference in the score of human resource management between both countries.
As a result, we conclude that in Korea, small and medium sized firms are more conservative in
human resources management than in Japan.
Using these scores, we examined the effects of management practices on firm
performance in Japan and Korea. Estimation results using the whole sample showed that the
measure indicating human resource management contributed to better firm performance.
Estimating a production function by country we found that the effect of human resource
management on firm performance appeared in Korean firms. These results in Korean firms are
consistent with our findings in the score distribution in Korean firms in Section 3. In Japanese
firms, organizational reform contributed to improvements in firm performance in the service
sector in Japan.
Our study suggests that organizational reform and human resource management are key
factors to improve firm performance. In the next step, we will try to examine what factors
References
Black, S. and L. Lynch (2005), “Measuring Organizational Capital in the New Economy,” in C.
Corrado, J. Haltiwanger, and D. Sichel (eds.), Measuring Capital in the New Economy, The
University of Chicago Press, Chicago.
Bloom, N. and J. Van Reenen (2007), “Measuring and Explaining Management Practices across
Firms and Countries,” Quarterly Journal of Economics 122, pp.1351-1408.
Corrado, C., C. Hulten, and D. Sichel (2005), “Measuring Capital and Technology: An Extended
Framework,” in C. Corrado, J. Haltiwanger, and D. Sichel (eds.), Measuring Capital in the
New Economy, The University of Chicago Press, Chicago.
Corrado, C., C. Hulten, and D. Sichel (2009), “Intangible Capital and U.S. Economic Growth,”
The Review of Income and Wealth 55, pp. 661-685.Fukao, K., T. Miyagawa, K. Mukai, Y.
Shinoda, and K. Tonogi (2009), “Intangible Investment in Japan: Measurement and
Contribution to Economic Growth,” The Review of Income and Wealth 55, pp. 717-736..
Hao, J., V. Manole, and B. van Ark (2008), Intangible Assets in Europe: Measurement and
International Comparability,” paper presented at the final conference of EUKLEMS Project
held at Groningen.
Ichikowski, C. (1990), “Human Resources Management System and the Performance of U.S.
Kanamori, T. and K. Motohashi (2006), ‘Centralization or Decentralization of Decision Rights?
Impact on IT Performance of Firms,’ RIETI Discussion Paper Series 06-E-032.
Kurokawa, F. and K. Minetaki (2006), “How Can IT Raise Productivity Linked with Workplace
Re-organization and Human Capital in Japan?,” (in Japanese), The Economic Analysis No.
178, pp. 54-95.
Lee, K., T. Miyagawa, S. Kabe, J. Lee, H.Kim., and Y. Kim (2009), “Management Practices and
Firm Performance in Japanese and Korean Firms,” JCER Discussion Paper No. 120.
Marrano, M. G., J. Haskel, and G. Wallis (2009), “What Happened to the Knowledge Economy?
ICT, Intangible Investment and Britain’s Productivity Record Revisited,” The Review of
Income and Wealth 55, pp. 686-716.
Miyagawa, T., M. Ozaki, A. Kawakami, and K. Edamura (2008), “Organizational Reform and
Firm Performance in Japan,” (in Japanese), RIETI Discussion Paper Series 08-J-062.
Shinozaki, A. (2007), “Effective Reforms with Information Technology: Logit Model Analysis
on Business Process Reengineering, Business Unit Restructuring, and Human Resource
Table 1.The Distribution of Firms in Japan and Korea by Industry
Industry
Electric machinery 44 ( 7.7% ) 51 ( 14.6% ) Information and communication machinery 73 ( 12.7% ) 96 ( 27.4% )
Motor vehicles 52 ( 9.1% ) 140 ( 40.0% ) Precision machinery 25 ( 4.4% ) 10 ( 2.9% ) Internet-based services 15 ( 4.3% ) Information service 11 ( 3.1% ) Media activities 14 ( 2.4% ) 9 ( 2.6% ) Retail 230 ( 40.1% ) 18 ( 5.1% ) Total 573 350 Kore a Japan
Number of Firms Number of Firms
135 ( 23.6% )
Table 2.The Distribution of Firms in Japan and Korea by Numbaer of Employee
50-99 100-299 300-499 500-999 1000- Total 50-99 100-299 300-499 500-999 1000- Total Manufacturing 25 63 31 32 43 194 42 180 31 30 14 297 Information related services 43 59 13 17 17 149 5 22 3 0 5 35 Retail 43 80 42 40 25 230 0 11 1 0 6 18 Total 111 202 86 89 85 573 47 213 35 30 25 350 Korea Japan Industry
Table 3-1 Estimation re sults of production function (all firms in Japan and Kore a)
Average score (all scores) 0.011 0.008 0.029 0.022 0.014 0.01
[0.860] [0.609] [0.683] [0.511] [1.266] [0.874] Dummy 0.022 0.054 0.031 ** [1.528] [1.398] [2.444] lnK 0.036 *** 0.035 *** [4.676] [4.581] lnL 0.149 *** 0.15 *** 0.014 0.016 0.005 0.007 [10.159] [10.147] [0.885] [1.024] [1.070] [1.305] lnM 0.817 *** 0.817 *** [67.587] [67.688] ln(K/L) 0.127 *** 0.126 *** [6.985] [6.848] ln(M/L) 0.367 *** 0.368 *** [11.993] [12.030] Constant 2.142 *** 2.144 *** 0.856 *** 0.846 *** -0.076 * -0.077 * [14.009] [13.972] [5.149] [5.091] [-1.793] [-1.749] Obse rvations 866 866 857 857 846 846 R2 0.998 0.998 0.986 0.986 0.016 0.024 Aduste d-R2 0.998 0.998 0.986 0.986 -0.002 0.005 F value 59189.6 55365.2 4142.8 3934.7 1.9 2.2
Note 1. Robust t statistics in bracke ts.
2. Dummy variable s for country × industry are include d in the re gression, but the e stimates of the coe ffiicie nts are not reporte d he re . 3. * significant at 10%; ** significant at 5%; *** significant at 1%.
Table 3-2 Estimation re sults using average score with respect to organizational capital (all firms in Japan and Korea)
Average score (organizational capital) -0.006 -0.01 -0.015 -0.025 0.008 0.003
[-0.498] [-0.833] [-0.417] [-0.669] [0.771] [0.272] Dummy 0.026 * 0.063 0.032 ** [1.750] [1.628] [2.513] lnK 0.036 *** 0.036 *** [4.737] [4.641] lnL 0.15 *** 0.151 *** 0.018 0.02 0.006 0.007 [10.294] [10.290] [1.167] [1.324] [1.269] [1.508] lnM 0.817 *** 0.818 *** [67.432] [67.575] ln(K/L) 0.128 *** 0.127 *** [7.046] [6.909] ln(M/L) 0.368 *** 0.369 *** [12.027] [12.073] Constant 2.162 *** 2.165 *** 0.935 *** 0.927 *** -0.069 -0.069 [14.307] [14.268] [5.707] [5.659] [-1.605] [-1.542] Observations 866 866 857 857 846 846 R2 0.998 0.998 0.986 0.986 0.015 0.023 Adusted-R2 0.998 0.998 0.986 0.986 -0.003 0.004 F value 58621.3 54755.9 4109.1 3913.4 1.8 2.2
Note 1. Robust t statistics in brackets.
2. Dummy variable s for country × industry are included in the regression, but the e stimate s of the coeffiicients are not reported here . 3. * significant at 10%; ** significant at 5%; *** significant at 1%.
Table 3-3 Estimation results using average score with respe ct to human capital (all firms in Japan and Korea)
Average score (human capital) 0.028 ** 0.027 ** 0.075 ** 0.073 ** 0.015 * 0.014
[2.319] [2.260] [2.190] [2.148] [1.668] [1.534] Dummy 0.022 0.054 0.032 ** [1.528] [1.391] [2.511] lnK 0.036 *** 0.035 *** [4.726] [4.624] lnL 0.147 *** 0.148 *** 0.006 0.008 0.005 0.006 [10.004] [9.993] [0.429] [0.533] [0.955] [1.131] lnM 0.816 *** 0.816 *** [68.284] [68.364] ln(K/L) 0.127 *** 0.126 *** [7.026] [6.878] ln(M/L) 0.366 *** 0.367 *** [11.978] [12.004] Constant 2.122 *** 2.121 *** 0.798 *** 0.779 *** -0.127 *** -0.132 *** [13.830] [13.790] [5.134] [5.003] [-2.743] [-2.841] Observations 866 866 857 857 846 846 R2 0.998 0.998 0.986 0.986 0.017 0.026 Adusted-R2 0.998 0.998 0.986 0.986 -0.001 0.007 F value 59760.2 56037.4 4255.8 4044.4 2 2.3
Note 1. Robust t statistics in brackets.
2. Dummy variables for country × industry are included in the regre ssion, but the e stimates of the coeffiicients are not reported he re . 3. * significant at 10%; ** significant at 5%; *** significant at 1%.
Table 3-4 Estimation re sults using the first pricipal factor as an explanatory variable (all firms in Japan and Kore a)
The first pricipal factor 0.002 0.001 0.006 0.004 0.003 0.002
[0.768] [0.483] [0.635] [0.437] [1.252] [0.815] Dummy 0.023 0.054 0.031 *** [1.533] [1.397] [2.434] lnK 0.036 *** 0.035 *** [4.679] [4.585] lnL 0.149 *** 0.15 *** 0.014 0.016 0.005 0.007 [10.167] [10.154] [0.904] [1.048] [1.079] [1.325] lnM 0.817 *** 0.817 *** [67.570] [67.676] ln(K/L) 0.127 *** 0.126 *** [6.989] [6.853] ln(M/L) 0.367 *** 0.368 *** [11.994] [12.032] Constant 2.168 *** 2.161 *** 0.928 *** 0.899 *** -0.04 -0.053 [14.588] [14.582] [6.391] [6.193] [-0.899] [-1.158] Observations 866 866 857 857 846 846 R2 0.998 0.998 0.986 0.986 0.016 0.024 Adusted-R2 0.998 0.998 0.986 0.986 -0.002 0.005 F value 59116.1 55281.4 4136.4 3929.2 1.9 2.2
Note 1. Robust t statistics in brackets.
2. Dummy variable s for country × industry are included in the re gression, but the e stimates of the coeffiicie nts are not reported here. 3. * significant at 10%; ** significant at 5%; *** significant at 1%.
Table 4-1 Estimation results of the production function by country
Japan Korea Japan Kore a Japan Korea
Average score (all scores) -0.012 0.009 -0.045 0.009 -0.01 0.009 **
[-0.757] [1.477] [-1.222] [1.477] [-0.670] [2.063] Dummy 0.029 * -0.015 0.052 -0.015 0.034 ** -0.004 [1.898] [-0.788] [1.606] [-0.788] [2.500] [-0.277] lnK 0.03 *** 0.032 ** [4.836] [2.023] lnL 0.191 *** 0.132 *** 0.009 0.0228 * 0.008 0.017 * [14.711] [5.549] [0.694] [1.959] [1.407] [1.921] lnM 0.779 *** 0.858 *** [69.427] [41.16] ln(K/L) 0.067 *** 0.0323 ** [5.012] [2.023] ln(M/L) 0.467 *** 0.858 *** [19.086] [41.16] Constant 0.979 *** 1.505 *** 0.603 *** 1.505 *** -0.076 -0.105 ** [17.819] [7.056] [4.379] [7.056] [-1.436] [-2.114] Observations 520 349 520 349 510 340 R2 0.991 0.983 0.832 0.954 0.018 0.083 Adjusted-R2 0.991 0.983 0.829 0.952 0 0.058 F value 6026.6 1491 256.6 379 1.8 3
Note 1. Robust t statistics in pare nthese s.
2. * significant at 10%; ** significant at 5%; *** significant at 1%.
Table 4-2 Estimation re sults using the first pricipal factor as an e xplanatory variable by country
Japan Kore a Japan Kore a Japan Kore a
The first pricipal factor -0.004 0.009 -0.012 0.01 * -0.002 0.008 **
[-1.012] [1.477] [-1.455] [1.742] [-0.681] [2.063] Dummy 0.03 * -0.015 0.054 * -0.013 0.035 ** -0.004 [1.964] [-0.788] [1.685] [-0.661] [2.534] [-0.277] lnK 0.03 *** 0.032 ** [4.847] [2.023] lnL 0.192 *** 0.132 0.009 0.024 ** 0.008 0.017 * [14.722] [5.549] [0.758] [1.991] [1.414] [1.921] lnM 0.779 *** 0.858 [69.449] [41.16] ln(K/L) 0.067 *** 0.033 ** [5.026] [2.103] ln(M/L) 0.467 *** 0.85 *** [19.109] [39.44] Constant 0.944 *** 1.505 0.475 *** 1.595 *** -0.111 ** -0.105 ** [21.076] [7.056] [4.257] [7.233] [-2.449] [-2.114] Obse rvations 520 349 520 342 510 340 R2 0.991 0.983 0.833 0.952 0.018 0.083 Adjusted-R2 0.991 0.983 0.829 0.95 0 0.058 F value 6014.1 1491 256.4 364 1.8 3
Note 1. Robust t statistics in pare nthe se s.
2. * significant at 10%; ** significant at 5%; *** significant at 1%.
Table 5-1 Estimation re sults of production function (all firms in the manufacturing se ctor in Japan and Kore a)
Ave rage score (all score s) 0.021 0.019 0.051 0.048 0.01 0.008
[1.620] [1.462] [0.796] [0.744] [0.939] [0.734] Dummy 0.014 0.023 0.014 [0.906] [0.412] [1.197] lnK 0.017 0.016 [0.980] [0.942] lnL 0.153 *** 0.153 *** 0.045 * 0.046 * 0.024 *** 0.024 *** [6.856] [6.854] [1.742] [1.758] [5.463] [5.527] lnM 0.846 *** 0.846 *** [47.292] [47.132] ln(K/L) 0.194 *** 0.193 *** [4.327] [4.290] ln(M/L) 0.292 *** 0.293 *** [6.178] [6.177] Constant 1.801 *** 1.803 *** 4.758 *** 4.76 *** -0.175 *** -0.173 *** [10.396] [10.368] [8.436] [8.420] [-4.185] [-4.049] Obse rvations 473 473 465 465 460 460 R2 0.999 0.999 0.982 0.982 0.092 0.095 Aduste d-R2 0.999 0.999 0.982 0.982 0.074 0.075 F value 77651.4 71707.9 4655.9 4402.8 5.1 5.4
Note 1. Robust t statistics in bracke ts.
2. Dummy variable s for country × industry are include d in the re gre ssion, but the e stimate s of the coe ffiicie nts are not re porte d he re . 3. * significant at 10%; ** significant at 5%; *** significant at 1%.
lnTFP (Tornqvist inde x) ln(Y/L)
Table 5-2 Estimation results using average score with respect to human capital (all firms in the manufacturing sector in Japan and Korea)
Average score (human capital) 0.028 ** 0.027 ** 0.085 * 0.084 * 0.01 0.01
[2.093] [2.053] [1.807] [1.788] [1.314] [1.205] Dummy 0.015 0.024 0.014 [0.982] [0.432] [1.243] lnK 0.017 0.017 [1.002] [0.961] lnL 0.151 *** 0.151 *** 0.038 0.038 0.024 *** 0.024 *** [6.816] [6.814] [1.486] [1.492] [5.453] [5.479] lnM 0.846 *** 0.846 *** [47.630] [47.472] ln(K/L) 0.194 *** 0.193 *** [4.356] [4.315] ln(M/L) 0.293 *** 0.294 *** [6.206] [6.197] Constant 1.8 *** 1.8 *** 4.737 *** 4.736 *** -0.172 *** -0.172 *** [10.459] [10.441] [8.552] [8.534] [-4.190] [-4.125] Observations 473 473 465 465 460 460 R2 0.999 0.999 0.982 0.983 0.093 0.097 Adusted-R2 0.999 0.999 0.982 0.982 0.075 0.077 F value 77780.8 71978.9 4765 4503.4 5.1 5.5
Note 1. Robust t statistics in brackets.
2. Dummy variables for country × industry are included in the regression, but the estimates of the coe ffiicients are not reporte d here. 3. * significant at 10%; ** significant at 5%; *** significant at 1%.
Table 5-3 Estimation results of the production function in the manufacturing se ctor by country
lnY ln(Y/L) lnTFP (Tornqvist index)
Japan Kore a Japan Kore a Japan Kore a
Ave rage score (all score s) 0.016 0.037 * 0.013 0.037 * 0.014 0.019
[0.882] [1.770] [0.292] [1.770] [0.891] [1.248] Dummy 0.007 -0.033 -0.015 -0.033 0.01 -0.01 [0.416] [-1.391] [-0.342] [-1.391] [0.615] [-0.705] lnK 0.020 * 0.009 [1.662] [0.393] lnL 0.188 *** 0.15 *** 0.036 * 0.027 * 0.027 *** 0.018 ** [8.130] [4.771] [1.889] [1.854] [5.162] [2.337] lnM 0.808 *** 0.868 *** [53.049] [36.01] ln(K/L) 0.064 * 0.009 [1.938] [0.393] ln(M/L) 0.524 *** 0.868 *** [15.920] [36.01] Constant 0.721 *** 1.535 *** -0.059 1.535 *** -0.254 *** -0.155 *** [13.773] [6.036] [-0.390] [6.036] [-5.204] [-3.347] Obse rvations 180 296 180 296 177 287 R2 0.997 0.981 0.898 0.949 0.18 0.059 Adjuste d-R2 0.997 0.981 0.893 0.947 0.151 0.039 F value 11471 1336 167 346 7.1 2
Note 1. Robust t statistics in pare nthe se s.
Figure 1 – 1 Distribution of Management Scores (All firms) 0 .2 .4 .6 .8 Ke rnel d en si ty 1 2 3 4 Average score Korea Japan
Figure 1 – 2 Distribution of Management Scores (Manufacturing firms)
0 .2 .4 .6 .8 Ke rnel d en si ty 1 2 3 4 Average score Korea Japan
Figure 1 – 3 Distribution of Management Scores (Information-related firms)
0 .2 .4 .6 .8 Ke rn el de n si ty 1 2 3 4 Average score Korea Japan
Figure 1 – 4 Distribution of Management Scores (Retail firms) 0 .2 .4 .6 .8 1 Ke rnel d en si ty 1 2 3 4 Average score Korea Japan
Figure 2 – 1 Distribution of Management Scores in Organizational Capital (All firms)
0 .2 .4 .6 .8 Ke rnel d en si ty 1 2 3 4 Average score Korea Japan
Figure 2 – 2 Distribution of Management Scores in Organizational Capital (Manufacturing firms) 0 .2 .4 .6 .8 Ke rnel d en si ty 1 2 3 4 Average score Korea Japan
Figure 2 – 3 Distribution of Management Scores in Organizational Capital (Information-related firms) 0 .2 .4 .6 .8 Ke rn el de n si ty 1 2 3 4 Average score Korea Japan
Figure 2 – 4 Distribution of Management Scores in Organizational Capital (Retail firms)
0 .2 .4 .6 .8 Ke rn el de n si ty 1 2 3 4 Average score Korea Japan
Figure 3 – 1 Distribution of Management Scores in Human Capital (All firms)
0 .2 .4 .6 .8 Ke rnel d en si ty 1 2 3 4 Average score Korea Japan
Figure 3 – 2 Distribution of Management Scores in Human Capital (Manufacturing firms) 0 .2 .4 .6 .8 Ke rnel d en si ty 1 2 3 4 Average score Korea Japan
Figure 3 – 3 Distribution of Management Scores in Human Capital (Information-related firms) 0 .2 .4 .6 .8 Ke rn el de n si ty 1 2 3 4 Average score Korea Japan
Figure 3 – 4 Distribution of Management Scores in Human Capital (Retail firms)
0 .2 .4 .6 .8 Ke rnel d en si ty 1 2 3 4 Average score Korea Japan
Figure 4 – 1 Distribution of Total Scores of Firms with 300 or More Employees (All firms) 0 .2 .4 .6 .8 Ke rne l den si ty 1 2 3 4 Average score Korea Japan
Figure 4 – 2 Distribution of Total Scores of Firms with Fewer than 300 Employees (All firms) 0 .2 .4 .6 .8 Ke rne l den si ty 1 2 3 4 Average score Korea Japan
A p pendix 1. Q u estionnair e A b out the scoring Q uant itat iv e accompanying inf o rm a tion 1. P erm eati on of m a nageme nt pri n c ipl es (vi si o n) 2 Do es you r c o m p an y ha v e m an age m e nt p ri n ci pl es t h at i t ha s u p h el d f o r m an y y ea rs ? 3 4A re t h e m an ag em e n t p rinci p les also su pp or ted b y p a rti es such a s exter n al p ar tner s or the shar eho ld e rs? 2 . Imple m ent a tion of organiz ational goals 2 A re there specifi c num er ical g o a ls on m u ltiple lev els that g o bey ond b e ing j u st a v ision or a slog an, reg ardless of th e lev el o f t h e g o al s (such a s com p any -wide or div isional o r se ctional g o als) ? 3 A re the g o als of ea ch div isi o n a d ju sted in e ach div ision to ensu re con si st ency b e tw ee n div isions? 4 Is consistency m a in ta
ined between these g
o al s and the g o als of th e m an age m e nt p ri n ci p le s o r of t h e l o ng-te rm c o m p a ny-wi d e g o al s? 2-1. I m p lem entation o f org aniz a tion a l g o a ls (setting targ et lev el s) 2 3A re t h e targ et l ev e ls appropriate ly set as n on-b in d ing chanlleng es? 4 ( ) 2-2. I m p lem entation o f org aniz a tion a l g o a ls (p erm eati o n of g o als) 2 D o a ll e m ploy ee s k now a b out the g o als? 3 If g o al s exist on v ar io u s l ev e ls ( su c h as c o m p a n y -w ide, div isional and secti o nal g o als) , d o a ll e m ploy ee s un der stand the lev el of prior ity of t h e g o al s? ( ) 4 D o all em p lo y ee s a c ce p t th e ta rg et lev els? P lea se g iv e an e x am p le if p o ssib le. ( ) 2-3. I m p lem entation o f org aniz a tion a l g o a ls (d eg ree to w h ich g o a ls a re achie v ed, check s on p e rf orm a nce) 2 A re c h e ck s m ade to see ho w fa r g o als h a v e b e en ac h iev e d ? Ple ase g iv e a n exam ple o f how such c h e ck s ar e m ade. ( ) 3 ( ) 4 A re a d dit io n al chec k s m ade tha t ar e d e cided by th e sec tion or depar tm e nt inv o lv ed itse lf, r ather than j u st being fixed c h e ck s? 2 -3-1. Im plem entation of o rg a n iz ational g o als (per m ea tion o f deg re e to wh ic h g o al s ar e a chiev ed, a n d r esults o f chec k s o n per for m ance ) 2 A re the results o f such ch eck s m ade o p enly av ailab le w ith in y o u r div ision ? 3 A re the results o f such ch eck s m ade o p enly av ailab le w ith in n o t o n ly y our d iv ision bu t also bet w een r el ev a n t d iv isions? 4 A re adj u stm ents m a d e to en sure that the deg ree to w h ic h g o al s hav e been a chiev ed at diff er ent div ision s i s f air ly com p are d ? ( for exam ple , util iz ing c o m m on scal es such a s o v er tim e hou rs ?) A re t ar g et lev els c h e ck ed to ensure ther e i s fa irne ss b e tw ee n div isions or secti o ns? Pl ea se g iv e an exam ple of ho w they ar e c h e ck e d . Wh a t k in d of schem es a re in plac e to hav e th ose m anag em e n t prin ci p le s shar ed by a ll e m ploy ee s? ( F or exam ple, anno uncing them at t h e m o rn ing a ss e m b ly , o r m ak ing t h em p o rtable b y w riting them o n card s o r such li k e.) F o r exam ple, are the setting s for the div ision al or secti o nal targ et lev el s sim p ly g iv en to y o u fro m the d iv ision or secti o n ab ov e y o u ? O r are they g iv e n to y ou w h ile consid ering the op in ions of y our div ision or se ction? A re such c h e ck s m ade on a per iod ic basis ra th e r th a n being m ade as nece ssar y ? A n d h o w fr equ e n tly a re such chec k s m ade?
2-3 -2 . I m pl e m e n ta ti o n o f o rg a n iza ti o na l goa ls ( re sul ts o f c h e c ks - h a n d li n g w h e n g o a ls ha v e no t be e n a c hi e v e d ) 2 Is a m eet in g c o nsisting o f m a nag e ri al sta ff a n d e m ploy ee s prom ptly held a s so on as it i s k now n that the g o a ls w e re no t achie v e d? 3 A fte r inv e sti g ati o ns, ar e poin ts to r e v ise spre ad thr o ug hou t th e di vi si o n , a n d a re m e a sur e s f o r ha nd li n g th e f a il ur e t o a c h ie v e the g o a ls prom ptl y im p lem en ted? (I n this c a se, excl u d e p e rson nel m a tter s.) 4 A re problem a tic issu e s and counter m e a sur es m a de t h oroug hly k now n throug hou t the r e le v a n t d iv ision, a n d i f n e cessar y , other div isions? P lease g iv e an exam p le if possib le. ( ) 2-3 -3 . I m pl e m e n ta ti o n o f o rg a n iza ti o na l goa ls ( re sul ts o f c h e c ks - h a n d li n g w h e n g o a ls ha v e be e n a c hi e v e d ) 2 W h e n g o a ls ar e a c h iev ed a re in v e stig atio n s m a d e so th a t th o se g o als renewed on a c o nti n uou s b a sis or so th a t hig h e r g o als a re set? 3 H o w long is it bet w een th e set ting of hig h er g o a ls and the o p er ati o n / im ple m entat io n of those g o a ls? 4 A re these m e a su res i n sti tu tion a liz ed on a com p any -w id e lev e l? 3 . N o n-st yliz ed communi cation w it h in the orga niz a ti on 2 A re m e asures and act iv it ies other than st y liz e d m e e ting s used t o incre a se inform al c o m m unicat io n? (fo r ex am p le, inform al m e etin g s co nsisti n g on ly of k e y p er son n el )? Plea se g iv e a n ex am p le. ( ) 3 A re inform al m e etin g s h e ld betw e e n div isi o n s? 4 A re inform al m e etin g s h e ld w ith p e rs o ns of va ri ou s r a n k s? 4 . Imple m ent a tion of organiz ational r e fo rm 2 Ha s y ou r com p an y un der g one a n y or g aniz at io nal reform s in th e las t ten y ea rs? When did it occur ? ( ) 3 D id y our com p any u se a con sulting com p any at th at ti m e ? H ow m u ch did it cost? ( ) 4 D id y ou determ in e the res u lt s of th e reform in a quantified m a n n er? B y wh a t p er ce n ta g e did p rofits increase or b y wh a t p er centa g e wer e co sts red u ced ? ( ) 4-1. Pe riod of o rg a n iz a tional ref o rm or stra teg ic c h a n g e 2 D id i t tak e tim e to im plem en t the org a niz a tion a l refo rm o v e r on e y e ar ? H o w m a ny y e ars w e re spent includ in g pre p a ra tion p e riod? ( ) 3 W hy w a s th e org a niz a tional re form nece ssary ? Was is to do w ith the lea d e rship of th e top m a n a g e m e nt? 4 D u ri ng t h e or g a ni za ti o n a l re fo rm , d id t h e m id -l e ve l m a n a ge m e nt a ls o s tr ive t o a c h ie ve t h e r e fo rm , th e re by gi v in g a se ns e o f un ity in t h e com p any ? 4-2. Sc o p e o f t h e ef fe cts of org a niz a ti o n al re for m 2 ( Writ e the exam p le here ) 3 ( ) 4 ( ) 4-3. Detai ls of th e org a niz a ti o n al re for m ( d eleg ation of autho rity ) Wh e n a c o m p a n y und e rg o e s org a niz a tional re form , som e tim e s the em ploy ee s' dec ision -m ak ing authority is also r e v ised. I n t he case of y our c o m p a n y , 2 W as d e cision-m a k ing a u th or ity g iv e n to those i n a low e r p o sition a s a r e sult o f the org a niz a tional re form ? W e re t h e e ff e c ts of t h e r e fo rm s h ow n i n t h e di vi si o n s or s e c tions? I f they w e re , plea se g iv e an e x a m ple o f the ef fe cts. W e re t h e e ff e c ts of t h e r e fo rm s h ow n be tw e e n d iv is io n s, a n d no t j u st wi th in on e di vi si o n ? I f t h e y we re s h own b e tw e e n di vi si o n s, plea se g iv e an e x a m ple o f the ef fec ts. W e re t h e e ff e c ts of t h e r e fo rm s h ow n be tw e e n th e c o m p a ny a n d t h e bu si n e ss pa rt n e rs , a n d no t j u st wi th in t h e c o m p a n y? I f t h e y we re , plea se g iv e an e x a m ple o f the ef fec ts.
3 W ere p o sts sim p lifi e d in co nj unction w ith d e cision-m a k ing auth ority b e ing g iv e n to those in a low e r position? 4 A s a result, w a s th ere a chang e in the d e tails o f the j ob or the w a y of do in g the job? Ple a se g iv e a n exam ple . ( ) 4-4. Detai ls of th e org a niz a ti o n al re for m ( IT ac tiv ities) 2 D id t h e I T sy st em m a k e y o u r com p any m o re str eam lined, f o r exam ple by r e ducing th e am o unt of paper-ba se d do c u m e ntation ? 3 In the last d e cade, did y our com p any l a un ch o rg a n iz a tional refo rm
, rather than raise bu
si n e ss efficiency , by u tiliz ing the I T sys tem ? 4 ( ) 5 . P r omotion syst em 2 D oes y o u r com p any m a inly hav e a perf orm a nce-base d p rom otion sy stem ? 3 If th e prom otion sy st em is m a inly a per for m a nce -b a se d on e , does y o u r com p any h a v e a m a nag e m e n t-b y -o b je ctiv es sy stem ? I f it do e s, w h en did t h a t sy st em b e g in? 4 D id the p e rf o rm a n c e of the e m ploy ee s im pr o v e as a re su lt of u sing the m a nag e m e nt-b y -obj e c tiv es sy stem and introducing a per for m a nce -b a se d prom otion sy ste m ? 6. Sche mes to i m prove mot ivat ion 2 ( ) 3 Is that schem e us ed on an institutional b a sis throug hou t the co m p an y ? 4 D o y ou m onitor w h en the em ploy ee s' m o ti v a ti o n , re tention ra te o r j o b per fo rm ance incr ea se s as a r e sult o f such schem e ? 7 . Ha ndling em ploy e e s t h at perf orm po orl y 2 A re they hand le d in som e sp e c if ic w a y other than by g iv in g them ora l w a rning s? 3 D oes that hand li n g include m easur es that ar e i m pl em ented f a ster than th e av er ag e te rm o f of fic e ? 4 A re the m e a sur es i m plem e n te d as soon as a problem is c o nf irm e d ( b e fore a routine r o tati o n ) ? 8 . Ha ndling em ploy e e s t h at perf orm w e ll 2 Is it m a de clea r w ithin the d iv ision that the e m plo y e e 's per form a nce is g o od, f o r e x a m ple b y m a n a g e m e nt pr aising em ploy e e s a t m e eting s? 3 Is ther e a sy ste m t o con n ec t g o od per form a nce to thing s such as fin a ncial rew a rd or pro m o tio n? 4 W as the m o tiv ation of th e em p lo y ees raised throug h introd ucing such sy stem ? 9. Sec u ri ng good manpow e r 2 C a n y ou identif y th e hig h per fo m a nce and core em ploy e e s, m e ntioned in t h e qu e stion 9 , in y o u r com p any ? Ple a se g iv e a n exam ple . ( ) 3 S u c h excel lent e m plo y e e s ar e t rea ted w e ll com p are d e w it h o rdinary e m plo y ees? I f so, how they a re tre a te d ? ( ) 4 C ould y ou pre v e n t the loss of such exce llent em ploy ee s? A re ther e a n y sche m e s other than pr o m o tio n-re la ted or p a y -r e la ted sy st em s t o incre a se the m o ti v a ti o n of the em ploy ee s? Pl ease g iv e an exam p le . D id a n op portunity to ea rn new profi ts ar ise as a r e su lt of the org a niz a tion a l refo rm b y the o rg a n iz a tion a l refo rm baseo on the IT sy ste m ? P lease g iv e an exam p le.
10. E val uati ng the i n terpe rs o nal s k il ls of the manage rs 2 D o the m anag e rs g iv e c lear c rit eri a such a s the deg re e t o w h ich per so n s of a lo wer po sit io n shou ld b e nu rt ure d ? 3 Is ther e a n incentiv e sy stem , such as a pay -re late d o r pr o m o ti o n -re la te d s y st em , to re w ard m a n a g ers th at h av e n u rtu red e x ce lle nt sta ff of a lo wer po sit io n ? 4 D id the m o tiv ation o f t h e m a n a g ers increas e as a result o f introd ucing such sy stem ? 11. Nurt uri n g h u man re so ur ces thr o ugh t rai ni n g 2 ( ) 3 D o tho se tr aining acti v iti es help t o im prov e busi n e ss re su lt s? Pl ease g iv e an exam p le . ( ) 4 A re the effects of tho se training activ ities adaptab le to other com p anies? 12 . Nur tur in g human r esource s t h rou g h OJ T 2 Is O JT per fo rm ed on a daily basis? ( ) 3 D oes O JT con tribute t o b u siness r esults? P lease g iv e an ex am ple. ( ) 4 A re the eff ec ts of O JT m o nitor ed? Ple ase g iv e a n exam ple of th e m e tho d s used. ( ) 1 3 . E m p lo y ee s' ex p e rt ise 2 A re em p lo y ees rotat ed in a fixe d sc hedu le , such a s on c e e v er y tw o or thre e y ear s? 3 T o i m prov e the e x per tise of th e em p lo y ees, ar e th e y assig n ed t o a se t po si tion for a l o ng tim e? 4 Is ther e a sy ste m at ic pr o g ra m i n p la ce to ensure the e m ploy ee s ac q u ir e som e exper tise? (T raining on an occu pat io n al abili ty b a si s m e ans training i n sp ecial
ist capabilities that
are required in each fi eld, s u ch as m anag e m ent, b u siness, re sear ch a n d dev elopm ent, and m a n u factur in g . A ssig n m ent-based tr ai n ing m e ans tr aining in ar eas su c h as la n g u ag e s, O A , c o m p uting , a n d a cqu is ition o f of fic ial cer tif ica tion s. ) What perc entag e of the super v isor' s w o rk ing t im e is spent on g iv ing instruct io ns t o th ose in a low er position? Is there trai n ing on an occupational ability basis o r an a ssig n m e n t basis, aim in g to im p rov e the wo rk sk ills o f th e em ploy e es? Ov er t h e course o f one y ear , o n a v e rag e how l o ng is spent on tr aining ?
Appendix 2 The results of principal component analysis
Japan Korea Question
s
1st component 2nd component 1st component 2nd component
q1 0.19 0.11 0.17 0.16 q2 0.24 0.12 0.20 0.19 q2_1 0.19 0.06 0.17 0.10 q2_2 0.23 0.13 0.25 0.24 q2_3 0.23 0.15 0.20 0.25 q2_3_1 0.19 0.17 0.19 0.22 q2_3_2 0.24 0.23 0.25 0.22 q2_3_3 0.19 0.15 0.20 0.15 q3 0.19 0.04 0.23 0.01 q4 0.24 -0.41 0.19 -0.46 q4_1 0.29 -0.44 0.20 -0.41 q4_2 0.27 -0.38 0.24 -0.34 q4_3 0.22 -0.20 0.20 -0.20 q4_4 0.26 -0.30 0.24 -0.36 q5 0.14 0.15 0.25 0.05 q6 0.21 0.17 0.20 0.01 q7 0.18 0.07 0.22 0.02 q8 0.18 0.22 0.19 0.04 q9 0.13 0.08 0.22 -0.07 q10 0.20 0.14 0.20 0.08 q11 0.18 0.19 0.19 0.02 q12 0.18 0.10 0.20 0.03 q13 0.12 0.05 0.18 0.08