NEUTRON ATTENUATOR PROTOTYPE TESTS
ON THE PF1000 PLASMA FOCUS NEUTRON GENERATOR
*T. CRACIUNESCU1,*. M. CURUIA2, M. GHERENDI1, S. JEDNOROG3, M. PADUCH3,
R. PROKOPOWICZ3, M. SCHOLZ3, S. SOARE2, V. ZOITA1,
and JET-EFDA CONTRIBUTORS***
JET-EFDA, Culham Science Centre, Abingdon, OX14 3DB, United Kingdom
1EURATOM-MEdC Association, National Institute for Laser, Plasma and Radiation Physics,
Bucharest, Romania
2EURATOM-MEdC Association National Institute for Cryogenics and Isotopic Technologies,
Rm. Valcea, Romania
3Association EURATOM-IPPLM, Institute of Plasma Physics and Laser
Microfusion, Warsaw, Poland
4Association EURATOM-CCFE, Culham Centre for Fusion Energy, Abingdon, UK 5EFDA-JET CSU, Culham Science Centre, Abingdon, UK
***See the Appendix of F. Romanelli
et al., Proceedings of the 24th IAEA Fusion Energy Conference
2012, San Diego, USA
** Corresponding author – email: [email protected]
Received July 27, 2013
Abstract. The gamma-ray cameras, with its spectrometric and imaging capabilities, represent a very useful diagnostic tool for the study of fast ion evolution in JET plasmas. For operating this diagnostic at high power deuterium pulses and to deuterium-tritium discharges an upgrade has been considered to be necessary for the control of the neutron and gamma-ray radiation fields. A set of neutrons attenuators for the vertical and horizontal cameras were designed and constructed in order to reduce the neutron flux at the gamma-ray detectors and to make possible gamma-ray imaging measurements. The radiation performance of the GRC neutron attenuators as well as the response of the gamma-ray detectors have been addressed by means of neutron and gamma-ray transport calculations. The numerical simulations were checked against experimental results obtained using the neutron attenuator prototype installed on a high power pulsed fusion neutron source, the Plasma Focus Installation PF1000 at IPPLM, Warsaw, Poland.
Key words: plasma diagnostic, gamma-ray cameras, neutron attenuators, tokamak.
1. INTRODUCTION
The confinement of fast particles produced in fusion reactions is of crucial importance for future fusion devices like ITER (International Thermonuclear
* Paper presented at the 16th International Conference on Plasma Physics and Applications,
1062 T. Craciunescu et al. 2
Experimental Reactor) and DEMO (DEMOnstration Power Plant). A useful
diagnostic for the study of the fast particles in tokamak plasmas is based on the detection and analysis of the gamma radiation emitted as the result of the nuclear interactions of fast ions (fusion reaction products, including alpha particles, NBI (Neutral Beam Injection) ions, ICRH (ion cyclotron resonance heating) accelerated
ions) with plasma impurities such as carbon and beryllium [1, 2]. At JET the information provided by the emitted gamma radiation is obtained by using two types of diagnostic devices: i) a Gamma-Ray Camera (GRC) which provides a 2D distribution in a poloidal plane of the gamma-ray emission and ii) a set of collimated gamma-ray spectrometers which provide gamma-ray spectra recorded along two vertical and one quasi-tangential lines of sight. GRC has already provided valuable information on the fast ion evolution in JET plasmas. Gamma-ray diagnostics at JET (gamma-Gamma-ray spectrometry [3] and imaging [4]) have provided some of the most interesting results in experiments such as those of the Trace-Tritium-Experiment campaign [5]. The possible future deuterium-tritium experiments on JET are expected to produce significant population of alpha particles at plasma parameters approaching as closely as possible the ITER values. Therefore it will be a good opportunity for experiments related to study fusion alphas.
The applicability of this diagnostic to high performance deuterium and deuterium-tritium JET discharges is however strongly dependent on the fulfillment of rather strict requirements for the definition and characterization of the neutron and gamma radiation fields (e.g., neutron flux on the detector, level of the gamma
radiation background). Such requirements can be fulfilled by using so-called neutron/gamma radiation filters (or neutron attenuators) within the gamma-ray diagnostics system. Design solutions for adequate neutron attenuators have been developed for the upgrade GRC, one of the major JET gamma-ray diagnostics. The attenuation factor was the main design parameter for a set of three neutron attenuators, of different shape and attenuation length, using light water as attenuating material, have been designed for the horizontal and vertical cameras [6].
A full-scale prototype of the vertical camera neutron attenuator was constructed and mechanical tests were performed. The mechanical behavior of the attenuator structure subject to the forces and torques produced by the JET disruptions was analyzed by means of the finite element analysis method. The same prototype was used also for the experiments performed in order to determine the radiation performance. The experiments were performed by using the PF-1000 plasma-focus device at the Institute of Plasma and Laser Microfusion IPPLM, Warsaw as a fusion neutron generator. The results reported here were included in the commissioning procedure for this diagnostics upgrade.
2. METHODS
The main objective of the experiments was to determine the attenuation factor and to compare it with the estimation provided by the neutron and
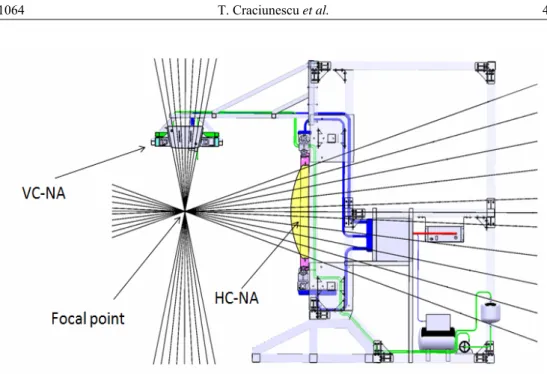
gamma-ray transport calculations. The experiments should prove that the value of the attenuation factor is in agreement with the value estimated to be attainable within the project constraints (Table 1). Initially it was planned to perform the tests at the JET site, using a specially designed test stand, using a point neutron source (Cf-252), placed at a focal point common to the two attenuators (Fig. 1). This configuration allows in principle the measurement of integrated neutron flux and also of neutron energy distribution behind the attenuators. However, due to various reasons mainly related to the schedule of the JET neutron calibration this proposal was dropped although the test stand was designed and built. Therefore an independent setup was planned in order to get experimental information on the neutronics performance of the neutron attenuator prototype.
This setup was accomplished at the Institute of Plasma Physics and Laser Microfusion, Warsaw, Poland, where the neutron source is provided by the Plasma-Focus PF1000 device. This is the largest dense magnetized plasma facility in the world and in the same time, the main plasma installation of the International Centre for Dense Magnetized Centre. The main electromagnetic parameters are given in Table 2 [7]. Other characteristic information is provided in Figs. 2–5 and further details can be found in [8, 9].
Table 1
The attenuation factors estimated to be attainable within the project constraints Neutron energy Neutron attenuator Material
2.45 MeV 14.1 MeV KN3-HC-NA H2O 102 KN3-VC-NA (Long) H2O 104 KN3-VC-NA (Short) H2O 102 Table 2
Main electromagnetic parameters of PF-1000 Capacitor bank charging voltage: 20–40 kV Capacitor bank stored energy: 266–1064 kJ Current rise-time: 6 μs
1064 T. Craciunescu et al. 4
Fig. 1 – Initial test configuration (VC-NA stands for Vertical Camera Neutron Attenuator and HC-NA
stands for Horizontal Camera Neutron Attenuator).
Fig. 3 – XUV frames obtained using an exposure time of 2 ns and a window of 200–300 eV + above 600 eV; a–c) pinch Ø 1–2 cm; d) first expansion; e–f) second pinch; g–i) explosion, dense structure
without zipped-effect dense spherical structure.
Fig. 4 – PF-1000 typical shot. Soft X-ray signal (green) and dl/dt discharge (black) for shot 0703-09. Hard X-ray and neutron signal – 15 m downstream (red).
1066 T. Craciunescu et al. 6
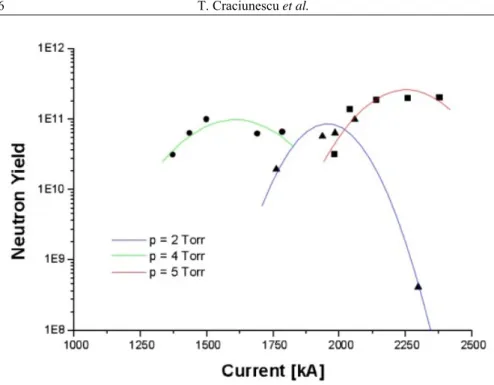
Fig. 5 – Neutron yield (end-on) as a function of the maximum discharge current.
The setup comprises the use of super-heated fluid detectors, SHFFD’s (also known as "bubble detectors") [10] for measuring the transfer function of attenuator. SHFD are suspensions of metastable droplets which readily vaporize into bubbles when they are nucleated by radiation interactions. The active detecting medium is in the form of microscopic (20–50 μm) droplets suspended within an elastic polymer. The phenomenon of neutron detection by a SHFD is a mixture of nuclear interactions (neutron collisions with nuclei of the active medium), thermodynamic behavior of the detecting medium (the super-heated fluid), and the mechanical response of the elastic polymer. If sufficient energy is transferred from the colliding neutron to the nucleus of one of the elements in the composition of the active medium, the recoil nucleus will initiate the generation of a vapor embryo of sub-micron dimensions. Under proper conditions (that depend on the thermodynamics of the active medium) the vapor embryo will lead to the vaporization of the super-heated droplet with the subsequent expansion into a macroscopic (0.2–0.5 mm) bubble. The SHFD’s have a threshold-type energy response with the threshold energy depending on droplet composition, detector operating temperature, detector operating pressure. For a standard bubble detector like the BD-PND type, the energy response is approximately flat within the range 0.3–10 MeV.
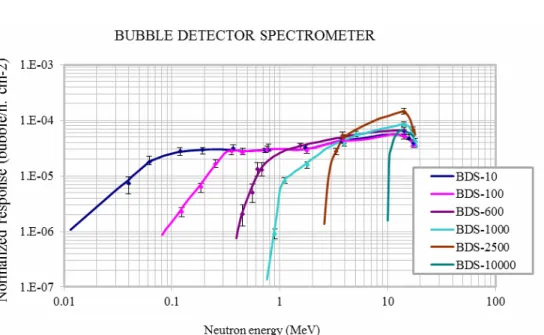
Fig. 6 – BDS neutron energy response.
Using detectors with different energy thresholds, a bubble detector spectrometer (BDS) is obtained. The BDS covers a broad energy range (0.01 – 20 MeV) and provides six energy thresholds in this range (Fig. 6). Therefore the SHFD detectors have been used for measuring the neutron fluence and also to determine the energy distribution.
As the experiments provide a large amount of experimental data, it was necessary to develop a software package in order to ensure an automatic counting of the bubbles in each detector with enough precision and allowing fast data processing. The software implements a sequence of image processing techniques which are briefly presented here. The first step consists in an automatic threshold for isolating the bubble structure. By determining a threshold value for the histogram h of the image grey-levels, the image is segmented into a particle region,
which contains the objects under inspection, and a background region. The particle region is usually represented in white pixels while the background is represented in black pixels. The thresholding procedure is based on the entropy criterion. The entropy of a histogram of an image with grey levels in the range [0, N – 1] is
, where is the probability of
occurrence of the grey-level i. The sum of the entropies associated with the black
pixels in the image Hb(k) and with the white pixels Hw(k) respectively, is maximised in order to retrieve the thresholding value .
1068 T. Craciunescu et al. 8
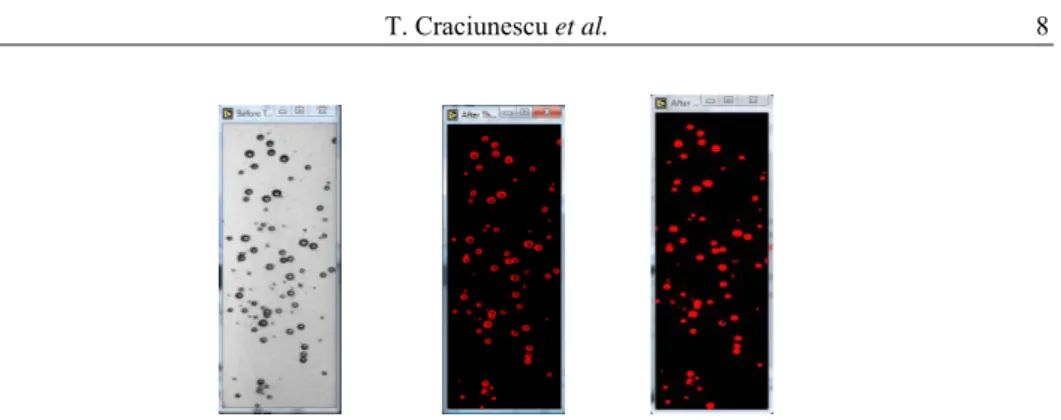
Fig. 7 – Illustration of the image processing sequence for bubble detector counting: recorded image of bubbles (left), the image after thresholding and opening-dilation process (middle) and the image after
filling holes and smooth right angles (right).
Very small particles, which do not correspond to neutron detection, are removed by using an image opening function followed by dilation. This operation does not significantly alter the area and shape of particles because erosion and dilation are dual transformations, in which borders removed by the erosion process are restored during dilation. Filling holes and smoothing of right angles along the edges of particles is performed prior to evaluate particle parameters. Pixels are added to the image in a neighbourhood that matches a template specified by the structuring element. A 4-connectivity structure element proved to be an optimum choice for this kind of images. The Heywood circularity factor [11] is used in order to classify the particles in the image. The Heywood factor is defined as the ratio of a particle perimeter to the perimeter of the circle with the same area. The closer the shape of a particle is to a disk, the closer the Heywood circularity factor to 1. For our images we found that a value in the range [0.94–1.06] will ensure a correct detection of the particles. An illustration of the results of the image processing sequence is given in Fig. 7. The image processing sequence was implemented using IMAQ Vision for Labview software package (http://www.ni.com/vision/).
3. EXPERIMENTS AND RESULTS
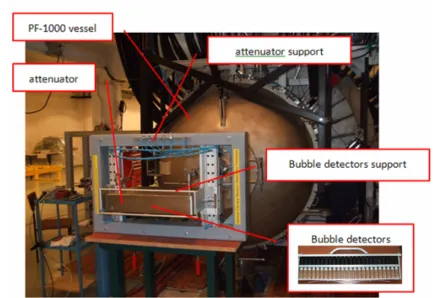
The experiments were performed with the assumption that the neutron source has cylinder shape, 2 cm diameter, 5 cm length, located at the end of the plasma focus central electrode. Preliminary experiments were dedicated to the characterization of neutron field specific to the PF-1000 device. During extensive experiments neutron energy distributions were recorded, using the detectors with different energy thresholds (BDS, bubble detector spectrometer). The experimental configuration #1 is presented in Fig. 8.
Fig. 8 – Experimental configuration #1. Schematic representation of the neutron source (left). Photo of the experimental configuration (right).
The experimental results revealed that even without the attenuator, the energy distribution has a strong component in the low energy range (E < 0.1 MeV)
(Fig. 9). It was assessed that the main reason for this component was scattering from the surrounding structures. The low-energy neutron field would have a strong influence on measurements concerning the attenuation factor.
106 107 108 10-20 MeV 0.01-0.10 MeV 0.10-0.60 MeV 0.60-1.00 MeV 1.0-2.5 MeV 2.5-10 MeV F luenc e per M e V (n/cm 2 ) Energy bin
Fig. 9 – Neutron spectra showing a significant component in the low energy range (E < 0.1 MeV)
1070 T. Craciunescu et al. 10
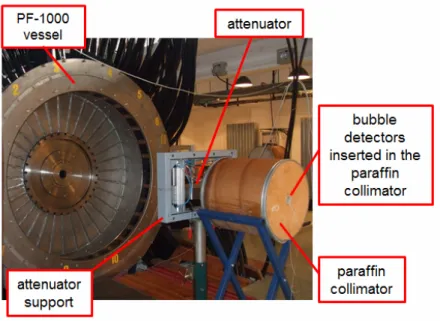
A new measuring location, with the neutron attenuator placed on the machine axis at 180owith respect to configuration #1 was used. The location was
chosen in order to minimize the influence of the neutron scattering by surrounding structures. Additionally the detectors were placed inside a paraffin collimator in order to ensure additional shielding. The new experimental configuration #2 is presented in Fig. 10.
Fig. 10 – Experimental configuration #2.
Table 3
BDS energy thresholds/energy bins BDS spectrometer for energy distribution
recording – energy thresholds/energy bins (MeV) BDS energy bins used for attenuation factor determination (MeV)
• 0.01–0.10 • 0.10–0.60 • 0.60–1.00 • 1.00–2.50 • 2.50–10.00 • 1.00–2.5 • 2.50–10.00
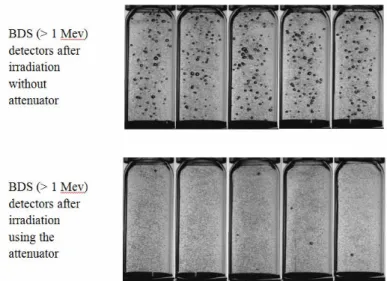
Fig. 11 – Representative detector exposure for attenuation factor determination.
1 2 3 4 5 6 0.0 5.0x10⁶ 1.0x10⁷ 1.5x10⁷ 1.0-2.5 MeV 10-20 MeV 2.5-10 MeV 0.60-1.00 MeV 0.10-0.60 MeV 0.01-0.10 MeV - With collimator - No attenuator Flue nce pe r M e V (n /cm 2 ) Energy bin
Fig. 12 – Neutron spectra obtained using an experimental configuration #2.
In order to test this configuration neutron energy distributions were recorded, using high efficiency detectors with the energy thresholds listed in Table 3. The results are illustrated in Figs. 11–12. The spectrum was recorded in multiple shots
1072 T. Craciunescu et al. 12
which cumulates a total production of 4.80 · 1011 neutrons. The energy distribution
has a small component in the low energy range (E < 0.1 MeV). This suggests that
neutron scattering influence was diminished significantly and the measurement environment is appropriate for determining the attenuator transfer function. The attenuation factor was determined by recording the detector response, with and without attenuator, in the energy range above 1 MeV. A representative result is presented in Fig. 8. The detectors were exposed to multiple shots in order to ensure a good statistic. The number of shots was greater for the measurements with attenuator in comparison with the measurements without attenuator in order to achieve a similar neutron production and similar statistic conditions. The total neutron production was 0.81 × 10¹² for the measurements without attenuator and
1.03 × 10¹² for the measurements with attenuator respectively. The detector responses were scaled in respect with the neutron production characteristic during their exposure and also according to their sensitivity. The detector response function was used for detector response deconvolution. The evaluation of the attenuation factor is summarized in Table 4.
Table 4
Attenuation factor evaluation
Geometry Total neutron production fluence (10Corrected neutron 3 n/cm2) Factor
Without attenuator 0.807 1012 88 ± 1.4
With attenuator 1.032 1012 0.8 ± 0.4 110 ± 30
The evaluated attenuation factor proved to be in agreement with the attenuation factors considered to be attainable within the project constraints – see Table 1 – KN3-VC-NA (Short).
4. CONCLUSION
Radiation tests for the validation of KN3-NA attenuators were performed using the PF-1000 plasma-focus device at Institute of Plasma and Laser Microfusion IPPLM Warsaw. After extensive experiments a measurement arrangement characterized by a negligible scattering background was implemented. Neutron energy distribution measurement confirmed the efficiency of this setup. The attenuation factor was measured and proved to be in agreement with the attenuation factors considered to be attainable within the project constraints. The results presented here may be considered as the first step in commissioning procedure.
Acknowledgments. This work was supported by the European Communities under the contract of Association between EURATOM and MEdC, IPPLM and CCFE and was carried out within the framework of the European Fusion Development Agreement. The views and opinions expressed herein do not necessarily reflect those of the European Commission.
REFERENCES
1.V.G. Kiptily, et al., Plasma Phys. Control. Fusion, 48, R59–R82 (2006).
2.V.G. Kiptily, et al., AIP, 988, 283 (2008).
3.V.G. Kiptily, et al., Nucl. Fusion, 42, 999 (2002). 4.O.N. Jarvis, et al., Nucl. Fusion, 36, 1513 (1996).
5.V.G. Kiptily, et al., Phys. Rev. Lett., 93, 115001 (2004). 6.V. Zoita, et al., Fus. Eng. Des., 84-7, 2052–2057 (2009).
7.H. Schmidt, et al., Physica Scripta., 66, 168 (2002). 8.M. Scholz, et al., AIP Conf. Proc., 808, 207–210 (2006).
9.M. Scholz, 6th Dense Z-Pinch Symposium, Oxford, 2005.
10.F. d’Errico, et al., Rad. Prot. Dosimetry, 107, 125–131 (2003).
11.T.B. Moeslund, Introduction to Video and Image Processing: Building Real Systems and Applications, Springer, 2012.