University of Wisconsin Milwaukee
UWM Digital Commons
Theses and Dissertations
December 2015
Multi-Dimensional Assessment of Transit System
Efficiency and Incentive-based Subsidy Allocation
Xin Li
University of Wisconsin-Milwaukee
Follow this and additional works at:https://dc.uwm.edu/etd Part of theTransportation Commons
This Dissertation is brought to you for free and open access by UWM Digital Commons. It has been accepted for inclusion in Theses and Dissertations by an authorized administrator of UWM Digital Commons. For more information, please [email protected].
Recommended Citation
Li, Xin, "Multi-Dimensional Assessment of Transit System Efficiency and Incentive-based Subsidy Allocation" (2015).Theses and Dissertations. 1064.
MULTI-DIMENSIONAL ASSESSMENT OF TRANSIT SYSTEM
EFFICIENCY AND INCENTIVE-BASED SUBSIDY ALLOCATION
by
Xin Li
A Dissertation Submitted in
Partial Fulfillment of the
Requirements for the Degree of
Doctor of Philosophy
in Engineering
at
The University of Wisconsin-Milwaukee
December 2015
ii
ABSTRACT
MULTI-DIMENSIONAL ASSESSMENT OF TRANSIT SYSTEM
EFFICIENCY AND INCENTIVE-BASED SUBSIDY ALLOCATION
by
Xin Li
The University of Wisconsin-Milwaukee, 2015
Under the Supervision of Professor Yue Liu
Over the past several decades, contending with traffic congestion and air pollution has emerged as one of the imperative issues across the world. Development of a transit-oriented urban transport system has been realized by an increasing number of countries and administrations as one of the most effective strategies for mitigating congestion and pollution problems. Despite the rapid development of public transportation system, doubts regarding the efficiency of the system and financing sustainability have arisen. Significant amount of public resources have been invested into public transport; however complaints about low service quality and unreliable transit system performance have increasingly arisen from all walks of life. Evaluating transit operational efficiency from various levels and designing incentive-based mechanisms to allocate limited subsidies/resources have become one of the most imperative challenges faced by responsible authorities to sustain the public transport system development and improve its performance and levels of service.
iii
After a comprehensive review of existing literature, this dissertation aims to develop a multi-dimensional framework composed of a series of robust multi-criteria evaluation models to assess the operational and financial performance of transit systems at various levels of application (i.e. region/city level, operator level, and route level). It further contributes to bridging the gap between transit efficiency evaluation and the subsequent subsidy allocation by developing a set of incentive-based resource allocation models taking various levels of operational and financial efficiencies into consideration. Case studies using real-world transit data will be performed to validate the performance and applicability of the proposed models.
iv
© Copyright by Xin Li, 2015 All Rights Reserved
v To my parents, and my wife
v
TABLE OF CONTENTS
ABSTRACT ... ii
LIST OF FIGURES ... vii
LIST OF TABLES ... viii
ACKNOWLEDGMENTS ... ix
Chapter 1: Introduction ... 1
1.1. Background ... 1
1.2. Research Objectives ... 4
1.3. Dissertation Organization ... 4
Chapter 2: Literature Review ... 9
2.1. Introduction ... 9
2.2. Transit Efficiency Assessment ... 9
2.3. Subsidy Allocation ... 21
2.4. Summary ... 26
Chapter 3: A Systematic Modeling Framework ... 28
3.1. Introduction ... 28
3.2. Key Research Issues and Primary Research Tasks ... 28
3.3. Modeling Framework... 31
Chapter 4: Multi-Dimensional Transit Efficiency Assessment ... 33
4.1. Introduction ... 33
4.2. City/Region-level Transit System Efficiency Assessment ... 34
4.2.1 Research Motivation ... 34
4.2.2 The Evaluation Framework... 36
4.2.3 The Multi-Criteria Evaluation Model ... 39
4.2.4 Case Study ... 44
4.2.5 Conclusion ... 52
4.3. Operator-level Transit System Efficiency Assessment... 54
4.3.1 Research Motivation ... 54
4.3.2 The Proposed Model ... 56
4.3.3 Case Study ... 65
4.3.4 Conclusion ... 73
4.4. Route-level Transit System Efficiency Assessment ... 75
vi
4.4.2 The Proposed Model ... 76
4.4.3 Case Study ... 80
4.4.4 Conclusion ... 87
Chapter 5: Incentive-based Subsidy Allocation Model ... 89
5.1. Introduction ... 89
5.2. An Incentive-based Subsidy Allocation Framework ... 90
5.3. Bus Operator-level Incentive-based Subsidy Allocation Model ... 92
5.3.1 Research Motivation ... 92
5.3.2 Operator-level Transit System Operational Efficiency Assessment Model ... 95
5.3.3 Operator-level Transit System Financial Efficiency Assessment Model ... 96
5.3.4 Efficiency-based Target Setting ... 104
5.3.5 The Incentive-based Subsidy Allocation Model ... 105
5.3.6 The Incentive-based Subsidy Allocation Adjustment ... 109
5.3.7 Case Study ... 110
5.3.8 Conclusion ... 125
5.4. Bus Route-level Incentive-based Subsidy Allocation model ... 127
5.4.1 Research Motivation ... 127
5.4.2 The Proposed Model ... 128
5.4.3 Case Study ... 134
5.4.4 Conclusion ... 138
Chapter 6: Summary and Conclusions ... 140
6.1. Multi-dimensional Transit System Efficiency Assessment ... 140
6.2. Incentive-based Subsidy Allocation ... 142
6.3 Future Research ... 144
References ... 145
vii
LIST OF FIGURES
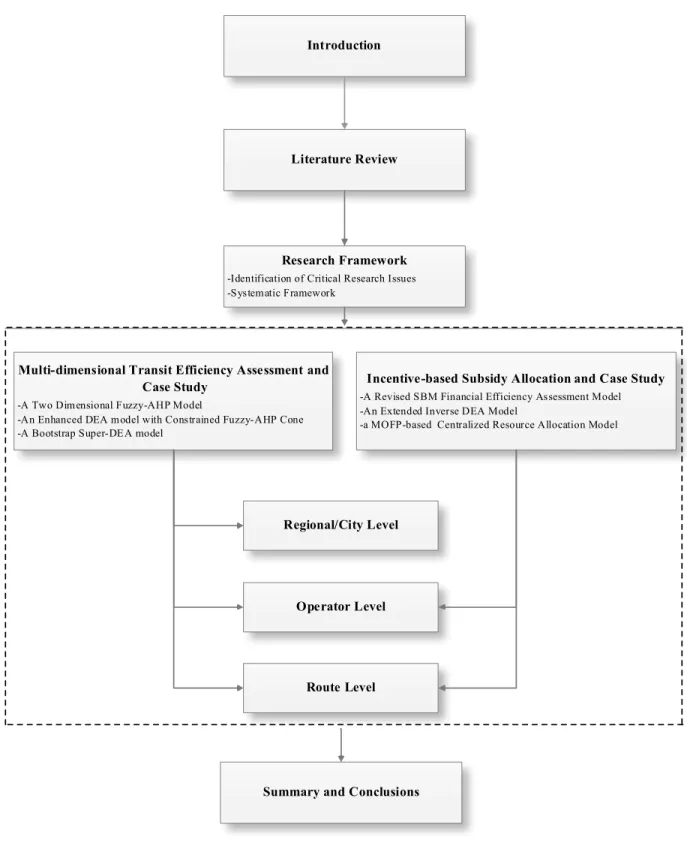
Figure 1.1 Dissertation organization ... 5
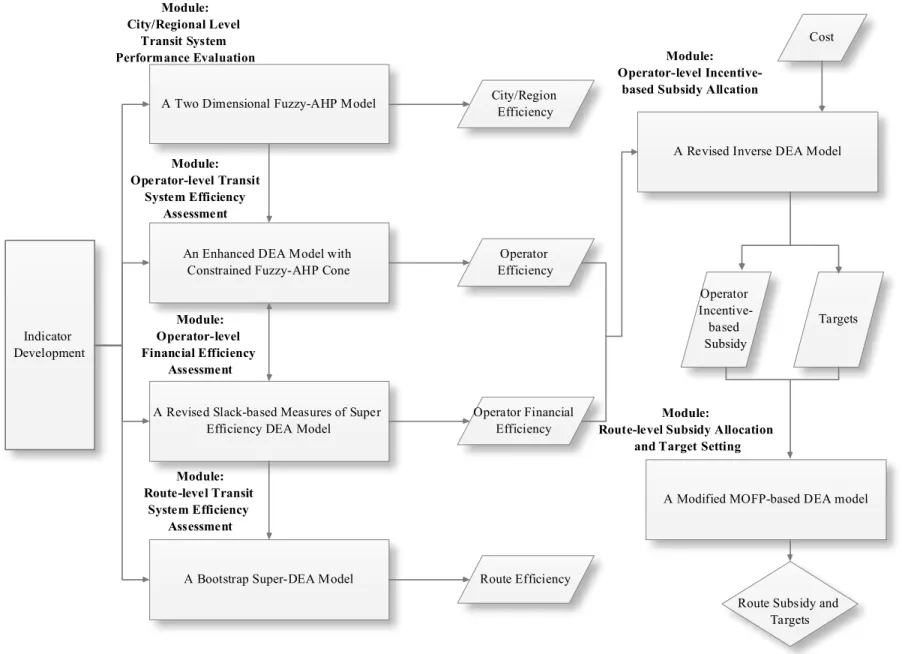
Figure 3.1 A modeling framework of the proposed dissertation ... 32
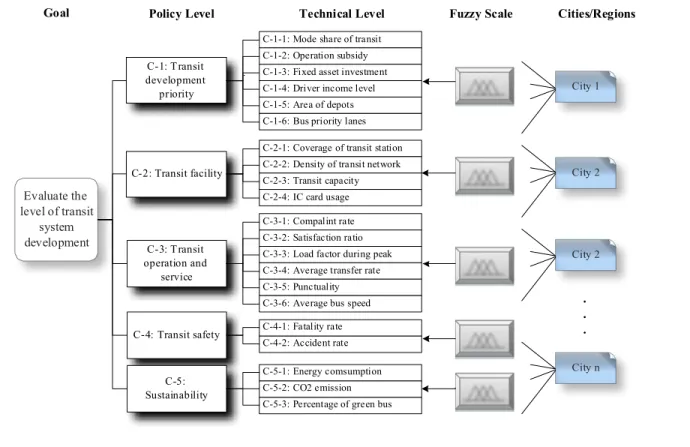
Figure 4.1 The proposed evaluation framework ... 38
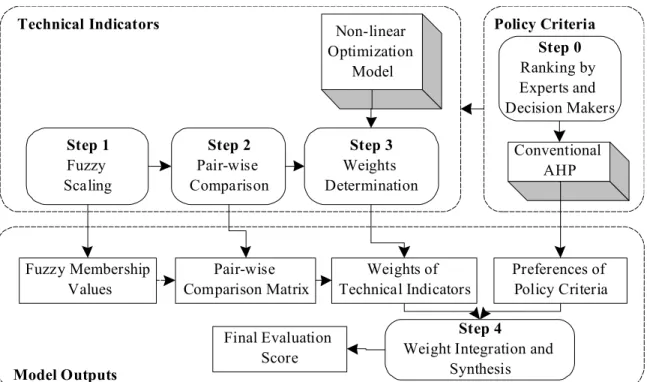
Figure 4.2 The overall evaluation procedure ... 40
Figure 4.3 The proposed Model structure ... 59
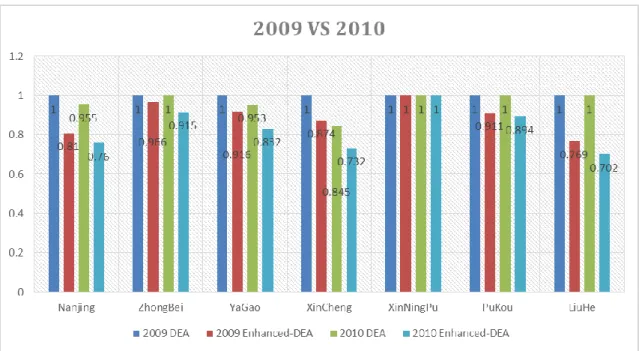
Figure 4.4 Comparison between 2009 and 2010... 73
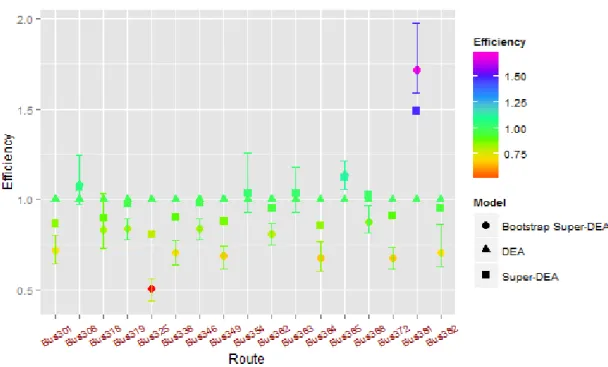
Figure 4.5 Bus route Efficiency assessment by DEA, Super-DEA and Bootstrap Super-DEA .. 84
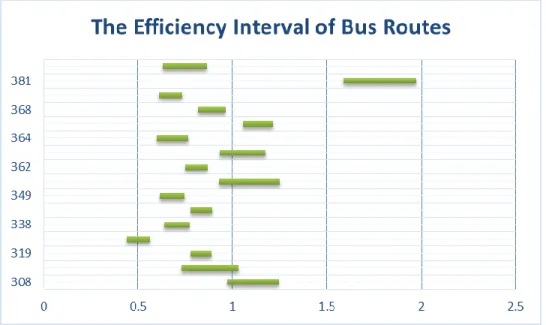
Figure 4.6 Efficiency Interval ... 85
Figure 5.1 A framework of incentive-based subsidy allocation process ... 91
Figure 5.2 Bus operator-level incentive-based subsidy allocation model framework ... 94
Figure 5.3 Operational and financial efficiencies of five companies ... 114
Figure 5.4 Operational and financial efficiencies of five companies ... 115
Figure 5.5 Basic plan ... 116
Figure 5.6 Proactive plan ... 117
Figure 5.7 Efficiency change of basic plan ... 120
Figure 5.8 Efficiency change of proactive plan ... 120
Figure 5.9 Improvement of operational efficiency ... 121
Figure 5.10 Improvement of financial efficiency ... 121
Figure 5.11 Subsidy allocation of basic plan ... 124
Figure 5.12 Subsidy allocation of proactive plan ... 124
Figure 5.13 Subsidy and target setting result of Basic Plan... 136
viii
LIST OF TABLES
Table 4.1 Notation of key parameters used in the proposed model ... 40
Table 4.2 The model input ... 46
Table 4.3 Results of fuzzy scaling and normalization ... 48
Table 4.4 Ranking scores with respect to different technical criteria ... 50
Table 4.5 Ranking scores with respect to different policy criteria ... 51
Table 4.6 Notation of key parameters used in the proposed model ... 57
Table 4.7 Data used for evaluation (Year 2009) ... 65
Table 4.8 Data used for evaluation (Year 2010) ... 66
Table 4.9 Fuzzy scaling for 2009 data ... 67
Table 4.10 Fuzzy scaling for 2010 data ... 67
Table 4.11 Weights of indicators in 2009 and 2010 ... 69
Table 4.12 Efficiency Result of Proposed Model ... 70
Table 4.13 Comparison between the proposed model and the conventional DEA ... 71
Table 4.14 Data collected for case study ... 81
Table 4.15 Bus routes’ efficiencies by Conventional DEA and Super-DEA ... 82
Table 4.16 Comparison in Conventional DEA, Super-DEA and Bootstrap DEA ... 84
Table 5.1 2014 Original data ... 112
Table 5.2 2014 Chongqing Bus Company financial efficiency ... 112
Table 5.3 2014 Chongqing Bus Company operational efficiency ... 112
Table 5.4 Basic plan ... 118
Table 5.5 Proactive plan ... 118
Table 5.6 “Basic Plan” efficiency ... 119
Table 5.7 “Proactive Plan” efficiency ... 119
Table 5.8 Subsidy allocation plan of basic scenario ... 123
Table 5.9 Subsidy allocation plan of proactive scenario ... 123
Table 5.10 Data of 17 bus routes of 2014 ... 135
Table 5.11 Subsidy and target setting result of Basic Plan ... 135
ix
ACKNOWLEDGMENTS
I would like to express my gratefulness to my supervisor, Prof. Yue Liu for all his support and encouragement throughout my whole Ph.D time. I deeply appreciate the opportunity he gave me to work with him. He has been always helpful, supportive, and offering constructive advices, through all the phases of my studies. He has been an example not only on the way of working and conducting research but also in thinking in general.
Special thanks also go to my committee members, Prof. Jie Yu, Prof. Xiao Qin, Prof. Lingfeng Wang and Prof. Lingqian Hu for their valuable contributions to my dissertation.
I also want to thank all the people that have been in the same research group for these years and made the office a pleasant environment. Thanks everyone, Peng Li, Yaojun Wang and Yun Yuan.
Last but not the least, I would like to dedicate this dissertation to my loving family, Dad, Mom and my wife, Judy Chen. With your consistent help and loving, I am brave enough to face the difficulties.
1
Chapter 1: Introduction
1.1. Background
Over the past several decades, contending with traffic congestion and air pollution has emerged as one of the imperative issues across the world. Development of a transit-oriented urban transport system has been realized by an increasing number of countries as one of the most effective strategies for mitigating congestion and pollution problems.
According to the 2011 statistics of public transport in United States, the total number of transit trips reached 10,319 million while the total number of passenger mileages was 56,077 million kilometers. The total operational expense on the transit system was up to 38,362.1 million dollars. In the meanwhile, the capital investment on public transport has already reached 17,057.1 million dollars. The transit industry has produced more than 380,000 jobs with 13,557.6 million dollars fare collection (2013 Public Transport Fact Book, 2013). In developing economies, for example in China, the total amount of passengers by transit has reached 77.9 billion till the end of 2009, within which 74.3 billion are by bus transit, and 3.6 billion are by rail transit. The total length of public transit lines has reached 289,000 kilometers, while the total length of bus lanes has reached 7,452 kilometers; urban rail transit systems have been operated in 12 cities in mainland, with the total number of 64 routes and 1291 stations, and the total length of 1556.2 kilometers. Bus Rapid Transit (BRT) system has been developed to over 10 cities.
Despite the rapid development of public transportation system, doubts regarding the efficiency of the system and financing sustainability have arisen. In US, according to the 2010 version of MTC report, the transit in Bay Area of the Unite States has been allocated approximately $1.5 billion subsidies to compensate its operation loss and maintain its service level. Since 1983, transit has received a share of the federal user fees paid by drivers, principally
2
through fuel taxes. Additional diversions from federal user fees have been authorized by the Congestion Mitigation and Air Quality Improvement (CMAQ) program. In 2010, the latest year for which data are available, the total diversion from federal user fees approached $6 billion
(Federal Transit Administration, National Transit 2010 Database, 2012). In China, from 2007 to
2013, the annual revenue of Beijing’s rail transit rose from 1.2 billion yuan ($200 million) to 3.2 billion yuan ($530 million), while the operation expenditure increased from 1.3 billion ($220 million) yuan to 6.7 billion yuan ($1100 million). In 2012, the Beijing government subsidized its buses with 15 billion yuan ($2500 million) (China Daily, 7/8/2014). In the past six years, the Beijing government has totally allocated more than 95 billion yuan ($16 billion) subsidies to its public transport. Shanghai public transport has received more than 3.5 billion yuan ($600 million) from government in 2013 which was used to compensate operational loss and maintain facilities. Significant amount of public resources have been invested into public transport; however complaints about low service quality and unreliable transit system performance have increasingly arisen from all walks of life. Therefore, evaluating transit operational efficiency from various levels and accordingly allocating limited subsidy/resources have become the most imperative challenges faced by many responsible authorities to sustain the public transport system development and to improve its performance and levels of service.
To contend with this vital issue, studies focused on various levels of transit performance evaluation or efficiency assessment have been proposed in the literature over the past several decades (Nathanail, 2008; Tyrinopoulos and Antoniou, 2008; Eboli and Mazzulla, 2007, 2009, 2011; Hassan et al., 2013; Badami and Haider, 2007; Lao and Liu, 2009; Boile, 2001; Zhu, 2003; Karlaftis, 2004; Nakanishi and Falcocchi, 2004; Tsamboulas, 2006; Barnum et al., 2008; Sheth et al., 2007; Lao and Liu, 2009; Sanchez, 2009; Yu and Fan, 2009; Zhao et al., 2011; Hawas et al.,
3
2012; Karlaftis and Tsamboulas, 2012; Sheth et al., 2007; Abreha, 2007). Certainly, those
research efforts have made invaluable contributions to evaluation of transit performance from different perspectives. However, much remains to be advanced on the development of a multi-dimensional transit system efficiency assessment framework. In addition, existing mathematical models and methodologies may not be sufficient for transit system evaluation and deserve further extension and enhancement.
In transit resource/subsidy allocation, the most existing studies (Jolliffe and Hutchinson, 1975; Bowman and Turnquist, 1981; Zahavi 1979, 1982; Douglas, 1998; Cervero, 1998; Bhatta
and Drennan, 2003) have attempted to use traditional capital-based or cost-proportional (e.g.
total mileage, fuel consumption, or total passenger-trips) methods to allocate subsidies to transit operators to cover their operational loss and encourage them to provide better services in the next operational cycle. Those capital/cost-based methods, though effective to keep financial stability of transit operators, may not actually function to provide sufficient incentives for them to improve their performance. Many studies have indicated that there exists a negative correlation between the amount of capital-based subsidy and a transit operator’s performance (Obeng and
Sakano, 2008). This is due to the fact that the operational performance or efficiency of transit
operators has not been properly integrated into the subsidy allocation process. In other words, the higher the loss/cost a transit operator the higher the subsidy it would be compensated. In review of relevant literature, very few studies have linked efficiency evaluation with the subsidy allocation, resulting in lack of effective framework and methodology for incentive-based subsidy allocation.
In view of all such importance of the public transportation system and the complexities that often exist in its evaluation and resource allocation process, development of a
4
comprehensive framework for transit system assessment for various levels of application and accordingly design incentive-based subsidy allocation mechanisms remain challenging.
1.2. Research Objectives
The primary objective of this dissertation is to develop an integrated framework with quantitative approaches for comprehensive multi-dimensional transit system efficiency assessment and incentive-based subsidy allocation. More specifically, this research contributes to:
Developing robust multi-criteria evaluation models for transit system efficiency assessment at various levels of application;
Designing a framework and operational mechanisms to integrate transit efficiency evaluation with transit subsidy allocation;
Developing theoretically justified and practically applicable models for incentive-based transit subsidy allocation; and
Applying developed models and operational procedures to real-world cases, and provide guidelines to public transportation authorities.
1.3. Dissertation Organization
Based on the proposed research objectives, this study proposes to organize the primary research tasks into six chapters. The core of those tasks and their interrelations are illustrated in Figure 1.1.
5
6
The remaining chapters of this dissertation are proposed to be organized as follows:
Chapter 2 presents a comprehensive literature review of existing studies on various
dimensions of transit system efficiency assessment and performance evaluation, as well as transit subsidy allocation, including both research methodologies and applications. The review focuses on identifying the advantages and limitations of those studies, along with their potential enhancements.
Chapter 3 illustrates the proposed research framework, based on critical issues that
need to be taken into consideration in the development of the multi-dimensional transit efficiency assessment and incentive-based subsidy allocation models. It specifies the key modules and their functional features in this framework.
Chapter 4 proposes to develop formulations of models for transit performance and
efficiency evaluation at three different levels of application, namely the city/regional level, the operator level and the route level. At the city/regional level, this study develops a framework with both policy and technical layers, which offers the advantage of preventing the vagueness and uncertainty when evaluating technical criteria while properly retaining the policy preferences from decision makers. The policy layer is designed to better capture a city’s characteristics and developing priorities as well as the subjective opinions of various transit stakeholders, based on which technical criteria are further compared and assessed in the “technical layer” with an innovative fuzzy Analytical Hierarchy Process (AHP) model, where a non-linear optimization formulation is proposed to maximize the consistency in pair-wise comparison and weight estimation. At the operator level, an enhanced DEA (data envelopment analysis) model with constrained cones is proposed to offer advantages
7
in considering weights assigned to different performance indicators when the efficiency of transit operators are assessed. Such modeling improvement can remedy the deficiency of traditional DEA models in evaluating the relative efficiency of decision-making units but not allowing for ranking of the efficient units themselves.
At the route level, this study proposes to develop a Bootstrap Super-DEA model
based on empirical data and repeated sampling to prevent the errors due to imperfect data and judgment mistakes. The proposed model is also expected to yield the confidence intervals to suggest the efficiency boundaries for each bus route operation. Case studies will be performed for all three levels of models.
Chapter 5 will develop the incentive-based subsidy allocation mechanisms for bus
operators and bus routes. At bus operator-level, a revised slacks-based measures of super efficiency model for financial efficiency assessment is proposed to examine the financial performance of transit operators, which will be then integrated with the operational efficiency obtained from Chapter 4 using an inverse DEA model for subsidy allocation. To test the sensitivity and reliability of the proposed model, the chapter presents the results of extensive analyses with a real-world case in Chongqing Metropolis, China. At bus route-level, a Multi-objective Fractional Programming-based model is constructed to assign Bus Company’s incentive-Programming-based subsidy as well as distributing Company’s targets into to its managed bus routes simultaneously. As a natural extension of bus operator-level subsidy allocation study, 17 bus routes in Chongqing Third Bus Company are selected as a case study to share the incentive-based subsidy and set targets of ridership and mileage increases.
8
Chapter 6 summarizes the contributions of this dissertation and the directions for
9
Chapter 2: Literature Review
2.1. IntroductionIn view of the large body of literature on various aspects of public transportation research, this chapter will present a comprehensive review of only those research efforts in transit efficiency assessment, performance evaluation, and resource/subsidy allocation. The purpose is to identify the special characteristics, strengths, and deficiencies of existing studies and thus to define the primary directions for this study.
2.2. Transit Efficiency Assessment
Efficiency, a concept originated in industrial engineering, describes the relation of inputs to outputs, and is concerned with minimizing inputs for a specific output or maximizing output for a specific input. The Development Assistance Committee of Organization for Economic Co-operation and Development (OECD) defines efficiency in terms of transformation of inputs into results. Similarly, welfare economists sometimes define efficiency based on the transformation of costs into benefits as measured, for example, by benefit-cost ratios. In both cases, efficiency assessment is defined by how economically inputs or costs are transformed into results or benefits.
Efficiency assessment is very commonly used in many areas to evaluate a unit or system’s performance and to further target their weakness. For example, Song et al. (2013)
analyzed and compared the energy efficiency among BRICS (Brazil, Russia, India, China and South Africa) to realize that energy efficiency of BRICS as a whole is low but has a quickly increasing trend. Shrivastava et al. (2010) reviewed the relative technical efficiency of 60 coal fired power plants in India by using CCR and BCC models of data envelopment analysis. In
10
addition to efficiency evaluation, target benchmark of input variables has also been evaluated.
Halkos and Tzeremes (2013) evaluated the Top 25 European Football Club’s efficiency levels in
order to analyze how European football clubs’ current value and debt levels influence their performance. Lin et al. (2010) implemented the economic performance assessment to local government in China to evaluate and rank all alternatives. Phillip and Lee (2013) examined energy efficiency in the Japanese transportation sector and then unfold comparisons with the United States and other developed economies. Coate (1999) described an efficiency approach to the evaluation of policy changes by comparing it with other possible changes which might be made from the status quo. Huang et al. (2011) introduced a dynamic two-stage approach to analyzing the hotel industry's technical efficiency at the sub-national level. Victor and Raquel
(2011) used a subjective performance evaluation method to help organization ensure equal
opportunities for men and women. Chen and Yan (2011) constructed an alternative network DEA model that embodies the internal structure for supply chain performance evaluation.
Transit efficiency assessment, as an application of general efficiency evaluation methodologies, aims to evaluate how well a transit system utilizes available labor and capital resources (Gilbert and Dajani, 1975; Fielding et al., 1978; Fielding et al., 1985; Chu et al., 1992;
Nolan, 1996; Karlaftis, 2003) to provide quality services. Efficiency assessment has become an
essential task for transit service providers to capture passenger demand trends, operational constraints, concerns of stakeholders, and changing service needs. It also allows the responsible authorities to achieve better economic performance assessment, organization administration, and transit planning and financing.
In review of literature, previous research on transit efficiency assessment focuses primarily on the transit service side, falling into three different categories, namely the user
11
perception/satisfaction based approach, the efficiency indicator based approach, and the integrated approach with user opinions and efficiency indicators both considered (Hassan et al., 2013).
User perception/satisfaction based approach examines transit performance by the transit users’ perception or satisfaction (Nathanail, 2008; Tyrinopoulos and Antoniou, 2008; Eboli and
Mazzulla, 2007; 2009; 2011), where the different aspects of the transit service are rated by the
users by a satisfaction survey. The most commonly used indicators include reliability, frequency, capacity, fare, cleanliness, comfort, security, staff, information, and the ticketing system. Efficiency indicator based approach features the use of various variables of relevance to the transit system demand and operation such as loading/ridership, travel time, travel distance, frequency, service duration, revenue, manpower, cost, accident data, fuel consumption and emission to calculate the ‘‘efficiency’’ indicators (Badami and Haider, 2007; Lao and Liu, 2009). Efficiency indicators are primarily needed to quantify the productivity of the system components (vehicles, route and operation), cost, environment, and safety. In addition, other studies introduced the concepts of transit availability or transit service accessibility as the indicators to measure efficiency, where the spatial elements and social economic factors, such as service coverage, service span and service population, are normally taken into accounts (Polzin et al.,
2002; Rood, 1997; Hillman, 1997). Very recent research has started to integrate users’ opinions
and efficiency indicators into a unified framework (Sheth et al., 2007; Abreha, 2007). Those service-oriented performance evaluation methods, though perfect capturing transit user opinions, lack consideration of other aspects of transit system, e.g. infrastructure and safety, which has limited their applicability in comprehensive evaluation of transit system development.
12
To direct and monitor transit system performance and promote public transport development, many countries and municipalities have developed guidelines and standards for transit efficiency or performance assessment. For examples, in 1984 the U.S. Department of Transportation (USDOT) published a synthesis on bus service evaluation methods to review and provide supplemental materials for use by the transit industry. In 1995, a synthesis of transit practice on ten projects funded by the Transit Cooperative Research Program (TCRP) was published, where a survey of transit agencies in North America indicates that as many as 44 different evaluation criteria were used in the transit industry. The selected criteria covered activities related to bus route design and operation, ranging from location of bus stops to the hours of service in the area of route level service delivery (Kittelson & Associates, Inc. et al.,
2003). In 2003, The Transit Capacity and Quality of Service Manual (TRB, 2003) has developed
guidelines for evaluating the performance of public transport system. The manual has categorized the evaluation index system into three groups which are station, route, and system. Moreover, all the three groups are required to be ranked in terms of accessibility and convenience that are decided by the indicators of frequency, occupancy, services hours, punctuality and the time gap between private car and public transport.
In European countries, the International Association of Public Transport (UTIP) has set up a group of indictors including the population of transit users, the services coverage, the number of bus routes, stations, vehicles, the vehicle mileage, the patronage, the average trip distance and the fare to compare the performance of public transport system among the different cities and regions (UTIP, 2011). In addition, the European Committee for Standardization (CEN) EN 13816 standard was produced with the aim of promoting a quality approach to public transport operations, and to focus interest on the needs and expectations of customers. Areas of
13
measurement based on the categories in the European Standard EN 13816 were integrated into the Key Performance Indicator (KPI) system.
In developing countries such as China, despite the rapid development of public transportation system in China in recent years, it is still at its beginning stage considering the percentage of urban public transit investment in the nation’s GDP (1% in 2006 for China vs. 3%-5% for developed countries).To contend with the accelerated urbanization process, the Chinese government has planned to aggressively invest in the public transportation system in the future. One of the most important programs is to support 30 Chinese cities to develop the “Transit Metropolis” before 2015 according to the “12th five-year Transport Development Plan” released by the Ministry of Transport of China. This program is expected to elevate the urban public transportation system performance and completeness and significantly improve the transit ridership in urban transportation system. The Ministry of Transport of China has developed a series of technical criteria (e.g. public transit share, coverage of transit stations, transfer times, subsidy, energy efficiency, safety) to select the candidates to be transit metropolis. On the other hand, different cities may vary in their priorities of public transportation system development policies. The combinational impact of various technical criteria and policy priorities is expected to determine the level of public transportation system development in a region. Although various kinds of standards from both national prospective and industry prospective could be found to guide transit development, most of them focus on developing evaluation criteria system, there lacks a theoretically justified and practically applicable framework as well as the robust models for convenient evaluation and comparison of transit system developing levels.
14
From the perspective of application, substantial efforts have been made to develop various methods and models to evaluate and compare system-level, operator-level and route-level’s transit performance or efficiency.
At the system level, index measures are normally employed to produce a single value to reflect the combined and weighted result covering various kinds of transit activities. For examples, Horowitz and Thompson (1995) have constructed a list of 70 generic objectives for evaluation of an intermodal transfer facility after extensive literature review and interviews with various stakeholders. Nolan (1996) has conducted a study of 25 mid-sized bus agencies using USDOT section 15 data from 1989 to 1993, and tried to identify the relationships between the efficiency scores and agency characteristics using To-bit regression. Fu and Xin (2002) have proposed a new performance index called Transit Service Indicator (TSI), which could be used as a comprehensive measure to evaluate the quality of transit system. Their framework took into account spatial and temporal variations in travel demand and recognized that quality of service is a result of interaction between supply and demand. Tsamboulas (2006) has assessed the performance of 15 European transit systems, in terms of efficiency and effectiveness. Furthermore, efforts have been made towards identifying the sources of inefficiency, and determining whether the new modes of transport industry including competition and/or private ownership have actually led to “improved” transport service provision. Xu and Lian (2011) have proposed an evaluation system, including convenience, adaptability, and efficiency which was further divided into eleven indictors to assess the performance of the transit system.
The majority of studies on the system-level transit evaluation were designed for developed regions with relatively mature transit systems. There lacks of sufficient attention on developing areas with many other critical factors (e.g. infrastructure and fuel consumption) taken
15
into consideration. In addition, many multi-criteria evaluation methods using in those studies lack sufficient flexibility in altering their evaluation framework to account for the interaction between the importance of technical criteria and the preferences of decision makers.
For efficiency evaluation at the operator level, Gathon (1989) presented a study of efficiency evaluation of urban transit firms. In his study, ordinary least squares and free disposal hull approaches were utilized to compare the performance of 60 firms across European countries, where the number of seat-kilometers traveled was used as the output measure and the labor hours of work was the input measure. Chu et al. (1992) have developed a single index for measuring service efficiency as well as service effectiveness of public transit agencies. The authors argued that measures of efficiency, which were based on service production, should be treated separately from measures of effectiveness, which were based on service consumption. Kerstens
(1996) has evaluated and compared the performance of French urban transit companies using a
broad selection of nonparametric reference technologies for two specifications of the production process. Yeh et al. (1999) have presented an effective fuzzy multi-criteria analysis (MA) approach to performance evaluation for urban public transport companies in Taiwan involving multiple criteria of multilevel hierarchies and subjective assessments of decision alternatives.
Parkan (2002) has carried out a study to obtain comprehensive performance ratings to gauge the
productive and service quality performance of a public transit company using a recent performance measurement method called operational competitiveness rating (OCRA) analysis. In his study, the computing ratings incorporate the cost and revenue efficiency of operations, quality of service experience as perceived by commuters, and quality of service delivery in specific areas measured internally. De Borger et al. (2002) have conducted an extensive review and analysis of the literature on the production and cost frontiers for public transit operators.
16
Their paper summarized many critical issues, including technical versus scale versus allocative efficiencies, the selection of input and output measures, returns to scale and scope, and the impact of ownership and government subsidies. Othman and Mahmod (2010) proposed a multi criteria decision making in ranking the bus companies using fuzzy rule, and a corresponding numerical case study was given to prove the model. Hahn et al. (2012) have developed a network Data Envelopment Analysis (DEA) model for evaluating the efficiency of bus companies of Seoul, Korea which successfully took environment issues into account. The model can reflect the non-storable nature of public transportation services by sequentially considering transportation services provided by operators and consumed by users.
At the route level, Boile (2001) has developed a procedure to identify both technical and scale efficiencies for a selected group of bus transit lines. Karlaftis (2004) used data envelopment analysis and globally efficient frontier production functions to investigate two important issues in transit line operation efficiency: 1) the relationship between efficiency and effectiveness and 2) the relationship between performance and scale economies. Sheth et al. (2007) unfolded a study of performance evaluation of bus routes from the perspectives of both operators and passengers, and the provision of bus services along different routes that comprise a public transit network is assessed. Lao and Liu (2009) proposed a model integrating GIS to compute each bus line’s operational efficiency and spatial effectiveness scores. This approach allows for close inspection and comparison of operational and spatial aspects of bus lines. Similarly, Hawas et al. (2012)
have developed a GIS-based model to evaluate the baseline performance level of Al Ain Public Bus Service in United Arab Emirates (UAE) according to some selected input (travel time per round trip, total number of stops, total number of operators, total number of buses) and output (daily ridership and vehicle-kilometer) variables.
17
In terms of evaluation methodologies, multi-criteria ranking methods are generally used for performance analysis and evaluation. Many studies have been proposed focusing on the combination of fuzzy logic model with multi objective decision that can assist in reducing judgment errors (Yamashita, 1997; Turban et al., 2000; Yeh et al. 2000; Hanaoka and
Kunadhamraks 2009; Campos et al. 2009; Yu et al. 2011; Zak et al. 2011; Hassan et al., 2013).
Hassan et al., (2013) has selected and further modified Technique of Order Preference by
Similarity to Ideal Solution (TOPSIS) as their multi criteria evaluation method to assess transit service performance, where an enhanced weighting process was presented to determine the weight for criteria and indicator in a generalized transit system, as following:
𝑊𝑗𝑘𝐼 = ∑ (𝑊𝑗𝑘𝑙 𝐼 ) 𝐿 𝑙=1 𝐿 ∀𝑗, 𝑘, 𝑙 𝑗 = 1, … , 𝐽, 𝑘 = 1, … , 𝐾 𝑊𝑗𝐶 = ∑ (𝑊𝑗𝑙 𝐶) 𝐿 𝑙=1 𝐿 ∀𝑗 𝑗 = 1, … , 𝐽 ∑𝐾𝑘=1(𝑊𝑗𝑘𝑙𝐼 ) 𝐿 = 1 ∀𝑗, 𝑙, 𝑗 = 1, … , 𝐽, 𝑙 = 1, … , 𝐿 ∑𝐽𝑗=1(𝑊𝑗𝑙𝐶) 𝐿 = 1 ∀𝑙, 𝑙 = 1, … , 𝐿 𝑊𝑗𝑘𝐶𝑙 = 𝑊𝑗𝐶× 𝑊𝑗𝑘𝑙
Where 𝑟 denote the route index of the 𝑁 routes in the system, 𝑟 = 1, . . . , 𝑁 These N
routes are to be evaluated based on a set of J criteria, which are independent to each other. Let j
define the index of criterion, 𝑗 = 1, . . . , 𝐽. Each criterion, 𝐶𝑗, is divided into K indicators. Let k
define the index of indicator, 𝑘 = 1, . . . , 𝐾. Each indicator k of criterion𝑗, 𝐼𝑗𝑘, represents some specific quantitative measure of performance. A group of L experts are asked to provide separate weights for each criterion, 𝐶𝑗, and indicator,𝐼𝑘, where l is the index of the expert, 𝑙 = 1, . . . , 𝐿.
18
Yeh et al. (2000) has developed a fuzzy AHP (Analytic Hierarchy Process) framework to
evaluate the performance of Taiwan bus companies by integrating both the fuzzy–analytical hierarchy process and the fuzzy–multi criteria decision-making. The proposed model features in defining a triangular fuzzy membership functions, as follows:
𝜇∀(𝑥) = { 0, 𝑥𝑖 ≤ 𝑎1 𝑥𝑖 − 𝑎1 𝑇 − 𝑎1 𝑎1 ≤ 𝑥𝑖 ≤ 𝑇 ⁄ 𝑎3 − 𝑥𝑖 𝑎3− 𝑇 𝑇 ≤ 𝑥𝑖 ≤ 𝑎3 ⁄ } 𝑓𝑖𝑗 = { 𝜇𝑓𝑖𝑗(𝑥) 𝑥 , 𝑥 ∈ 𝑋}
where 𝑥𝑖 is fuzzy evaluation of alternative in term of triangular fuzzy number, T is the vertex of the triangular fuzzy number and a1 and a3 are the two endpoints, 𝑓𝑖𝑗 is the fuzzy set membership of subjective evaluation mark (i = 1, 2, …n, alternatives and j = 1, 2, …m, the criteria environment), 𝜇𝑓𝑖𝑗(𝑥) is the fuzzy set score of average fuzzy performance rating of alternatives according to criteria.
When assessing the efficiency of operators or bus routes, most existing studies assume transit units as production lines, and evaluate the efficiency of such lines by comparing multiple inputs and outputs (Fare and Grosskopf, 1996, 2000; Seiford and Zhu, 1999; Boile, 2001; Nolan et al. 2002; Sexton and Lewis, 2003; Zhu, 2003; Karlaftis, 2004; Nakanishi and Falcocchi, 2004; Hwang and Kao, 2006; Tsamboulas, 2006; Barnum et al., 2008; Kao and Hwang, 2008; Sheth et al., 2007; Lao and Liu, 2009; Sanchez, 2009; Yu and Fan, 2009; Zhao et al., 2011; Hawas et al.,
2012; Karlaftis and Tsamboulas, 2012). In this regard, Data Envelopment Analysis (DEA), a
non-parametric method introduced by Farrell (1957) and popularized by Charnes et al. (1978), is usually the first-choice by the majority of researchers. DEA is a managerial approach to assess relative performance/efficiency for evaluating decision making units (DMUs). Each DMU
19
selects its best set of weights corresponding to consider inputs and outputs; the values of weights may thus vary from one DMU to another. The DEA models then calculate each DMU’s performance score ranging between zero and one that represents its relative degree of efficiency
(Wei and Chang, 2011).
Initially, many researchers (Fare and Grosskopf, 1996, 2000; Seiford and Zhu, 1999;
Boile, 2001; Nolan et al. 2002) adopted conventional DEA model to assess the performance or
efficiency of transit units. The selected classical BCC model is illustrated as below:
𝑀𝑎𝑥𝑢,𝑣 𝜃𝑘 = ∑𝑀𝑚=1𝑢𝑚𝑦𝑚𝑘 ∑𝑁 𝑣𝑛𝑥𝑛𝑘 𝑛=1 𝑠. 𝑡. ∑ 𝑢𝑚𝑦𝑚𝑗 𝑀 𝑚=1 ∑𝑁 𝑣𝑛𝑥𝑛𝑗 𝑛=1 ≤ 1 ∀𝑗 ∑ 𝑣𝑛𝑥𝑛𝑘 𝑁 𝑛=1 = 1 𝑣𝑛, 𝑢𝑚, 𝑦𝑚𝑗, 𝑥𝑛𝑗 > 0 ∀𝑗, 𝑚, 𝑛
Where j is an index of decision making unit (DMU), j=1… J, n is an index of input,
n=1… N, m is an index of output, m=1… M, 𝑋𝑛𝑗 is the nth input for the jth DMU, 𝑌𝑚𝑗 is the mth
input for the jth DMU, 𝑢𝑚, 𝑣𝑛 are two non-negative scalars (weights) for the mth output and the nth
input, and 𝜃𝑘 is the efficiency/effectiveness ratio of DMUk.
Review of the literature indicates that application of the DEA in transit efficiency evaluation has several limitations. For example, DEA is unable to further distinguish efficient units and the reliability of evaluation results could be potentially degraded by unrepresentative data sample. In addition, DEA ignores the inevitable variation of efficiency of decision-making units. Most importantly, DEA calculations are traditionally value-free and the underlying assumption is that no output or input is more important than the other, although in the real world
20
there often exists different importance over different input or output indicators (Halme et al., 1999). Neglect of this may result in biased evaluation results.
Due to those reviewed decencies, some other scholars have made a series of valuable attempts to modify and enhance the classical DEA model. Lao and Liu (2009) have integrated DEA model with geographic information systems, and then the model was employed to evaluate the performance of Monterey-Salinas Transit system. Higashimoto et al.,(2013) proposed a network DEA model to assess the bus routes efficiency in Tomakomai city. The formulation of the network DEA can be written as following:
𝜃0∗ = 𝑚𝑖𝑛𝜆𝑘𝑠𝑘−∑ 𝑊𝑘[1 − 1 𝑚𝑘(∑ 𝑠𝑖𝑘− 𝑥𝑖0𝑘 𝑚𝑘 𝑖=1 )] 𝐾 𝑘=1 s.t. 𝑥0𝑘 = 𝑋𝑘𝜆𝑘+ 𝑠𝑘− (𝑘 = 1, … , 𝐾) 𝑦0𝑘 = 𝑌𝑘𝜆𝑘+ 𝑠𝑘+ (𝑘 = 1, … , 𝐾) 𝑒𝜆𝑘= 1 (𝑘 = 1, … , 𝐾) 𝜆𝑘 ≥ 0, 𝑠𝑘− ≥ 0, 𝑠𝑘+ ≥ 0, (∀𝑘) 𝑍(𝑘,ℎ)𝜆ℎ = 𝑍(𝑘,ℎ)𝜆𝑘, (∀(𝑘, ℎ)) 𝑍0(𝑘,ℎ) = 𝑍(𝑘,ℎ)𝜆𝑘, (∀(𝑘, ℎ)) 𝑍0(𝑘,ℎ) = 𝑍(𝑘,ℎ)𝜆ℎ, (∀(𝑘, ℎ)) ∑ 𝑊𝑘 𝐾 𝑘=1 = 1, 𝑊𝑘 ≥ 0(∀𝑘)
Jorda et al., (2012) used the super-DEA model developed by Andersen and Petersen
(1993) analyze the technical efficiency of bus services in Span. The model is descripted as
21 𝑀𝑖𝑛 𝜃 − 𝜀(∑ 𝑠𝑗− 𝑛 𝑗 + ∑ 𝑠𝑗+ 𝑛 𝑗 ) s.t.∑𝑛𝑗=1,𝑗≠𝑗0𝜆𝑗𝑥𝑗 + 𝑠𝑗− = 𝜃𝑥𝑗0 ∑ 𝜆𝑗 𝑛 𝑗=1,𝑗≠𝑗0 𝑦𝑗− 𝑠𝑗+ = 𝑦𝑗0 𝜆𝑗, 𝑠𝑗−, 𝑠𝑗+ ≥ 0
where 𝑥𝑗 is an m-dimensional input vector and 𝑦𝑗 is an s-dimensional output vector for the j0th unit; 𝑠𝑗− is an m-dimensional slack variable vector for input variables while 𝑠𝑗+ is an s-dimensional slack variable vector for output variables; 𝜃 is a scalar defining the share of the j0th DMU input vector which is required in order to produce the j0th DMU output vector within the reference technology; 𝜆 is an intensity vector in which 𝜆𝑗 denotes the intensity of the j0th unit; 𝜀
is a non-Archimedean infinitesimal.
2.3. Subsidy Allocation
Subsidy is a direct or indirect payment, economic concession, or privilege granted by a government to private firms, households, or other governmental units in order to promote a public objective. Subsidy allocation falls into the category of general resource allocation. Unlike the concept of efficiency assessment, resource allocation derives from business investment which aims to find out the best option to fully utilize limited resources in an investment decision. Consequently, the resource allocation is a method of indicating the sort of projects which are most likely to fit the available resources and a simple procedure which will assist in assessing the relative merits of these projects (Pearson, 1967).
22
Resource allocation has been attracting ever-increasing attentions from researchers because of a remarkable role in determining success or failure of a project. Calinescu et al.
(2013) have addressed the problem of resource allocation in survey designs and discuss its
impact on the quality of the survey results. They propose a novel method in which the optimal allocation of survey resources is determined such that the quality of survey results, i.e., the survey response rate, is maximized. Amirteimoori and Emrouznejad (2012) have proposed a DEA-based model to determine an optimal input/output resource allocation plan for banking sector with limitation in IT investment. Sadeghi and Ameli (2012) have presented an analytical hierarchy process (AHP) decision model for sectoral allocation of energy subsidy based on several criteria. Many attempts are made to uses the Data Envelopment Analysis (DEA) technique to solve the problem of allocating a fixed cost across a set of comparable decision making units (DMUs) in a fair way (Amirteimoori and Kordrostami, 2005; Lin, 2011;
Amirteimoori and Emrouznejad, 2011; Bi et al., 2011). Wiseman (2014) has provided an
overview of Mooney’s contributions to the use of community values in priority setting and resource allocation in health care. McCarthy et al. (2010) have proposed a non-linear optimization model incorporating with uncertainty to allocate resource for efficient environmental management. Their study showed that the theory solved a diverse range of important problems of resource allocation, including distributing conservation resources among the world’s biodiversity hotspots. Konur et al. (2013) have proposed a mathematic modelling approach to resource allocation for railroad-highway crossing safety upgrades.
Transit system, receiving a substantial part of financial support from government, is faced travelers’ discontent over what they perceive as an inefficient, ineffective, and unaccountable public transport services under conditions of slowed economic growth, demand for more and
23
better service, and general cost escalation. Consequently, how to efficiently allocate subsidy to transit system is raising ever-increasing research interests.
To finance public transport, government expects to benefit the community as a whole as well as achieving welfare maximization. Bhatta and Drennan (2003) have found considerable evidence that public transit yields benefits to the community in the form of increased output, increased productivity, lower production costs, higher incomes, higher property values, higher employment, and reduced noncommercial travel time. The important role of transit systems to society has led that almost all the public transit agencies receive a considerable portion of their operating income from taxpayer dollars. Virtually no transit agency could exist without heavy public subsidies. Regarding US case, in 2002 alone, transit providers nationally received about $12.8 billion in capital funds from various sources, with 41% from the federal government, 12% from state sources, 20% from local sources, and the remainder from taxes levied by transit agencies and other directly generated sources (American Public Transportation Association, 2005). Due to a heavy financial burden to governments, the subsequent doubts about whether it is a drain on system assets requiring inordinate amounts of attention, finances, and scarce resources are naturally followed. Meanwhile, although the mounting public resources are invested into public transport, the complaints about lower service quality and unreliable transit system increasingly arises from all walks of life. The issues have caused a debate on the requisite need to efficiently and reasonably allocate the subsidy into transit system.
A thorough review of literature indicates that most of relevant studies on transit subsidy allocation are traditional capital-based or cost-proportional methods (e.g. based on or proportional to total mileage, fuel consumption, or total passenger-trips) to compensate transit operators to cover their operational loss and preserve their financial stability. In those models,
24
there are two commonly used criteria to allocate transit subsidies, namely equity and economic efficiency (Douglas, 1998). Equity is always evaluated in terms of the ability-to-pay principle, in which users should contribute to the cost of services according to their income ability (Cervero, 1998). The efficiency focuses on economist’s efficiency arguments such as economics of scale
and external benefits. Consequently, users are required to pay for the cost of services in line with the benefits they receive (Douglas, 1998). The way of allocating subsidy considering “equity” is
to offset all of a proportion of the difference between service fare and service cost. One of commonly used approaches following the equity criterion is the expenditure-income ratio method, which was developed by Zahavi (1979). On the other hand, when considering efficiency, transit subsidy allocation is usually done via the benefit-cost ratio analysis, where the user cost plays an important role in subsidy allocation, which is believed to have impact on the transit services unreliability (Bowman and Turnquist, 1981; Jolliffe and Hutchinson, 1975). A handful of practical models have been proposed since the 1980s for transit subsidy allocation. For examples, Glaister and Lewis (1978) have developed a quantitative estimation model of public transit subsidies for London from the viewpoint of peak and non-peak passenger volume.
Tisato et al. (1992) developed a subsidy calculating model based on the public transit service
quality. These capital-based or cost-proportional methods, though effective to keep financial stability of transit operators, may not actually function to provide sufficient incentives for them to improve their performance in the next operational cycle. Many studies have indicated that there exists a negative correlation between the amount of capital-based subsidy and a transit operator’s performance (Obeng and Sakano, 2008). This is due to the fact that the operational performance of transit operators has not been properly integrated into the subsidy allocation
25
process. In other words, the higher the loss/cost a transit operator incurs the higher the subsidy it would be compensated.
In the past decade, the general public has become more demanding on the efficient utilization of limited public resources and expected higher service quality from the transit system. Such pressure leads to the increasing emphasis on the transition from the traditional cost-based transit subsidy allocation to the Performance-based Budgeting (PBB) system, in which the resources or subsidies are allocated according to transit system’s performance.
The concept of PBB is not new to public administration. Schultz (2004) has described PBB as a type of public sector budgeting that uses information on the performance of an agency or program to help determine the level of resources allocated to it. The aim is to provide governments with information that allows them to determine how efficient and effective current activities are and whether better value for money can be achieved by changing the level or mix of resources allocated. Such a system was designed to enable budgeters and policymakers to make substantive budget choices, as traditional budgeting processes are no longer considered satisfactory. However, applying PBB into transit subsidy allocation remains challenging and is still at its exploratory stage although some states have made some attempts to establish their own PBB system to budget their transit systems. For example, Mandizvidza (2005) has unfolded an examination and analysis of the application of the performance-based budgeting systems in California urban transit agencies. However, the author mainly discussed the performance measurement system used to implement the PBB for transit agencies via a survey, and no methods have been proposed related to subsidy allocation. In review of literature, very limited efforts have been made to develop incentive-based or performance-based transit subsidy allocation models.
26 2.4. Summary
In summary, this chapter has provided a comprehensive review of existing research efforts in the transit system efficiency assessment and subsidy allocation. Limitations of previous studies have been identified to be used to constitute the basis for subsequent developments of the multi-dimensional transit system efficiency assessment and incentive-based subsidy allocation framework and models. Some additional areas which have not been adequately addressed in existing literature are summarized below:
There lacks a multi-dimensional framework for transit efficiency evaluation for various levels of applications with both subjective judgments and objective assessment from multiple stakeholders taken into account;
There lacks sufficient investigations in identifying indicators or criteria at various levels of applications;
Most previous studies on transit efficiency/performance evaluation focus on the service and operational aspects, which can find their best application in developed regions with well-established transit systems. For areas that are still in the developing stage, the comprehensive impacts of other critical factors such as developing policies/priorities, infrastructure/facilities, energy/sustainability, and/or safety on urban transit system development have not been sufficiently investigated in previous studies;
Most commonly used multiple criteria ranking methods, e.g. Analytic Hierarchy Process or Data Envelopment Analysis, lack sufficient flexibility in altering their evaluation framework to account for the interaction between the importance of technical criteria and the preferences of decision makers. They also fail to provide reliable ranking and assessment results when the dataset used is limited and
27
unrepresentative. In addition, how to prevent the very unbalanced scale, vagueness, and uncertainty of judgment when weighting the importance of different criteria remains challenging;
Traditional capital-based subsidy allocation methods, though effective to keep financial stability of transit operators, may not actually function to provide sufficient incentives for them to improve their performance. There lacks an effective theoretical modeling framework in literature that can feed transit efficiency assessment into subsidy allocation in a close-loop way; and
There lacks an overall operational framework or guidelines that can effectively integrate the efficiency assessment and subsidy allocation models for real-world application.
Previous studies display an absence of route level incentive-based subsidy allocation and targets setting mechanisms with the applicable models.
In view of the above limitations in the existing studies, this research aims to develop a comprehensive and robust multi-dimensional transit system evaluation framework for various levels of applications. In the meantime, this research is expected to contribute to filling the vacancy of a theoretically justified and practically applicable model that can prioritize limited resources to urban transit operators according to their operational and financial efficiencies. Additionally, a route-level subsidy allocation and target setting model is also activated to bridge the gap in relevant research areas. Operational guidelines will be also developed and validated through extensive real-world case studies to assist responsible agencies in best application of the proposed models.
28
Chapter 3: A Systematic Modeling Framework
3.1. IntroductionThis chapter will illustrate the modeling framework of the proposed research and the interrelations between its principle components. Also included are the key research issues in the development of each modeling component and proposed primary research tasks to address those issues.
3.2. Key Research Issues and Primary Research Tasks
Some major research issues to be addressed in this research are listed below:
Selection of evaluation criteria or indicators for transit efficiency assessment at various levels of applications;
Design of a multi-dimensional assessment framework, which coordinates interactions among key evaluation models and features the flexibility to alter the evaluation framework to account for the variation of the importance of evaluation criteria;
Development of a set of multi-criteria transit efficiency assessment models for various levels of applications, which can provide reliable ranking and assessment results for limited and unrepresentative dataset and prevent the unbalanced scale, vagueness, and uncertainty of judgment when weighting the importance of different criteria;
Development of a financial efficiency evaluation model to measure financial performance of transit operators during subsidy allocation;
Design of an incentive-based transit subsidy allocation mechanism and models for bus operators, which take into account both operational efficiency and financial efficiency;
29
Design of a route-level subsidy allocation and target setting models, which help authority to subdivide company’s subsidy and targets into bus routes simultaneously; and
Application of the proposed frameworks and models in real-world case studies to validate their applicability and provide guidelines to responsible agencies.
It should be noted that all above research issues are interrelated and each is indispensable for the proposed research. To address these critical issues, this proposal has divided the research efforts into the following research tasks falling into three major categories:
Framework design:
Task 1: Develop a comprehensive multi-dimensional evaluation framework composed
of multiple modules to perform city/region level, operator-level, and route level transit efficiency evaluation.
Task 2: Develop an incentive-based subsidy allocation frameworks based on
operational and financial efficiencies.
Task 3: Develop an overall operational framework and guidelines that can effectively
integrate the efficiency assessment and subsidy allocation models for real-world application.
Model development:
Task 4: Develop a robust two-level multi-criteria evaluation model for city/regional
level transit system efficiency evaluation, where a “policy level” is designed to better capture a city’s characteristics and developing priorities as well as the subjective opinions of various transit stakeholders, based on which technical criteria are further compared and assessed in the “technical level” with an enhanced fuzzy Analytical
30
Hierarchy Process (AHP) model, where a non-linear optimization formulation is proposed to maximize the consistency in pair-wise comparison and weight estimation. The developed two-level framework offers the advantage of preventing the vagueness and uncertainty of the decision-maker(s) when evaluating technical criteria while properly retaining the policy preferences. The evaluation model is expected to generate macroscopic rankings of different cities in terms of transit system development and also to identify microscopic deficiencies and areas of improvement.
Task 5: Develop an enhanced Data Envelopment Analysis (DEA) model with
constrained cones to examine the efficiency of multiple transit operators with the preferences over various input and output indicators better captured.
Task 6: Develop a Bootstrap Super-DEA approach to evaluate route-level bus
operational efficiency based on empirical data and advanced repeated sampling approach to improve the estimation of the critical value precision statistics and fine-tune the evaluation results from small sample dataset. To prevent the errors due to imperfect data and judgment mistakes, an efficiency interval estimator will be also developed to suggest the efficiency boundaries for each bus route.
Task 7: Estimate financial efficiency by comparing operational costs and operational
dataset with a revised SBM super efficiency model.
Task 8: Develop an innovative target-setting-based inverse DEA model to allocate the
limited subsidies with the objectives to maintain financial sustainability and to improve operational efficiency.
Task 9: Develop a centralized resource allocation model to subdivide bus operator’s
31 Case studies:
Task 10: Use illustrative real-world examples to demonstrate the procedure of each
proposed framework and further test each developed model.
3.3. Modeling Framework
In view of the above research tasks, Figure 3.1 depicts the framework of the proposed system for this dissertation, highlighting interrelations between principal system components. This study will focus only on those modules within the transit system efficiency assessment tools for different dimensions as well as incentive-based subsidy allocation model.
32
33
Chapter 4: Multi-Dimensional Transit Efficiency Assessment
4.1. IntroductionThis chapter will propose to develop formulations of models for transit performance and efficiency evaluation at three different levels of applications, namely the city/regional level, the operator level and the route level. At the city/regional level, this study develops a framework with both policy and technical layers, which offers the advantage of preventing the vagueness and uncertainty when evaluating technical criteria while properly retaining the policy preferences from decision makers. The policy layer is designed to better capture a city’s characteristics and developing priorities as well as the subjective opinions of various transit stakeholders, based on which technical criteria are further compared and assessed in the “technical layer” with an innovative fuzzy Analytical Hierarchy Process (AHP) model, where a non-linear optimization formulation is proposed to maximize the consistency in pair-wise comparison and weight estimation. At the operator level, an enhanced DEA (data envelopment analysis) model with constrained cones is proposed to offer advantages in considering weights assigned to different performance indicators when the efficiency of transit operators are assessed. Such modeling improvement can remedy the deficiency of traditional DEA models in evaluating the relative efficiency of decision-making units but not allowing for ranking of the efficient units themselves. At the route level, this study proposes to develop a Bootstrap Super-DEA model based on empirical data and repeated sampling to prevent the errors due to imperfect data and judgment mistakes. The proposed model is also expected to yield the confidence intervals to suggest the efficiency boundaries for each bus route operation. Case studies will be performed for all three levels of models.