Exploring and Evaluating the Scalability and Efficiency
of Apache Spark using Educational Datasets
Jian Zhang
A THESIS SUBMITTED TO
THE FACULTY OF GRADUATE STUDIES
IN PARTIAL FULFILLMENT OF THE REQUIREMENTS
FOR THE DEGREE OF MASTER OF ARTS
Graduate Program in
Information System and Technology
York University
Toronto, Ontario
April 2018
ii
Abstract
Research into the combination of data mining and machine learning technology with web-based
education systems (known as education data mining, or EDM) is becoming imperative in order
to enhance the quality of education by moving beyond traditional methods. With the worldwide
growth of the Information Communication Technology (ICT), data are becoming available at a
significantly large volume, with high velocity and extensive variety. In this thesis, four popular
data mining methods are applied to Apache Spark, using large volumes of datasets from Online
Cognitive Learning Systems to explore the scalability and efficiency of Spark. Various volumes
of datasets are tested on Spark MLlib with different running configurations and parameter
tunings. The thesis convincingly presents useful strategies for allocating computing resources
and tuning to take full advantage of the in-memory system of Apache Spark to conduct the tasks
of data mining and machine learning. Moreover, it offers insights that education experts and data
scientists can use to manage and improve the quality of education, as well as to analyze and
iii
Acknowledgements
I would like to express my gratitude to my supervisor Professor Zijiang Yang for the useful
comments, remarks and engagement through the learning process of my master thesis and the
research. Her guidance helped me in all the time of my pursuing of the master academic learning.
I also own a deep sense of gratitude to Professor Marin Litoiu for his keen informative interest
and support with my thesis. His course offered me extensive and clear clue on the research of the
thesis.
Furthermore, I would like to thank Professor Huaiping Zhu for his support with my thesis. Also,
I want to thank Professor Michael Chen for the support with his laboratory of Apache Spark
Cluster in York University.
Finally, I would extend my appreciation to my family and my mother for their supports and
iv
Table of Contents
Abstract ... ii Acknowledgements ... iii Table of Contents ... iv List of Tables ... viList of Figures ... vii
Chapter 1. Introduction ... 1 1.1 Motivation ... 1 1.2 Problem Definition ... 4 1.3 Significance... 7 1.4 List of Contributions ... 8 1.5 Thesis Outline ... 8
Chapter 2. Literature Review ... 10
2.1 Cognitive Learning System Analytics with Data Mining ... 10
2.1.1 Cognitive Tutor System ... 11
2.1.2 Educational Data Mining and Big Data ... 11
2. 2 KDD Competition Paper Review ... 16
Chapter 3. Data Mining Methodologies ... 20
3.1 Data Mining Process ... 20
3.2 Data Preparation ... 23
3.2.1 Data Transformation ... 23
3.2.2 Data Discretization ... 24
3.2.3 Feature Selection ... 25
3.2.4 Imbalanced and Sparse Data ... 26
3.2.5 Missing Values ... 27
3.2.6 Normalization and Standardization ... 28
3.3 Data Mining Algorithms ... 30
3.3.1 Logistic Regression ... 30
3.3.2 Decision Tree and Random Forest ... 31
3.3.3 Support Vector Machine ... 34
3.3.4 Clustering ... 35
Chapter 4. Big Data with Distributed Systems ... 37
4.1 Apache Hadoop ... 37
v Chapter 5. Methodology ... 47 5.1 Data Pre-processing ... 48 5.1.1 Feature Generation ... 49 5.1.2 Feature Manipulation ... 50 5.1.3 Standardization ... 52 5.2 Learning Algorithms ... 52
5.3 Implementation with Python on Apache Spark ... 53
5.4 Scalability and Performance Evaluation Design ... 55
5.4.1 The Infrastructure of York University Spark Cluster ... 55
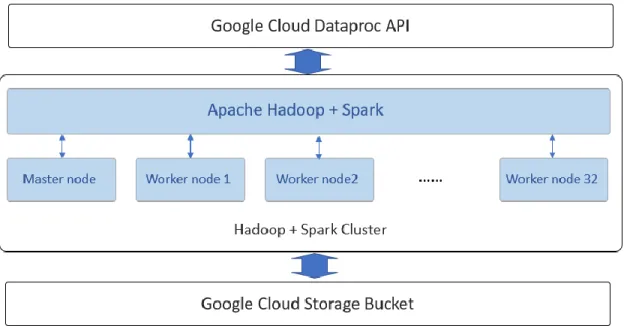
5.4.2 The Infrastructure of Google Cloud Dataproc Spark Cluster ... 57
Chapter 6. Results and Discussion ... 59
6.1 Datasets Overview ... 60
6.2 Data Pre-processing ... 62
6.2.1 Feature Generation ... 62
6.2.2 Feature Manipulation and Standardization ... 65
6.3 Learning Algorithms Experiments on Spark Clusters ... 66
6.3.1 Classification Results with York University Lab Spark Cluster ... 66
6.3.2 Classification Models for Google Cloud Dataproc Spark Cluster ... 72
6.3.3 Experiments on Datasets with Varied Volumes ... 79
6.3.4 Experiment with Re-partition of One million Cases Dataset ... 86
Chapter 7. Conclusion and Future Works ... 89
7.1 Conclusion ... 89
7.2 Future Work ... 91
Reference ... 93
Appendix ... 102
A. Coding Reference ... 102
1. Logistic Regression on Spark version 2.2.0/2.0.0 ... 103
2. Support Vector Machine on Spark version 2.2.0 ... 104
3. Decision Tree on Spark version 2.2.0 ... 105
vi
List of Tables
Table 1 KDD Competition Datasets ... 47
Table 2Results of Logistic Regression experiment I on York U Spark Cluster ... 67
Table 3 Results of Logistic Regression experiment II on York University Spark Cluster ... 69
Table 4 Comparison of memory strategies on York U Spark Cluster ... 71
Table 5 Results of Logistic Regression(10-folded) on Cloud Spark Cluster... 73
Table 6 Results of SVM (10-folded) on Cloud Spark Cluster ... 74
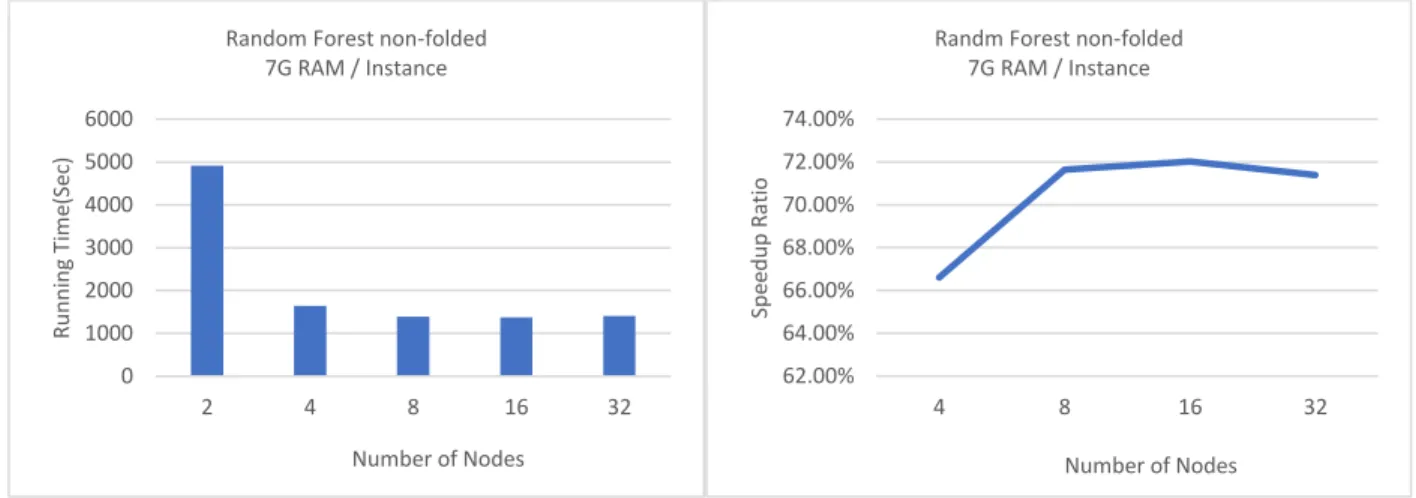
Table 7 Results of Random Forest (non-folded) on Cloud Spark Cluster ... 75
Table 8 Results of Decision Tree (non-folded) on Cloud Spark Cluster ... 76
Table 9 Results of SVM (non-folded) on Cloud Spark Cluster ... 77
Table 10 Results of LR (non-folded) on Cloud Spark Cluster ... 78
Table 11 Results of LR (non-folded) with 2 Million cases dataset ... 80
Table 12 Results of SVM (non-folded) with 2 Million cases dataset ... 81
Table 13 Results of LR (non-folded) with One Million cases dataset ... 81
Table 14 Results of SVM (non-folded) with One Million cases dataset ... 82
Table 15 Results of LR (non-folded) with Half Million cases dataset ... 83
Table 16 Results of SVM (non-folded) with Half Million cases dataset ... 83
Table 17 Results of LR re-partition with One Million cases dataset ... 87
vii
List of Figures
Figure 1 Data mining working process ... 21
Figure 2 Apache Hadoop Ecosystem ... 38
Figure 3 Apache Spark Stack ... 42
Figure 4 Design of the experiments ... 48
Figure 5 The York University Spark Cluster Architecture ... 56
Figure 6 The Google Cloud Spark Cluster Architecture ... 57
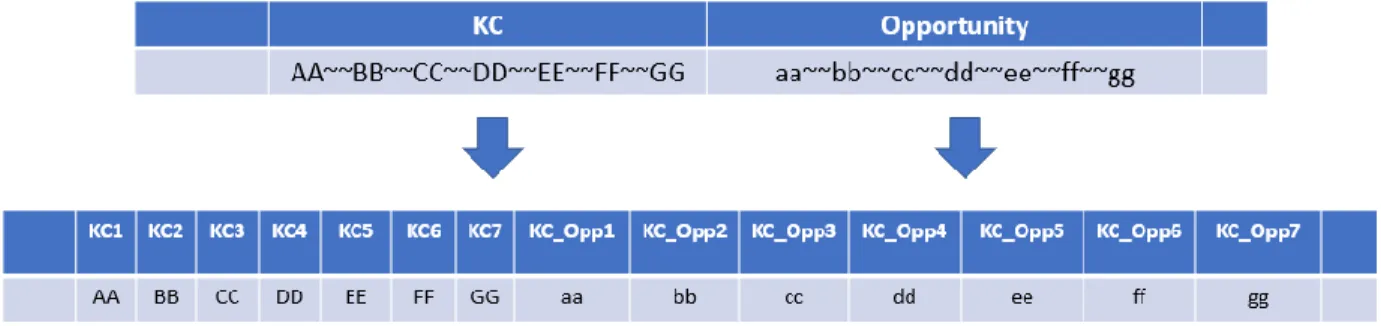
Figure 7 Feature break up ... 63
Figure 8Results of Logistic Regression experiment I on York U Spark Cluster ... 68
Figure 9 Results of Logistic Regression experiment II on York University Spark Cluster ... 69
Figure 10 Comparison of memory strategies on York U Spark Cluster ... 71
Figure 11 Results of Logistic Regression(10-folded) on Cloud Spark Cluster ... 73
Figure 12 Results of SVM (10-folded) on Cloud Spark Cluster ... 74
Figure 13 Results of Random Forest (non-folded) on Cloud Spark Cluster... 75
Figure 14 Results of Decision Tree (non-folded) on Cloud Spark Cluster... 76
Figure 15 Results of SVM (non-folded) on Cloud Spark Cluster ... 77
Figure 16 Results of LR (non-folded) on Cloud Spark Cluster ... 78
Figure 17 Results of LR (non-folded) with 2 Million cases dataset ... 80
Figure 18 Results of SVM (non-folded) with 2 Million cases dataset ... 81
Figure 19 Results of LR (non-folded) with One Million cases dataset ... 82
Figure 20 Results of SVM (non-folded) with One Million cases dataset ... 82
Figure 21 Results of LR (non-folded) with Half Million cases dataset ... 83
Figure 22 Results of SVM (non-folded) with Half Million cases dataset ... 84
Figure 23 Results of LR re-partition with One Million cases dataset... 87
1
Chapter 1. Introduction
While the meteoric rise of digital technologies, including e-learning, has had a massive impact
on education in practically every domain, including learner engagement, teaching management,
content generation, and performance evaluation, and more, at the same time, vast volumes of
data are being generated by innovated learning facilities that could be meaningful for both
academic and scientific analysis. This thesis focuses on applying the data mining and machine
learning methods to analyze the data of student’s online learning activities with the distributed
computing system of Apache Spark. In doing so, it reveals the value of Apache Spark’s
scalability and the performance in comparison to the big data analytics of online cognitive
learning systems.
1.1
Motivation
For decades, experts and educators have been searching for more practical ways to assess student
learning outcomes and curricular design without the requirement of human expertise or analysis.
Does the knowledge structure meet the requirements of the subject or curriculum with proper
difficulties that most of students could accept? Is there any variance in the learning rates between
students? Is it possible to design the problems that suit learning outcomes and are based directly
on the students’ performance data? Currently, K-12 education is focused on assessment using
new, high-stakes standards-based tests, as required by the No Child Left Behind Act (NCLB) of
2
time and effort to prepare and take these tests, often sacrificing valuable time that would
otherwise be spent on deep learning (long-term retention, transfer and building the desire for
future learning). The limited classroom time available in school mathematics classes causes a
further dilemma in that it compels teachers to choose between time spent assisting students'
development and time spent assessing students' abilities [6].
To resolve this dilemma, the U.S. Department of Education built an integrated web-based
tutoring system, ASSESSment, that can do assessment and provide assistance at the same time. It
offers instruction to students while providing a more detailed evaluation of their abilities to the
teacher.
Online tutoring systems for mathematics are based on the cognitive model, which is a set of
production rules or skills encoded in intelligent tutors to model how students solve problems.
Productions embody the knowledge that students are trying to acquire, and they allow the tutor to
estimate each student’s learning of each skill as the student works through the exercises [31]. Cognitive tutoring system help students work through complicated problems by breaking them
into sub-steps with sub-knowledge components, while simultaneously collecting all the system
interaction data of the students’ performance, including accuracy, speed and hints times. Used in
more than 2,500 schools serving half a million students every year across the U.S., the cognitive
tutors generate a vast amount of students’ interaction data that can be used as a rich source for
3
Various statistical works and analyses have been developed by experts to help teachers better
understand students’ performance and progress in order to improve instructions [1]. The important practical fact is that, with designed analyses and improved models, millions of hours
of students’ time spent learning mathematics could be saved, and desired achievement levels could be increased. From the scientific perspective, discovering methods for accurately
predicting students’ performance could help to uncover critical underlying factors of curricula
and lesson design.
Additionally, the development and application of data mining and machine learning with the use
of big data can lessen the amount of expertise required to conduct analyses of cognitive tutoring.
The combination of data mining technology with web-based education systems (known as
education data mining, or EDM) is becoming an important research area in this regard, as it
shows increasingly promising results.
A variety of research has been conducted applying data mining approaches to education; these
include predicting the student retention risk and academic performance, curricula design and
more [32]. Yadav, Bharadwaj and Pal [33] used a machine learning algorithm to predict the dropping out risk for the first-year students in higher education, while Márquez-Vera, Cano, Romero and Ventura [22] proposed a genetic programming algorithm and different data mining approaches to predict the student failure in high school. Moreover, Kabakchieva [23] presented a
method of classification for predicting students’ performance in college based on personal and
4
Recently, cloud-based technologies like Apache Hadoop and Spark have enhanced our ability to
conduct such analyses by offering significantly increased computing speed, flexibility and
scalability. IT behemoths like Facebook, eBay, IBM and LinkedIn have used the MapReduce
framework of Hadoop with the distributed file system HDFS for large volume data storing,
managing and processing for many years. Apache Spark, the second generation of Hadoop, is
becoming the de facto standard for big data analytics with some of its key features including in
memory computing, fault tolerance and data structure abstraction.
1.2 Problem Definition
This thesis is based on the KDD Cup 2010 Educational Data Mining Challenge. KDD Cup is the
annual data mining and knowledge discovery competition organized by the Association for
Computing Machinery’s (ACM) Special Interest Group on Knowledge Discovery and Data Mining (KDD). ACM is the leading professional organization of data miners. This year’s
competition provided student’s interaction log datasets from two Online Intelligent Tutoring
Systems. The task was to use the development datasets or training sets to build learning models
and accurately predict the students’ performance on the test datasets.
Datasets for data mining from educational online learning systems normally have some common
characteristics, that make both the data analytics and prediction works difficult to undertake with
traditional, computer-based data mining and machine learning workflows. These include the
following:
• Variant structured data
5
• Super sparse value matrix
• Imbalanced output
• Streaming data
The volume of data from web-based learning systems has been one of the main concerns for
EDM, which needs various computing algorithms and high-level iterations for regression and
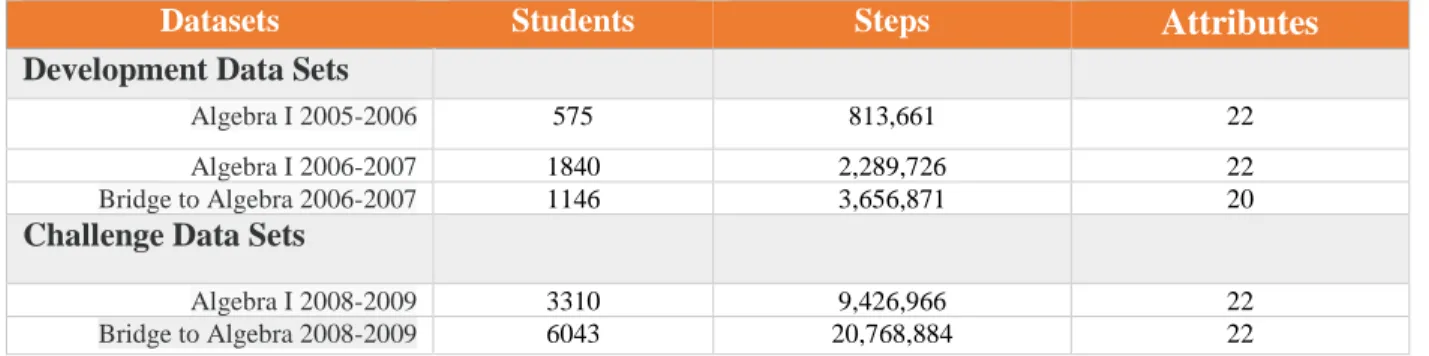
classification analytics. For example, of the datasets in this thesis, the smallest one is from the
Carnegie Learning Algebra system deployed in 2005-2006, which covers only 515 students with
813,661 cases. The data have variant data types, including string, integer, float, time sequences
and categorical values, while some of the variables are extremely imbalanced and sparse. Some
features, such as ‘KC’, which represents the knowledge components of each question, make for
an extreme sparse vector matrix with an imbalance in the number of knowledge components in
most cases. The feature with the highest number of categorical values is StepName, which has
more than 180,000 different nominal values, making it difficult to perform the classification
algorithms on a normal computing platform. With the tremendous growth of data sources,
innovative technologies, including data distribution and parallelization computing, are becoming
more appealing to conduct this kind of task of data mining and machine learning with massive
data.
Teams from all over the world joined in the competition. Two results attributes reflected the
prediction accuracy from the applicants; these were Cup Score and Leaderboard Score. The Cup
Score was the evaluation method of using the majority of the prediction files to reach an RMSE score, while the Leaderboard Score used the small portion of the prediction files to score the
6
The teams on the Cup Score board took the processes of feature generation, feature selection,
latent factor identification, regularization, loss function and ensemble together with a variety of
classification and regression methods including Decision Tree, Linear classifier, Non-linear
kernel method, Random Forest, Neural Network, Nearest Neighbor, Neighborhood/correlation
based collaborative filtering and more. Some teams used very simple classification algorithms
and only a portion of the dataset but finally got acceptable prediction results on the board. This
phenomenon brings the probability of the information contained in the datasets coming with
limitation, so the performance on the accuracy of the prediction could be improved with limited
extent even sophisticated data mining processes involved. Nevertheless, almost all of the teams
were concerned with the size of the datasets and the running time required for model building
and validation. The Zach A. Pardos team, which reached fourth position on the All Teams
board, indicated that the running time for the KC model they built with the hardware that
included a 30 node rocks cluster with 4 CPUs per node and a 6 node rocks cluster with 8 CPUs
per node was two days. This time requirement is neither acceptable nor practical in an industry
that is growing at such a fast pace. Therefore, we must find methods to improve the performance
of the prediction process. One method involves digging deeply into the processes of data mining
algorithms in order to increase prediction accuracy results. This thesis, however, focuses on
evaluating the running time and scalability of the popular distributed computing engine Apache
Spark working for this large scale big data analytics with computing resources utilization and
7
1.3 Significance
Previous research has revealed the potential scalability of the techniques of data mining and
machine learning techniques on distributed computing systems when conducting the big data
analysis [38][40][54][71][73][75]. The new platform, Apache Spark, based on the most famous
distributed computing system, Apache Hadoop, can reach the speeds up to 100x faster than
Hadoop MapReduce on most of the computing tasks [72]. Thus, it has emerged as the next
generation of big data processing engines and is one of the most scalable and efficient platforms
for big data analytics. Spark’s machine learning library (MLlib) makes practical machine
learning scalable and easy by providing a few of the most commonly used data mining
classification and regression algorithms as well as variety of utilities and tools, including feature
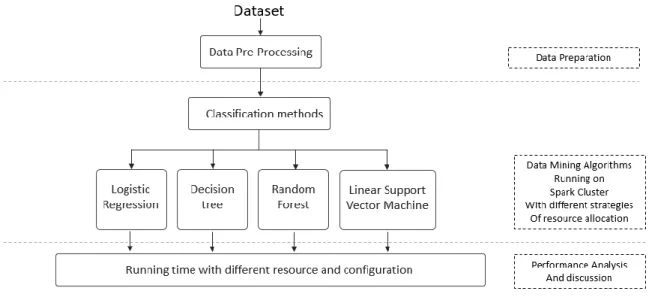
processing, pipeline tuning and more. In this thesis, four classification methods including
Logistic Regression, Linear SVM, Decision Tree and Random Forest in MLlib are coded in
Python to predict student’s performance based on the massive data from the online cognitive
learning systems. The purpose of this thesis is to reveal the scalability of the Apache Spark on
big data of education data mining. The experiments were performed on a local Hadoop YARN
based Spark cluster and a Google Cloud Hadoop YARN managed Spark cluster. The results of
the thesis provide consolidated supports for the scalability and efficiency of Spark in terms of
resource allocation and management as well as the run-time tuning for the EDM purposes. While
such work continues to require extensive exploration in the future, the findings of this thesis can
help education experts to discover important information regarding students’ learning and predict
8
1.4 List of Contributions
This thesis provides some notable contributions to the employment of Apache Spark’s
distributed computing platform to conduct data mining on big data produced by educational
online learning systems.
• Feature analysis and processing: This thesis presents a full path of feature analysis and manipulation during the process of data mining with the datasets from the Online
Learning Systems.
• Experiments on the scalability of Spark: A few experiments are made with the Cloud and
local YARN based Apache Spark clusters to reveal the scalability and efficiency of the
platform of Spark on the tasks of big data analytics with education purpose.
• Resource allocation, utilization and tuning analysis of Spark: A thorough discussion and analysis of the results of Spark resource allocation and utilization as well as run-time
parameter tuning for optimization.
1.5 Thesis Outline
The remainder of the thesis is organized as follows:
Chapter 2 is the literature review that introduces the cognitive tutor systems and discusses data
mining techniques as well as data mining for educational purposes. In Chapter 3, the most
commonly used data mining and data processing methodologies and approaches are introduced,
and the process of the data mining presented here is revealed. Chapter 4 introduces the
9
methodologies designed for this thesis. In Chapter 6 the results and discussions are presented
based on the outputs of the experiments, while Chapter 7 concludes the thesis and summarizes
10
Chapter 2. Literature Review
Emerging data mining and big data technologies have made it possible to explore the potential
understanding of the students and the quality of teaching materials using the increasingly
large-scale data being produced by the domain of educational technology. The data can come from
online interactive learning systems or schools’ administrative records and may contain
meaningful information for the educators and experts to improve the teaching quality and gain
more insight into the design of the learning environments and educational resources.
2.1 Cognitive Learning System Analytics with Data Mining
Cognitive learning refers to how a person processes and reasons information. Cognitive learning
systems are intelligent tutoring systems that employ cognitive learning by using a set of
production rules or skills to model how students learn and solve problems. With the development
and incorporation of innovative technologies, including data mining, machine learning, artificial
intelligence and more, online cognitive tutoring systems have the potential to significantly
improve education by accelerating learning speed, saving learning time, providing insights that
11
2.1.1 Cognitive Tutor System
A cognitive tutor is a type of theory based intelligent tutor. Intelligent tutors draw on artificial
intelligence technology to provide interactive instructions that adapt to individual students’ needs
and, most typically, supports student practice in learning complex problem solving and reasoning
skills. The theory of cognitive psychology of problem solving and knowledge components
structure for learning experience makes the cognitive tutor system an effective method to
evaluate and make prediction for the performance of students [3]. Koedinger and Aleven [3]
provided a few examples of experiments within cognitive tutors that explored trade-offs between
giving and withholding instructional assistance, which provided support for cognitive tutors to
balance the giving and withholding of information and for individual interactive elements.
Cen, Koedinger and Junker [4] proposed a semi-automated method to improve a cognitive model
called Learning Factors Analysis (LFA), which was combined with a statistical model, human
expertise and combinatorial search, to measure the difficulty and learning rates of knowledge
components and to predict student performance. With the statistical method, a multiple
regression model was developed to quantify the skills.
2.1.2 Educational Data Mining and Big Data
Data mining is defined as the process of discovering patterns in data. The process must be
automatic or semiautomatic. The patterns discovered must be meaningful in that they lead to
12
[2]. Data mining involves various modern technologies including machine learning, database
technology and statistics. The purpose of data mining is to discover and reveal the hidden
patterns that may have significant importance to industry, business and science as well as normal
human life. Enormous efforts have been made in the domain of data mining from the
perspectives of learning algorithms, dataset manipulation, feature selection and system design
and implementation.
Data mining technology has been applied in the education domain for a long time, and numerous
studies involving a variety of learning algorithms have been conducted with the goals of
improving learning quality, predicting retention possibilities, discovering learning curves and
more. Romero and Ventura [26] surveyed the most relevant studies carried out in the field of
education data mining. They introduced EDM and described the diverse groups of users, types of
educational environments and the data users provided. They also listed the most typical/common
tasks in the educational environment that had been resolved through data mining techniques and
discussed some of the most promising future lines of research in EDM.
Ben Daniel’s [19] research identified contemporary challenges that institutions of higher
education worldwide are facing and explored the potential of big data to address these challenges.
Slater, Joksimović, Kovanovic, Baker and Gasevic [29] highlighted some of the most widely used, most accessible, and most powerful tools available for the researchers interested in
13
Abuteir and El-Halees [21] conducted a case study about how educational data mining could be
used to improve graduate students’ performance and to overcome the problem of graduate
students’ low grades. They conducted four data mining tasks, including association, classification, clustering and outlier detection to present the extracted knowledge and describe its
importance in the educational domain.
Feng, Heffernan and Koedinger [6] built a “lean” Rasch model (1-PL IRT model) and used Linear Regression to predict student proficiency and MCAS test scores based on each student’s
performance history in the ASSISTment Tutor System. They also ran a stepwise regression
analysis, called the assistance model, based on the interactions between the student and the
system. With these models, new features were generated and fitted into a new stepwise
regression model called the mixed model. They concluded that the mixed model made
significantly good predictions for the student’s performance in the system.
Yu, DiGangi, Jannasch-Pennell and Kaprolet [7] brought in a new perspective by exploring student retention possibilities with three data mining technologies: classification trees,
multivariate adaptive regression splines (MARS), and neural networks. They discovered some
useful insights into various factors that impact student retention, including transferred hours,
residency, and ethnicity.
Ramaswami and Bhaskara [8] built a tree-based CHAID prediction model to predict students’
performance based on the dataset from a detailed questionnaire using an experimental
14
in secondary education, location of school, living area and type of secondary education were the
strongest indicators of the students’ performance in higher secondary education.
Hung, Hsu and Rice [10] investigated an innovative approach to program evaluation through analyses of student learning logs, demographic data, and end-of-course evaluation surveys in an
online K–12 supplemental program. Clustering analysis was applied to reveal the students’
characteristics, while decision tree was used to predict student performance and satisfaction level
about the course. Their study demonstrated the benefits of incorporating data mining into the
program evaluations of K-12 online education.
Vandamme, Meskens and Superby [11] conducted a study in which they classified university students into three groups based on their chances of success in academic learning. They created a
questionnaire to collect a large amount of information from students and distributed this
questionnaire to first-year students in three French-speaking universities in Belgium. After the
feature selection they chose the most significantly correlated variables. Decision trees, neural
networks and a linear discriminant analysis were applied to make the prediction.
In this new era, enormous increases in data generation and storage have shifted attention in the
domain of data science toward the techniques of big data. The development of distributed and
cloud computing and storage systems greatly extends the scalability, as well as the performance
of traditional process of data mining and machine learning techniques. Kumar and Rath [71]
proposed methods of MapReduce based tests for feature selection along with the MapReduce
15
on the distributed framework of Hadoop cluster with four slave (data) nodes and a conventional
system. The performance of the classifier for various datasets was evaluated by varying the
number of features. Their experiment presented the significance of distributed computing for
better storage and faster processing of datasets, as well as system scalability.
As a part of the Apache Hadoop Ecosystem, Apache Spark was introduced to solve the
drawbacks of Hadoop by adding much faster in-memory computing speed, especially for large
scale data processing. Maillo, Ramírez, Triguero, and Herrera [72] presented an alternative
distributed kNN model for big data classification using Spark, which was denoted as kNN-IS.
They reduced the complexity of kNN to m tasks without requiring any preprocessing in advance
and relied on Spark to reuse the previously split training set with different chunks of the test set.
All the operations were performed within the RDD objects provided by Spark. Compared with
the traditional way of dealing with large scale data using the algorithm of kNN, the use of
Apache Spark has provided them with a simple, transparent and efficient environment to
parallelize the kNN algorithm as an iterative MapReduce process.
Scalability has always been a prolific field of study in the areas of data mining and machine
learning [73]. Arias, Gamez, and Puerta [73] experimented with the adaptability of the family of
Bayesian Network Classifiers (BNCs) to the MapReduce and Apache Spark frameworks. Their
proposal focused on the learning stage of such models, for which they introduced a general
framework that characterized the full family of BNC classifiers under the MapReduce paradigm.
To evaluate their proposal, they conducted a series of experiments over a broad range of both
16
the general framework of learning the probabilistic models from large scale datasets and high
dimensional feature space.
Mavridis, and Karatza [38] investigated log file analysis with the cloud computational frameworks Apache Hadoop and Apache Spark to study and compare the performance of the two frameworks in terms of scalability and resource utilization. They used an IaaS (Infrastructure as a Service) to create a private cloud infrastructure and then developed and ran realistic log analysis applications with real log files. They compared the two frameworks, evaluating the performance of execution time, scalability, resource utilization, cost and power consumption. Finally, they reached the conclusion that the rising Spark outmatched Hadoop in almost all cases with faster speed, higher mean utilization for resources and more flexible implementation, while both frameworks offered significant scalability.
2. 2 KDD Competition Paper Review
This thesis is based on the KDD 2010 Cup competition on education data mining. The goal of
the competition was to predict the student’s first attempt to solve a question with the given
datasets as model training and verifying, while the test datasets were supplied to evaluate the
correctness of the prediction models.
Yu, et al. [46] were organized as six student sub-teams and each student sub-team extracted
different features from the data sets according to their analysis and interpretation of the data.
17
engineering approaches can be categorized into two types: sparse feature sets generated by
binarization and discretization techniques, and condensed feature sets using simple statistics on
the data. Finally, ensemble methods were applied to the testing results from sub-teams. They
adopted the LIBLIENAR as an easy-to-use tool to deal with large scale classification problems.
The tool supports L2-regularized logistic regression(LR), L2-loss and L1-loss linear support
vector machines (SVMs). It inherits many features of the popular SVM library LIBSVM, while it
offers better performance and efficiency than LIBSVM on large-scale classification [60]. They
used Random Forest, AdaBoost and Logistic Regression as the classifiers, and some linear
ensemble approaches including simple averaging, linear SVM and linear regression were applied
for the ensemble of results from each student group.
T¨oscher and Jahrer [45] used an ensemble of collaborative filtering technology with neural
network blending to fit the competition. They got the idea from the recommender systems with
the same characteristics as missing values, big matrix and sparse data. They chose the
collaborative filtering method with the algorithms K Nearest Neighbor (KNN), Singular Value
Decomposition (SVD), Factor Model 1 (FM1), Factor Model 2 (FM2), Factor Model 3 (FM3),
Group Factor Model (GFM) and Restricted Boltzmann Machines (RBM). For calculating
similarities between users, they used the Pearson correlation between students calculated on the
subset of commonly answered steps [45]. Every model was trained and evaluated using 8-fold
cross validation. Finally, the neural network with two hidden layers was adopted as the blender
18
Pardos and Heffernan got the second place student prize in the competition with their method of
combining Bayesian Hidden Markov Models (HMMs) and bagged decision trees. The model
learns individualized student specific parameters (learn rate, guess and slip) and then uses these
parameters to train skill-specific models. The resulting model, which considers the composition
of user and skill parameters outperforms models that only consider parameters of the skill [62].
During the data pre-processing stage, they paid a lot of attention to clean the Step duration
variable, which reflected the time spent on the step. Bayesian Networks were used to model
students’ knowledge over time. Based on the parameters of the HMM for that skill and the
student’s past responses, a probability of knowledge was inferred [62]. The new feature sets generated by HMM were brought into Random Forest for training and making predictions
Shen et al. team [48] came in third in the student competition with the framework of a vague
prediction procedure. First, they built a scoring machine from the training set. The scoring
machine was designed to return a score vector when given a test record (that is, a test set step
record), and the scores in the returned vector were intended to reflect relevant information from
the Correct First Attempt, including student performance, step difficulty and more. Second, they
used the scoring machine to compute a score vector for every test record. Third, they made
predictions from the score vectors.
Tabandeh and Sami [49] used a relatively simply framework to come in fourth in the student
competition. During the feature selection stage, they removed all the features that did not appear
on the test data and made a conversion algorithm that converted highly categorical features to
19
time and avoid the limitation of the hardware requirement on big volume datasets, they sampled
the data by deleting one-third and one-seventh of all data. Then, C4.5 and Linear Regression
20
Chapter 3. Data Mining Methodologies
Data mining is the computing process of discovering patterns in large data sets involving
methods at the intersection of machine learning, statistics, and database systems[38]. The overall
goal of data mining is to discover information from the existing data and interpret it into an
understandable format with reasonable computing costs. The era of big data is coming, which
brings increasing sources of data that can be used to generate meaningful knowledge from
hidden patterns, while the fast-developing progresses of both hardware and software computer
technologies combined with various data mining algorithms make it possible to discover and
fully use of that hidden information in the massive data. Various data mining and statistical
algorithms have been designed and deployed to build analytic and predictive models across a
variety of industries and domains. Some most popular ones, including Logistic Regression, k-NN,
Decision Tree, Support Vector Machine, Random Forest and more, are widely applied and have
made signification contributions to the development of data science.
3.1 Data Mining Process
Business-driven needs push the fast development of processes in data mining technology,
including business understanding, data source retrieval, data manipulation, feature selection,
model building and output prediction. A simple chart in Figure 1 shows the working process of
21 Figure 1 Data mining working process
The process of data preparation or data pre-processing can be divided into several sub-processes,
including data cleaning, data integration, feature selection and data transformation. Among them,
feature selection has always been of greatest interest with the fast growth of real-world data
sources at both the dimensional aspect and mass quantity side.
Modeling is the process through which various software and modeling techniques are selected
and applied with tuned parameters to find optimal solutions. With different forms of data and
final requirements, different techniques and algorithms should be used to build models. The most
well-known data mining models are normally classified as supervised models and un-supervised
models:
• Regression is the most straight forward and well known predictive model. Linear Regression and Logistic Regression are the most popular ones used in a variety of
domains.
• Association Rule Discovery is a rule-based machine learning method for discovering relationships between variables in large databases [50].
22
• Classification is used to classify big data according to the format and characteristics of the data. Many classification methods and algorithms are used based on the application
selected and the problem that needs to be solved. Some of the most popular supervised
classification methods, including Decision Tree (DT) and Support Vector Machine (SVM)
are used widely on a variety of data mining applications and platforms.
• Clustering is the un-supervised method of grouping of sets of data based on their characteristics and similarities. Within a clustering model, clustering algorithms can be
categorized into different models. Among them, the most well-known model is k-means
clustering.
Model evaluation is an important part of the data mining process, because it is through
evaluation that the best model and parameters for the future stages are found. There are two most
commonly used methods of model evaluation in data science are Hold-Out and Cross-Validation.
The former method randomly divides the dataset into three subsets called training set, validation
set and test set. The latter method is known as k-fold cross-validation, which divides the dataset
into k equal size subsets and leaves out k-1 of the subset for training with the test set.
After the model is validated and evaluated, it will be produced and implemented with other
processes, such as reporting systems or predicting applications. New data will be applied to the
23
3.2 Data Preparation
Data preparation is one of the most important parts of the data mining workflow. For one or
more of the following reasons, raw data is not normally ready for immediate analysis by
data-mining computing algorithms: data is not clean or missing values, data format needs to meet the
input requirements of analysis algorithms, data has noise, input/output values are imbalanced and
more. In most cases, the data mining and machine learning results can be improved markedly by
suitable manipulations of the data before analysis. In this section, some of the most commonly
used data preparation methods for data mining are illustrated.
3.2.1 Data Transformation
During data transformation, data are transformed or integrated into appropriate forms for data
mining using different methods and strategies as well as software or computing tools. The
general process for data transformation can be broken down as follows:
• Data discovery: The first step of the process, when data are profiled with designed structures.
• Data mapping: The process of defining how individual fields are manipulated to the final output
• Code generation: The process of generating or producing executable code that transforms data into the desired format or output following thedesigned data mapping rules.
• Code executing: The process of executing the generated code on the data to get the desired output.
24
• Data review: The process of ensuring the output data meets the requirements.
In the process of data mining, data transformation methods and strategies vary depending on
business scenarios and the data characteristics that are being analyzed.
3.2.2 Data Discretization
Data discretization is an essential step if the input dataset variables involve numerical or
continuous format and the chosen learning schemes or algorithms can only deal with categorical
attributes. In the real world, many data mining or machine learning tasks come with the
continuous attributes. When working with categorical attributes, some induction algorithms
significantly increase the computing speed compared with continuous ones. In practice,
discretization can be viewed as a data reduction method, since it maps data from a huge spectrum
of numerical values to a greatly reduced subset of discrete values [55]. Continuous variable
discretization has received significant attention in the data mining and machine learning
community; for example, the Decision Tree C4.5 algorithm will discretize numerical variables
during the learning process. There are a variety of categories of discretization methods based on
their characteristics; these include static-dynamic, univariate-multivariate,
supervised-unsupervised, splitting-merging-hybrid, global-local, direct-incremental, and evaluation measure.
Analogous to supervised and unsupervised learning methods, the supervised-unsupervised data
discretization methods are the most widely adopted in the data mining process. Supervised
methods, such as error-based, entropy-based or statistics-based, consider the class values, while
the unsupervised methods, such as equal-width and equal-frequency based, only focus on the
25
discretization methods, there are still many cases in which unsupervised methods offer equal or
better performance. It is of vital importance to select the proper discretization methods based on
the chosen datasets and the learning algorithms.
3.2.3 Feature Selection
The feature selection process in data mining or machine learning is the process of selecting
subsets of relevant variables or features for the model building. Feature selection is one of the
most important processes in the data mining and machine learning workflow. With proper
methods, it could reduce the number of variables for building the model, remove irrelevant and
redundant data, clean the noise data, etc. In most cases, feature selection can significantly speed
up the computing time for data mining algorithms, improve the accuracy or performance of the
model and result in comprehensibility.
Normally there are three categories of feature selection methods: Filter-based, Wrapper-based
and Embedded-based ones. The Filter-based methods do feature selection and evaluation before
the data mining algorithms are applied and they are independent of the algorithms used in the
data mining. In most cases, the feature relevance scores are calculated, and those features with
low relevance scores and low correlation results are removed. Afterward, the features left will
build the subset of features for the final data mining algorithms. The advantage of Filter-based
feature selection is simple and fast, while the disadvantage side is that it ignores the interaction
with the data mining algorithms, which may lead to the worse performance of the data mining
26
The Wrapper-based feature selection approaches embed the data mining algorithms hypothesis
with the feature subset search. This method generates all the possible feature subsets and
evaluates them by putting them into the data mining algorithms and gets the classification results.
Then finally a tailored subset of the data mining algorithms is obtained considering the
evaluation of the results. The advantage of the Wrapper-based approach is the interaction
between selected feature subset and the classification model, which may lead to better
performance, while the drawback is the problem of overfitting and the high computational cost.
The Embedded-based method is the way embedding the search for feature subset into the
classifier construction. The advantage of Embedded-based is that it builds the interaction with
the classification models, while at the same time needs less computational cost than
Wrapper-based approach.
3.2.4 Imbalanced and Sparse Data
In many supervised learning applications, there is a significant difference between the prior
probabilities of different classes, i.e., between the probabilities with which an example belongs
to the different classes of the classification problem. This situation is known as the class
imbalance problem, and it is common in many real problems from telecommunications, web,
finance-world, ecology, biology, medicine not only, and which can be considered one of the top
problems in data mining today [57]. The problem with imbalanced data is that many standard
classification learning algorithms tend to generate biased results toward the majority class while
leading to higher misclassification for the minority class. For imbalanced datasets several
27
• Data sampling: It is the method of sampling the imbalanced data into balanced class distribution dataset as the input of the learning algorithms.
• Algorithmic modification: This procedure is oriented towards the adaptation of base learning methods to be more attuned to class imbalance issues.
• Cost-sensitive learning: This type of solution incorporates approaches at the data level, at the algorithmic level, or at both levels combined, considering higher costs for the
misclassification of examples of the positive class with respect to the negative class, and
therefore, trying to minimize higher cost errors [57].
In data science, sparse data are also named as sparse matrix or sparse array, meaning in the
matrix, most of the elements are zero, while on the other hand, if most of the elements are
nonzero, then the matrix can be considered as dense data. In many data mining and machine
learning cases especially those with high dimensional variables, the sparse datasets are often
applied with specialized algorithms and data structures, which will take advantage of the sparse
matrix structure.
3.2.5 Missing Values
Missing values are frequently indicated by out-of-range entries: perhaps a negative number (e.g.,
–1) in a numerical field that is normally only positive, or a 0 in a numerical field that can never normally be 0. For nominal attributes, missing values can be indicated by blanks or dashes [2].
There are a variety of reasons that cause missing values such as the fault of measure facilities, no
28
There are some approaches that could be applied to the data of missing values:
• Discard instances: It is the simple solution to discard the instances with missing values. This is the method appropriate for those cases that the missing values are completely at
random.
• To get the missing values: It is the method to obtain the missing values with extra costs such as from the third party.
• Imputation: It is the methods to make estimation or prediction of the missing values following their distribution or through designed models. Some well-known treatment
named Multiple Imputation has emerged to deal with the missing value problem with the
method of generating multiple simulated versions of data sets where each is analyzed,
and the results are combined to generate inference [58].
• Reduced-feature Models: It is an alternative approach to Imputation, which incorporates only attributes that are known for the test instance [58].
3.2.6 Normalization and Standardization
Both of normalization and standardization are referred as scaling the attribute values to fit in a
specific range. In most cases, they are important parts during the pre-processing stage of data
mining. Some measurements like Euclidean distance are sensitive to the variable difference in
the magnitudes of scales, so the methods of normalization and standardization are used to scale
down the magnitudes while keeping the equal weighting information of the variables. The most
29
normalization. The Min-Max method of normalization performs a linear alteration on the
original data which could be described as [74]:
𝑣𝑛𝑒𝑤= 𝑣 − 𝑀𝑖𝑛𝐴
𝑀𝑎𝑥𝐴− 𝑀𝑖𝑛𝐴(𝑁𝑒𝑤_𝑀𝑎𝑥𝐴 − 𝑁𝑒𝑤_𝑀𝑖𝑛𝐴) + 𝑁𝑒𝑤_𝑀𝑖𝑛𝐴
(1)
The value 𝑣 of an attribute A with range [𝑀𝑖𝑛𝐴, 𝑀𝑎𝑥𝐴 ] is mapped to a new range [𝑁𝑒𝑤_𝑀𝑖𝑛𝐴, 𝑁𝑒𝑤_𝑀𝑎𝑥𝐴]. The Z-Score or Standardization is the method to map data based on the mean and standard deviation. The formula is [74]:
𝑣𝑛𝑒𝑤 =
𝑣 − 𝑣̅ 𝜎
(2)
Here 𝑣̅ is the mean of the feature, and 𝜎 is the standard deviation of the feature.
The Decimal Scaling method just simply scales the data by moving the decimal point of the
value of the features needed to be normalized, which could be described as [74]:
𝑣𝑛𝑒𝑤 =
𝑣 10𝑗
(3)
where j is the smallest integer so that 𝑀𝑎𝑥(|𝑣𝑛𝑒𝑤|) < 1.
In the data mining process, which method of normalization and standardization to choose
depends on the characteristics of the datasets and the learning algorithms which will be applied.
Typically, normalization will reach the output range of values between 0 to 1, while
standardization is to measure how much the values deviate to the means with the assumption of
30
3.3 Data Mining Algorithms
3.3.1 Logistic Regression
Logistic regression is a mathematical modeling approach that can be used to measure the
relationship between the categorical dependent variable and one or more independent variables
by estimating probabilities using a logistic function [30]. Logistic Regression could be classified
with the outcome as binominal(binary), ordinal and multi-nominal logistic regression, and it is
used in various domains including machine learning, medical science, social science and more.
The logistic regression is based on the logistic function. In [30], the logistic model is detailed
described as:
𝑧 = 𝛼 + 𝛽1𝑋1+ 𝛽2𝑋2+ ⋯ 𝛽𝑘𝑋𝑘 (1)
𝑓(𝑧) = 1
1 + 𝑒−(𝛼+∑ 𝛽𝑖𝑋𝑖)
(2)
The linear regression model 𝑧 is the dependent variable, while the 𝑋1…𝑋𝑘 are independent variables. The 𝑓(𝑧) will get the probability of the output of 0~1, which could be denoted by the conditional probability statement:
𝑃(𝐷 = 1|𝑋1, 𝑋2, ⋯ 𝑋𝑘) (3)
31
𝑃(𝑋) > µ → ′1′ (5)
In this thesis, the prediction output is a binary variable and the binominal logistic regression
model is built as the main algorithm to evaluate computing resources cost.
3.3.2 Decision Tree and Random Forest
A decision tree is a decision support tool that uses a tree-like graph or model of decisions and
their possible consequences in business or computer programming. The branches of the tree
represent choices with associated risks, costs, results, possibilities, event outcomes, resource and
more. Based on the approach of top-down strategy and classification rules, the family of the
decision tree is constructed with the root of the tree and proceeding to the leaves through the
values of a set of attributes or properties. The decision tree is a very effective method of
supervised data learning method.
The algorithm ID3(Iterative Dichotomiser 3) is one of a series of programs developed from Concept Learning System CLS framework (Hunt, Marin and Stone, 1966) in response to a
challenging induction task posed by Donald Michie, viz. to decide from pattern-based features
alone whether a particular chess position in the King-Rook vs King-Knight endgame is lost for
the Knight's side in a fixed number of ply [34]. ID3 was designed where there are many
attributes and the training set contains many objects, but a reasonably good decision tree is
32
training set called the window is chosen at random and a decision tree is formed from it. This
tree correctly classifies all objects in the window. All other objects in the training set are then
classified using the tree. If the tree gives the correct answer for all these objects, then it is correct
for the entire training set and the process terminates. If not, a selection of the incorrectly
classified objects is added to the window and the process continues [34]. The ID3 algorithm
begins with the original set S as the root node. On each iteration of the algorithm, it iterates
through every unused attribute of the set S and calculates the entropy H(S) or information gain
IG(S) of that attribute. It then selects the attribute which has the smallest entropy (or largest
information gain) value. The set S is then split by the selected attribute to produce subsets of the data. The algorithm continues to recur on each subset and only selects those attributes never
selected before. The entropy H(S) is measured with the method as [76]:
𝐻(𝑆) = ∑ −𝑝(𝑥)
𝑥∈𝑋
log2𝑝(𝑥) (6)
S– the dataset to be calculated X – set of classes in S
p(x) – the portion of element class x in the dataset of S
The information gain IG(S) is measured with the method as [76]:
𝐼𝐺(𝐴, 𝑆) = 𝐻(𝑆) − ∑ 𝑝(𝑡)
𝑡∈𝑇
𝐻(𝑡) (7)
H(S)– the entropy of dataset S
T– the subsets created from splitting dataset S by attribute A p(t) – the portion of number of element t in the dataset of S
33
H(t)– the entropy of dataset t
The algorithm of C4.5 is an extension of the earlier ID3 algorithm [2]. It uses Information gain
as the splitting criterion, while it has some improvements over the classical algorithm ID3
including numerical values, pruning procedure and handling missing values and more. The
splitting criterion is based on the information value or entropy:
𝑒𝑛𝑡𝑟𝑜𝑝𝑦(𝑝1, 𝑝2, ⋯ 𝑝𝑛) = −𝑝1𝑙𝑜𝑔𝑝1− 𝑝2𝑙𝑜𝑔𝑝2⋯ − 𝑝𝑛𝑙𝑜𝑔𝑝𝑛 (8)
The multistage decision information value can be described as:
𝑒𝑛𝑡𝑟𝑜𝑝𝑦(𝑝, 𝑞, 𝑟) = 𝑒𝑛𝑡𝑟𝑜𝑝𝑦(𝑝, 𝑞 + 𝑟) + (𝑞 + 𝑟) × 𝑒𝑛𝑡𝑟𝑜𝑝𝑦( 𝑞 𝑞 + 𝑟 ,
𝑟 𝑞 + 𝑟 )
(9)
Random forest is a combination of tree predictors such that each tree depends on the values of a
random vector sampled independently and the same distribution for all trees in the forest. A
random forest is a classifier consisting of a collection of tree-structured classifiers {h(x, Ɵk ), k =
1, . . .} where the { Ɵk } are independent identically distributed random vectors and each tree
casts a unit vote for the most popular class at input x [35]. Random Forest algorithm was
developed as the extension of Bagging of Classification Tree and has been demonstrated to have
excellent performance compared to other machine learning algorithms. Bagging predictor is a
method for generating multiple versions of a predictor and using these to get an aggregated
34
does a plurality vote when predicting a class. The multiple versions are formed by making
bootstrap replicates of the learning set and using these as new learning sets [52].
3.3.3 Support Vector Machine
The original support vector machine SVM algorithm was invented by Vladimir N.
Vapnik and Alexey Ya. Chervonenkis in 1963 [78]. Then in 1992, a way to create non-linear
classifier by applying the kernel trick o maximum margin hyperplane was proposed by Bernhard
E. Boser, Isabelle M. Guyon and Vladimir N. Vapnik [77]. The SVM is a kernel-based
computing algorithm that assigns labels to cases based on the margin maximization hyperplane
principle by learning the characteristics of the examples. The instances that have the least
distances to the maximum margin hyperplane are called support vectors, while the set of support
vectors could uniquely define the maximum margin hyperplane for the learning problem [2].
With the example of two attributes case, a hyperplane separating the two classes could be
described as [2]:
𝑥 = 𝑤0+ 𝑤1𝑎1+ 𝑤2𝑎2 (8)
The two attributes are 𝑎1 and 𝑎2, while the three weights 𝑤0 , 𝑤1 and 𝑤2 need to be learned. In terms of support vectors, a 𝑦 with the class values of either 1 or -1 is designed to the maximum margin hyperplane concept as [2]:
𝑥 = 𝑏 + ∑ 𝑎𝑖𝑦𝑖
𝑖 𝑖𝑠 𝑠𝑢𝑝𝑜𝑟𝑡 𝑣𝑒𝑐𝑡𝑜𝑟
𝛼(𝑖) ∙ 𝛼 (9)
35
In equation (9) 𝑦𝑖 is the class value of the training instance 𝛼(𝑖), while 𝑏 and 𝑎𝑖 are numerical parameters that need to be generated by the learning algorithm. The term of 𝛼(𝑖) ∙ 𝛼 represents the dot product of the test instance with one of the support vectors: (𝑖) ∙ 𝛼 = ∑ 𝛼(𝑖)𝑗 𝑗𝛼𝑗 . Finally,
𝑏 and 𝑎𝑖 are parameters that determine the hyperplane [2]. Then it leads to the problem of finding the support vectors with the training sets and determine the parameter of 𝑏 and 𝑎𝑖, which is a typical optimization problem.
3.3.4 Clustering
Clustering is the task of grouping a set of objects in such a way that objects in the same group
(called a cluster) are more similar (in some sense or another) to each other than those in other
groups (clusters). It can be stated as follows: given a representation of n objects, find k groups
based on a measure of similarity such that the similarities between objects in the same group are
high while the similarities between objects in separate groups are low [43]. Clustering analysis
has the main task of exploratory data mining, and it is one of the common techniques for
statistical data analysis. As an unsupervised data mining method, clustering is used in many
fields, including machine learning, pattern recognition, image analysis, information retrieval,
bioinformatics, data compression, and computer graphics.
A variety of clustering models were employed by researchers with the concept of “a group of
data objects”, which led to different clustering algorithms based on these models. Some popular ones are Connectivity-based clustering (hierarchical clustering), Centroid-based clustering
36
clustering(DBSCAN), etc. Among all the algorithms, the most popular and simplest one is
k-means Clustering due to its ease of implementation, simplicity, efficiency, and empirical success in a variety of domains for more than 50 years.
The algorithm k-means Clustering could be described as follows. Let 𝑋 = {𝑥𝑖}, 𝑖 = 1, . . . 𝑛 be the set of n d-dimensional points to be clustered into a set of K clusters, 𝐶 = {𝑐𝑘 , 𝑘 = 1, . . . 𝐾}. The k-means algorithm finds a partition such that the squared error between the empirical mean of a cluster and the points in the cluster is minimized. Let 𝜇𝑘 be the mean of cluster 𝑐𝑘. The squared error between 𝜇𝑘 and the points in cluster 𝑐𝑘 is defined as [43]:
𝐽(𝑐𝑘) = ∑ ‖𝑥𝑖 − 𝜇𝑘‖
𝑥𝑖∈𝑐𝑘
(10)
The goal of k-means is to minimize the sum of the squared error over all K clusters,
𝐽(𝐶) = ∑ 𝐾 𝑘=1 ∑ ‖𝑥𝑖− 𝜇𝑘‖2 𝑥𝑖∈𝑐𝑘 (11)
Anil [43] described the main steps of k-means algorithm as follows:
1. Select an initial partition with K clusters; repeat steps 2 and 3 until cluster membership
stabilizes.
2. Generate a new partition by assigning each pattern to its closest cluster center.
37
Chapter 4. Big Data with Distributed Systems
The continuous increase of the volume and feature dimensions captured by organizations, such
as the rise of social media, Internet of Things (IoT), and multimedia, has produced an
overwhelming flow of data in either structured or unstructured format [53]. The rise of big data
brought tremendous opportunities and conveniences, on the other hand, some challenges came
with it including the scalability, data storage, analytics speed based on the computer architecture
and more. The traditional centralized data mining technologies in some cases are not appropriate
for the increasing new challenges. Then the distributed data mining environments and cloud
computing architectures offer better solutions for the need of faster and safer data mining
techniques. The distributed systems have the distributed computational units connected and
organized by network, which meets the requirement of large-scale and high-performance
computing. There are many kinds of distributed systems like Grids, Cloud Computing Systems,
P2P systems, and etc. The distributed systems made a significant improvement to data mining on
both scalability and performance. Apache Hadoop and Apache Spark are becoming the most
popular ones used across various domains.
4.1 Apache Hadoop
Apache Hadoop was first developed in 2003 based on the Apache Nutch project [79]. The
38
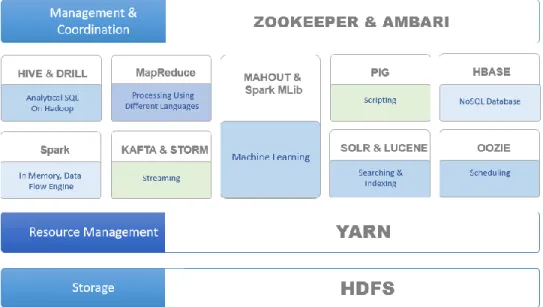
Hadoop is the open source software framework used for distributed storage and processing
of dataset of big data using the MapReduce computational paradigm. It is one of the most
well-established software platforms that support data-intensive distributed applications [54]. There are
four main parts of the framework: Hadoop Common, Hadoop Distributed File System(HDFS),
Hadoop YARN and Hadoop MapReduce. Based on this basic ecosystem, some other software
package or models were developed and installed such as Apache Pig, Apache Hive, Apache
HBase, Apache Spark, and etc. which built the whole Apache Hadoop Ecosystem shown in
Figure 2.
Figure 2 Apache Hadoop Ecosystem
The Hadoop Distributed File System(HDFS) was developed as a distributed and scalable file
system that stores large files across multiple machines. It links together the whole files on local
nodes building one single file system. HDFS has the features of scalable, fault-tolerant,
flexibility and reliability, which makes HDFS a fault-tolerant and self-healing distributed file