Modeling Projections in Microaggregation
Jordi Nin and Vicen¸c TorraIIIA, Artificial Intelligence Research Institute CSIC, Spanish National Research Council
Campus UAB s/n, 08193 Bellaterra,
Catalonia, Spain {jnin,vtorra}@iiia.csic.es
Abstract
Microaggregation is a method used by statistical agencies to limit the disclosure of sensitive microdata. It has been proven that microaggrega-tion is an NP-hard problem when more than one variable is microag-gregated at the same time. To solve this problem in a heuristic way, a few methods based on projections have been introduced in the litera-ture. The main drawback of such methods is that the projected axis is computed maximizing a statisti-cal property (e.g., the global vari-ance of the data), disregarding the fact that the aim of microaggrega-tion is to keep the disclosure risk as low as possible for all records. In this paper we present some pre-liminary results on the application of aggregation functions for comput-ing the projected axis. We show that, using the Sugeno integral to calculate the projected axis, we can reduce in some cases the disclosure risk of the protected data (when pro-jected microaggregation is used). Keywords: Microaggregation, Sugeno Integral, Statistical Disclo-sure Control.
1 Introduction
It is a common practice in all organizations to manage large volumes of confidential data. In many cases, data need to be transferred to third parties to be analyzed. In this case, privacy becomes an essential issue. Data has to be transferred but while statistics have to be preserved, confidential information has to be kept private. This is a typical problem, for instance, in national statistics offices.
Special efforts have been made to develop a wide range of protection methods [4]. These methods aim at guaranteeing an acceptable level of protection of the confidential data. Specific areas such as Privacy in Statistical Databases (PSD) tackle the problem of pro-tecting confidential data in order to publicly release it, without revealing confidential in-formation that could be linked to an specific individual or entity. Normally, Record linkage methods [15] are used to find these linkages. Recently, microaggregation has emerged as one of the most promising protection meth-ods. Microaggregation works as follows: given a data set with V variables, it builds small clusters of at least k elements and replaces the original values by the centroid of the clus-ter to which the element belongs. A certain level of privacy is ensured becausek elements have an identical protected value.
Microaggregation techniques can be classi-fied asunivariate microaggregation (when the number V of variables is 1) or multivari-ate microaggregation (when V > 1). In the case of univariate microaggregation, there
ex-ist polynomial-time methods to obtain an op-timal solution, for instance, the algorithm presented in [10] which works over a graph built from the sorted original data. On the other hand, optimal multivariate microaggre-gation was proved to be NP-hard [12]. Due to this, heuristic [5, 6] approaches have been pro-posed. In this paper, we focus on projected microaggregation, as in [5].
Projected microaggregation simplifies the multivariate microaggregation problem trans-lating it into the univariate case. To do this,
V variables are summarized / represented into a single value in a projected axis. Normally, this summarization is done using the Princi-pal Component Analysis or the sum of Zscores (both methods are described in detail later on). The aim of both methods is to establish an order among records to apply an optimal univariate microaggregation algorithm. In order to summarize several variables into a single value, aggregation functions [16] can be used. In this paper we propose replacing the use of projection methods in microaggre-gation by the use of methods based on ag-gregation functions. We will show that the trade-off between privacy and statistical util-ity achieved by microaggregation using the Sugeno integral [14] to summarize the vari-ables is equal, better in many cases, than the traditional projected microaggregation meth-ods.
The rest of the paper is organized as fol-lows. In Section 2, we explain some pre-liminary concepts about projections and pro-jected microaggregation. Then, in Section 3, we present our new approach to microaggre-gation, in Section 4 some preliminary results are described. Finally, Section 5 draws some conclusions and presents some future work. 2 Preliminaries
In this section, we explain some basic con-cepts about projections and their application to multivariate microaggregation. We also ex-plain the score, a well-known measure to an-alyze (evaluate) protection methods. In rela-tion to notarela-tion, we will assume in the rest of
this paper that the values of the V variables for thenindividuals (records) are stored in a matrix X of dimension n×v.
2.1 PCP Projection
Formally Principal Component Projection (PCP) works as follows: let us assume that values of v attributes for n individuals are stored in a matrixXof dimensionn×v, where columns contain attributes and rows contain individuals. For the sake of simplicity, we will assume here that data is standardized (i.e., the data has µ = 0 and σ = 1, and so the covariance matrix is S = 1/nXTX).
The first principal component is defined as the linear combination of the attributes which has the maximum variance. Therefore, this first principal component will be represented using a vector z1 =Xv1, for some vector v1 withv
components, to be found. Since the original values have µ = 0, we have that z1 also has
µ= 0, and its variance is 1 nz T 1z1= 1 nv T 1XTXv1 =v1TSv1 (1)
Since S is positive-definite, the variance in-creases when the module of the vectorv1does.
For this reason, to find a concrete solution for the maximization of the expression (1), some constraint on the module of v1 is needed. In
this case, the search is limited to vectors v1
with module 1 (i.e. vT
1v1 = 1). This is
equiv-alent to maximize the following expression, where a Lagrange multiplier has been added to the variance:
M =vTSv
1−λ(vT1v1−1) (2)
To maximize expression (2), the derivative with respect to the v1 components must be
made equal to 0.
∂M ∂v1
= 2Sv1−2λv1= 0 (3)
The solution for such equation is Sv1 =λv1,
which implies that v1 is an eigenvector of
eigenvalue. To determine which eigenvalue of S is the right solution, Equation (3) is left-multiplied with vT
1, leading to v1TSv1 =
λvT
1v1 =λ.
Summing up, λ is the variance of z1. Since
the goal is to maximize the variance, λis the largest eigenvalue of the matrixS, and its as-sociate eigenvector v1 defines the coefficients
of the projection (PCP). Therefore, the final projected value isP CP =Pv
i=1vixi.
The rationale of this process is to preserve, as maximum as possible, the total variance of the original variables in the projected one. 2.2 Zscores Projection
Given a record (x1, x2, . . . , xv) in X, the sum
of Zscores Projection is defined as
Z = v X i=1 xi−µi σi
whereµi is the average andσi is the variance
of thei-th variable, computed by taking into consideration all the records in X.
The rationale of this process is to sort the records taking into account the variance of all the variables.
2.3 Projected Microaggregation As we have explained in the introduction, the main problem for extending optimal univari-ate microaggregation to the multivariunivari-ate case is the sorting of multivariate data. One ap-proach is to reduce the dimensionality of the problem. That is, to move from the case of several variables into 1 variable, by applying the projection methods explained before. For-mally, the algorithms work as follows:
• Split the data set X intor sub-data sets {Xi}1≤i≤r, each one withvi of the V
at-tributes of thenrecords (Vishould define
a partition of the V; i.e.,Vi∩Vj =∅for
i6=j and ∪r
i=1Vi=V, and vi=|Vi|).
• For each sub-data setXi:
1. Apply a projection algorithm to the variables Vi in Xi, which results in
an univariate vector pi with n
com-ponents (one for each record). 2. Sort the components ofpiin
increas-ing order.
3. Apply to the sorted vector pi
the univariate optimal microaggre-gation.
4. For each cluster resulting from the previous step, compute the vi
-dimensional centroid and replace all the records in the cluster by the cen-troid.
Depending on the projection method, we will obtain different methods of multivariate mi-croaggregation. In this work we will usePCP microaggregation and Zscores microaggrega-tion.
2.4 Protection Methods Evaluation A protection method have to ensure a certain level of privacy (low disclosure risk). At the same time, since the goal is to allow third par-ties to perform reliable statistical computa-tions over the protected information, a protec-tion method must ensure that the protected data is still useful for statistical analysis (low information loss).
We thus have two inversely related values for the evaluation of a protection method: the
disclosure risk (DR), which is the risk that an intruder obtains correct relations between the protected and the original data; and the
information loss (IL) caused by the protection method. In the standard case, if one of these measures increases, the other one decreases.
Record linkage[15] has been used [3, 17] as a way to measure disclosure risk. Such meth-ods try to model the situation where an in-truder tries to link the protected data set with some records (original data) he/she has ob-tained from other sources. Of course, the more records that can be linked by means of record linkage methods, the more disclo-sure risk has the employed protection method. Some examples of record linkage methods are distance based and probabilistic record link-age.
Many approaches exist for computing infor-mation loss. We will use the measures defined in [3], where the authors calculate the average difference between some statistics computed on both the original and the protected micro-data.
There are different ways to evaluate the qual-ity of a data protection method, by taking into account these two values (DR and IL). We will use one of the most popular ones, the
score [3]. This measure has been used in many works [11, 17]. The score is a simple and natu-ral way to evaluate the trade-off between the information loss and the disclosure risk be-cause it is defined as the average of these two values. Namely, score = 0.5IL+ 0.5DR. We use the definitions of IL and DR provided in [3]:
• Information Loss (IL). The overall IL is computed as IL = 100 0.2IL1 +
0.2IL2 + 0.2IL3 + 0.2IL4 + 0.2IL5,
where
(i) IL1 is the mean absolute error of the
original microdataXwith respect to the protected dataX′.
(ii) IL2 is the mean variation of the
at-tribute average vectors.
(iii) IL3 is the mean variation of the
at-tribute covariance matrices.
(iv) IL4 is the mean variation of the
at-tribute variance vectors.
(v) IL5 is the mean variation of the
at-tribute correlation matrices.
• Disclosure Risk (DR). Three alterna-tives are considered for measuring the disclosure risk. They are the two vari-ations of record linkage explained before and the interval disclosure.
Half weight is given to record linkage and the remaining half weight is given to interval disclosure. For record link-age, the average of the two methods is computed. Formally, this corresponds to
DR= 0.25·DLD+ 0.25·P LD+ 0.5·ID, where
(i) DLD, the Distance based Linkage Disclosure risk, is the average per-centage of correctly linked records using distance based record link-age [13];
(ii) P LD, theProbabilistic Linkage Dis-closure risk, is the average percent-age of correctly linked records using probabilistic record linkage [9]; and (iii) ID, the Interval Disclosure risk, is
computed as the average percent-age of original values falling into an interval defined around the corre-sponding masked value. The inter-val is defined as a percentage, be-tween 1 per cent and 10 per cent, of the values.
These three values are normally com-puted over the number of attributes that the intruder is assumed to know. In this paper, as we are comparing differ-ent microaggregation methods, for the sake of simplicity, we assume that the intruder knows different groups of at-tributes, instead of different groups of variables. Specifically, we assume that the intruder knows from two groups to all.
3 Modeling Projections
In this section, we explain some basics about the Sugeno integral and the quantifier used in the experiments. We also explain in detail the modifications of the standard projected mi-croaggregation to include our modeling pro-jection method.
3.1 Sugeno Integral
Now, we review a few definitions that are needed latter on. We start with the defini-tion of the Sugeno integral [14] (see also [16]) in terms of a fuzzy quantifier.
Definition 1 A function Q: [0,1]→[0,1] is a regular monotonically non-decreasing fuzzy quantifier (non-decreasing fuzzy quantifiers for short) if it satisfies: (i) Q(0) = 0; (ii) Q(1) = 1; (iii) x > y implies Q(x)≥Q(y).
Figure 1: QuantifierQ(A) 0 0,1 0,2 0,3 0,4 0,5 0,6 0,7 0,8 0,9 1 1 2 3 4 5 6 7 8 9 10 Q(|A|/N) a
Definition 2 Let X:={x1, . . . , xN} be a set
of information sources, the Sugeno integral with respect to the measure µ(A) =Q(|A|/N)
for A⊆X is defined by:
SIQ(a1, . . . , aN) = N
max
i=1 min(Q(i/N), aσ(i))
where σ is a permutation such that aσ(i) ≥
aσ(i+1).
Figure 1 is a graphical representation of this integral with the quantifierQ(x) =x, the one used in the experiments.
3.2 Algorithm Description
As we have explained before, projected mi-croaggregation defines a sorting criterion over the multivariate data. Traditional projected microaggregation methods build a projected axis to establish an order among records. We will do that using aggregation functions in-stead of building a projected axis.
The rationale of the approach is as follows. Decision makers use aggregation functions to evaluate a large number of projects. In this case, different criteria or expert opinions are considered in the aggregation process. Then, the decision maker decides which is the best project to invest his money using the summa-rized value provided by the aggregation func-tion. In this kind of processes, decision maker are, in some way, sorting the projects using a summarized criteria / opinion. Following this idea, we propose to use aggregation functions over the records to be protected in order to compute a representative summarized value, and then, using such value, sort the records
in the data set. Naturally, at that time, opti-mal univariate microaggregation methods can be applied.
This new approach has many advantages with respect to the traditional projected approach. We underline the following ones.
• In projected methods, we need to com-pute some parameters. For instance, the sum of Zscores calculates the aver-age and the variance of all the variables, PCP needs to solve an optimization prob-lem. This is unnecessary using aggrega-tion funcaggrega-tions. Therefore, our new ap-proach save execution time.
• Projected methods are not parametriz-able. Using aggregation functions, one can define how data is sorted and, in some sense, protected.
• It is often the case that the projected val-ues returned by a projection method are difficult to understand. Using aggrega-tion funcaggrega-tions one is able to understand the final summarized value for a concrete record.
In detail, the projected microaggregation al-gorithm works as follows.
• Split the data set X intor sub-data sets {Xi}1≤i≤r, each one withvi attributes of
thenrecords and according to a partition {Vi}i of the variables V (as before).
• For each sub-data setXi:
1. Compute an aggregation function with the variables Vi in Xi, which
results in an univariate summarized vectorpiwithncomponents (one for
each record).
2. Sort the components ofpiin
increas-ing order.
3. Apply to the sorted vector pi
the univariate optimal microaggre-gation.
4. For each cluster resulting from the previous step, compute the vi
Figure 2: Graphical representation of the DR of (PCP, Zscores and Sugeno) microaggrega-tion using v= 4 and k= 5,15,25.
12 14 16 18 20 22 24 26 5 15 25 K DR
Mic4PCP Mic4Zscore Mic4Sugeno
the records in the cluster by the cen-troid.
Depending on the aggregation function used, we will obtain different methods of modeling projection microaggregation. In this work we use the Sugeno microaggregation.
4 Experiments
We have implemented the projected microag-gregation methods described in Section 2: PCP, Zscores and the new Sugeno-based ones. We have protected two different data sets with different instances of the three methods to compare them. These data sets were proposed in the CASC project [1] as the reference files to compare protection methods. The first mi-crodata file, called Census, was extracted us-ing the Data Extraction System (DES) from the U. S. Census Bureau [2]. The data set contains 1080 records with 13 attributes each (i.e., 14040 values to be protected). The sec-ond microdata file, called EIA, was extracted from the U.S. Energy Information Author-ity [8]. It contains 4092 records consisting of 10 attributes (i.e., 40920 values to be pro-tected).
Figures 2 and 3 present in a graphical way dis-closure risk (DR) and score for the microag-gregation of the Census data set with v = 4 (the most protected configuration). We can observe that the Sugeno microaggregation al-gorithm obtains always the lowest DR and the best scores for k= 15,25.
In Table 1 we present the scores as well as the unaggregated components. It can be seen
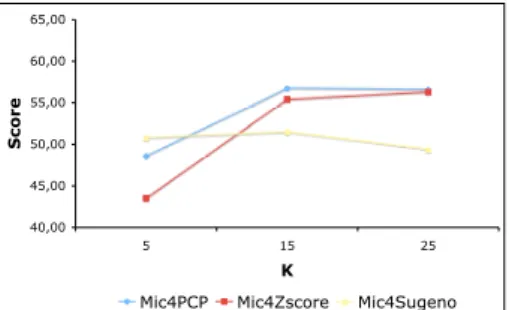
Figure 3: Graphical representation of the Scores of (PCP, Zscores and Sugeno) microag-gregation usingv= 4 and K= 5,15,25.
40,00 45,00 50,00 55,00 60,00 65,00 5 15 25 K S c o re
Mic4PCP Mic4Zscore Mic4Sugeno
that for some cases, Sugeno microaggregation leads to the lowest score (and the same for its components). E.g., the score obtained by the Sugeno microaggregation method is 49.39 in the Census data set with v = 4 and k = 25, while using PCP and Zscores microaggregation, the values are around 56. It is similar for the IL and DR components (IL, DLD, PLD and ID values). The val-ues for Sugeno microaggregation are 83.08, 0.60, 0.37 and 30.90, respectively better than for PCP and Zscores microaggregation (89.02, 4.40, 3.38 and 42.86 for Zscores microaggre-gation; 92.17, 2.92, 1.71, 39.72 and 39.72 for PCP microaggregation).
Another interesting result can be observed an-alyzing Table 1: our approach never obtains the worst results (neither score values nor its components) in any case. This fact indicates that the results of our new approach are more independent of the data set than projected microaggregation methods.
5 Conclusions and Future Work In this paper, we have presented a new family of microaggregation methods, which use ag-gregation functions as the sorting criteria. We have also shown that our method obtains bet-ter results than classical projected microag-gregation methods, when we use the score from [3] to compare them.
As future work, we plan to further study the application of other aggregation functions and quantifiers to microaggregation and to other protection methods.
Acknowledgements
Partial support by the Spanish MEC (projects ARES – CONSOLIDER INGENIO 2010 CSD2007-00004 – and eAEGIS – TSI2007-65406-C03-02) and by the Government of Catalonia (grant 2005-SGR-00093) is ac-knowledged. Jordi Nin wants to thank the Spanish Council for Scientific Research (CSIC) for his I3P grant.
References
[1] CASC: Computational Aspects of Statistical Confidentiality, Eu-ropean Project IST-2000-25069, http://neon.vb.cbs.nl/casc.
[2] Data Extraction System, U.S. Census Bureau, http://www.census.gov/
[3] Domingo-Ferrer, J., Torra, V., (2001), Disclosure control methods and informa-tion loss for microdata, 91-110 of [7]. [4] Domingo-Ferrer, J., Torra, V., (2001),
A quantitative comparison of disclosure control methods for microdata, 111-133 of [7].
[5] Domingo-Ferrer, J., Mateo-Sanz, J. M. (2002) Practical data-oriented microag-gregation for statistical disclosure con-trol, IEEE TKDE, 14 189-201.
[6] Domingo-Ferrer, J., Mart´ınez-Ballest´e, A., Mateo-Sanz, J.M., Seb´e, F. (2006) Efficient multivariate data-oriented mi-croaggregation, The VLDB Journal, 15, 355-369.
[7] Doyle, P., Lane, J., Theeuwes, J., Zayatz, L., eds. (2001), Confidentiality, disclo-sure, and data access: theory and prac-tical applications for statisprac-tical agencies, Elsevier Science.
[8] U.S. Energy Information Authority, http://www.eia.doe.gov/
[9] Jaro, M. A. (1989) Advances in Record Linkage Methodology as Applied to Matching the 1985 Census of Tampa,
Florida. Journal of the American Statis-tical Society, 84:406, 414-420.
[10] Hansen, S., Mukherjee, S. (2003) A Poly-nomial Algorithm for Optimal Univari-ate Microaggregation. IEEE TKDE, 15:4 1043-1044.
[11] Medrano, P., Pont, J., Nin, J., Munt´es, V., (2007), Ordered Data Set Vectoriza-tion for Linear Regression on Data Pri-vacy, LNAI, Springer, 4617, 361-372. [12] Oganian, A., Domingo-Ferrer, J. (2000)
On the Complexity of Optimal Microag-gregation for Statistical Disclosure Con-trol, Statistical Journal of UNECE, 18, 4, 345-354.
[13] Pagliuca, D., Seri, G., (1999), Some re-sults of individual ranking method on the system of enterprise accounts annual sur-vey, Esprit SDC Project, MI-3/D2. [14] Sugeno, M., (1974), Theory of fuzzy
in-tegrals and its application, Thesis, Tokyo Institute of Technology.
[15] Torra, V., Domingo-Ferrer, J., (2003), Record linkage methods for multi-database data mining, Information Fu-sion in Data Mining, Springer, 101-132. [16] Torra, V., Narukawa, Y. (2007) Modeling
decisions: Information Fusion and Aggre-gation Operators, Springer.
[17] Yancey, W., Winkler, W., Creecy, R., (2002), Disclosure risk assessment in per-turbative microdata protection, LNCS, Springer, 2316, 135-152.
EIA data set Census data set
Method IL DLD PLD ID Score IL DLD PLD ID Score
Mic2PCP05 13.90 2.94 6.91 70.04 25.69 80.96 12.93 5.70 42.60 53.46 Mic2PCP15 17.24 1.72 2.37 67.67 26.05 92.94 8.46 2.94 35.64 56.81 Mic2PCP25 19.98 1.42 1.58 67.21 27.17 84.77 6.61 1.94 32.93 51.69 Mic2Zscores05 4.27 25.36 36.08 89.26 32.13 81.57 16.78 7.85 48.27 55.93 Mic2Zscores15 5.08 21.92 34.37 87.85 31.54 98.05 12.96 6.19 44.33 62.50 Mic2Zscores25 5.52 21.05 35.06 87.33 31.61 100.92 12.85 4.83 42.90 63.40 Mic2Sugeno05 5.25 17.79 23.90 86.65 29.50 73.44 9.63 6.00 40.75 48.86 Mic2Sugeno15 6.24 14.14 19.11 85.08 28.55 79.39 4.85 4.63 34.02 49.39 Mic2Sugeno25 6.49 12.81 18.29 84.51 28.26 73.43 3.72 4.76 32.96 46.02 Mic3PCP05 16.08 2.47 2.69 62.79 24.38 57.72 10.15 5.71 43.48 41.71 Mic3PCP15 17.76 1.49 1.21 59.41 24.07 71.28 4.35 3.49 37.36 45.96 Mic3PCP25 18.49 1.31 0.90 58.49 24.14 72.49 4.07 2.65 35.51 45.96 Mic3Zscores05 13.24 6.40 9.26 72.31 26.66 60.98 14.44 13.67 50.63 46.66 Mic3Zscores15 15.30 3.79 5.50 69.35 26.15 75.21 9.38 10.46 45.71 51.51 Mic3Zscores25 15.73 3.21 5.02 68.65 26.06 79.38 7.47 9.04 44.20 52.80 Mic3Sugeno05 17.22 3.78 6.89 65.52 26.32 83.93 7.47 7.25 44.50 54.93 Mic3Sugeno15 21.31 1.74 3.21 61.22 26.58 122.52 3.55 5.52 39.47 72.26 Mic3Sugeno25 20.08 1.47 2.65 60.83 25.76 129.37 3.30 4.57 39.08 75.44 Mic4PCP05 18.25 4.23 4.81 73.22 28.56 72.23 6.48 3.06 45.12 48.59 Mic4PCP15 16.39 1.96 2.13 70.48 26.33 91.74 3.43 2.04 40.73 56.74 Mic4PCP25 17.27 1.93 1.91 69.66 26.53 92.17 2.92 1.71 39.72 56.59 Mic4Zscores05 13.91 5.21 8.50 78.73 28.35 62.04 11.71 7.04 40.50 43.49 Mic4Zscores15 21.79 2.71 4.40 77.41 31.14 86.47 5.60 4.21 43.77 55.40 Mic4Zscores25 21.66 2.35 3.89 76.76 30.80 89.20 4.40 3.38 42.86 56.29 Mic4Sugeno05 28.78 2.20 3.30 73.48 33.45 82.43 3.15 0.51 36.51 50.80 Mic4Sugeno15 35.97 0.71 1.03 70.86 35.92 86.64 0.83 0.28 32.19 51.51 Mic4Sugeno25 45.27 0.42 0.71 70.31 40.35 83.08 0.60 0.37 30.90 49.39 Table 1: Score of different microaggregation methods and parameterizations. Micivarj corre-sponds to microaggregation using variation var (either PCP, Zscores of Sugeno) with v=iand