Personal Cloud Storage
Benchmarks and Comparison
Enrico Bocchi, Idilio Drago, Marco Mellia
Abstract—The large amount of space offered by personal cloud storage services (e.g., Dropbox and OneDrive), together with the possibility of synchronizing devices seamlessly, keep attracting customers to the cloud. Despite the high public interest, little information about system design and actual implications on performance is available when selecting a cloud storage service. Systematic benchmarks to assist in comparing services and understanding the effects of design choices are still lacking. This paper proposes a methodology to understand and bench-mark personal cloud storage services. Our methodology unveils their architecture and capabilities. Moreover, by means of re-peatable and customizable tests, it allows the measurement of performance metrics under different workloads. The effectiveness of the methodology is shown in a case study in which 11 services are compared under the same conditions. Our case study reveals interesting differences in design choices. Their implications are assessed in a series of benchmarks. Results show no clear winner, with all services having potential for improving performance. In some scenarios, the synchronization of the same files can take 20 times longer. In other cases, we observe a wastage of twice as much network capacity, questioning the design of some services. Our methodology and results are thus useful both as benchmarks and as guidelines for system design.
Index Terms—Cloud Storage; Measurements; Performance
I. INTRODUCTION
Personal cloud storage services are data-intensive applica-tions on the Internet [1] that allow users to synchronize files with servers in the cloud and among different devices. They are also a popular means for distributed and collaborative work, with files being automatically shared and synchronized among users, thus posing additional near real-time constraints. More and more people are attracted by these services, saving personal files, synchronizing devices and sharing content with great simplicity. The high public success has pushed dozens of providers to the cloud storage market. New players have to compete against established ones, such as Dropbox and Box, as well as against giants like Apple, Google and Microsoft, which offer large amount of storage space for cheaper and cheaper prices [2]. While the high competition for customers continues to decrease the cost per GB [3], other important aspects, such as synchronization performance and Quality of Experience (QoE), are mostly unknown given the proprietary design of most services. As such, selecting the service that suits the specific needs of a user has become a non-trivial task. In competing for customers in the crowded market, it is to be expected that performance and QoE will be as important as price to attract customers in a near future.
The authors are with Politecnico di Torino, Italy (email: [email protected]). This research has been funded by the European Union under the FP7 Grant n. 318627 (Integrated Project “mPlane”).
Both users migrating files to the cloud and new providers that need to compete with the big players would greatly benefit from knowing how different design choices impact cloud storage performance. However, despite the high public interest, little work [4], [5], [6] has been done to compare cloud storage design and performance. In particular, a systematic methodology as well as public benchmarks that could assist in understanding the effects of design choices are still lacking. This paper proposes a methodology to study personal cloud storage services. We build upon our previous work [7], and design a benchmarking environment that allows to run realistic and repeatable tests. Our methodology helps to unveil cloud storage architectures, generate realistic workloads, and observe performance metrics under different scenarios and over time. The effectiveness of the methodology is verified in a case study involving 11 services, including 9 popular personal cloud storage providers, and 2 private cloud installations. Overall, we present results covering more than 3 months of measurements. Our case study targets two major goals. Firstly, it sheds light on how providers tackle the problem of synchronizing people’s files, revealing differences on client software, capa-bilities, synchronization protocols and data center placement policies. Secondly, we evaluate how such choices impact end user performance. To this end, we perform a large series of experiments using different workloads. Taking the perspective of customers connected from a single location in Europe, we contrast the measured performance against the characteristics of each service, thus highlighting the consequences of several design choices for both users and the Internet. Our contribu-tions can be summarized as follows:
•We introduce a methodology (Sect. II) that helps to deter-mine client capabilities and data center locations as well as to benchmark cloud storage. Workloads are generated at run-time and performance metrics are obtained without instrumenting proprietary clients;
• We document how different providers implement cloud
storage services, focusing on client capabilities (Sect. III) and system design (Sect. IV);
• We highlight how design choices affect performance by
means of a series of benchmarks (Sect. V). Major findings of this case study are summarized in the following.
To the best of our knowledge, we are the first to introduce a methodology to characterize and understand implications of personal cloud storage design. This paper extends our prelimi-nary work presented in [7]. We complement our methodology to cover the complete synchronization cycle, where a client first uploads content to the cloud, which is then spread to
other devices and users. We extend the evaluation to cover 11 services, including two private installations. Long-term measurements are presented and discussed. We contrast a vast range of design choices under new perspectives and highlight their implications to both users and the network.
A. Major Findings and Implications
The application of our methodology in a case study leads to lessons to the design of cloud storage services:
• We notice aggressive choices regarding the design of
control protocols to notify users about updates and to carry modifications to storage servers. Such choices lead to band-width wastage that might be significant for both busy servers and users in limited capacity scenarios.
• When comparing different services, there is no clear
winner: performance depends on the workload (e.g., few large files versus lots of small files), distance to data centers and implemented capabilities.
• A lightweight client that reacts fast to changes is key to good performance with small and medium workloads – e.g., in collaborative editing scenarios. Indeed, we find that several services waste more than 50% of the time being idle before processing our workloads.
• Advanced clients are essential when complex workloads
are manipulated. The advantages of having a small distance to data centers – e.g., local deployments or worldwide data centers – are canceled if simplistic clients are used.
While some measurements we present might change based on the test location, we pinpoint general facts that are indepen-dent from it. Our methodology is an important step towards the definition of open and flexible ways to benchmark cloud storage. It can help end users to compare alternatives and take informed decisions considering QoE metrics. Our methodol-ogy can also help engineers and researchers to develop new cloud storage services taking resource utilization into account. To this end, we offer the developed tools as a contribution to the community, aiming to foster further investigations on cloud storage design and performance.1
II. METHODOLOGY
This section describes our methodology to study cloud storage services. The methodology is developed around a testbed that allows us to run specific benchmarks. First, we aim at (i) testing client capabilities, and (ii) highlighting protocol design choices and data center placement decisions. Then, the testbed is used to measure the implications of those two aspects on performance under different workloads.
A. Goals
In the design of our methodology, we follow the traditional
black-boxtesting approach. We consider an
application-under-test that is run in a controlled environment, where we can
impose an input sequence while recording the external behav-ior of the system. We instrument a testbed in which one or
1Available at http://www.simpleweb.org/wiki/Cloud benchmarks
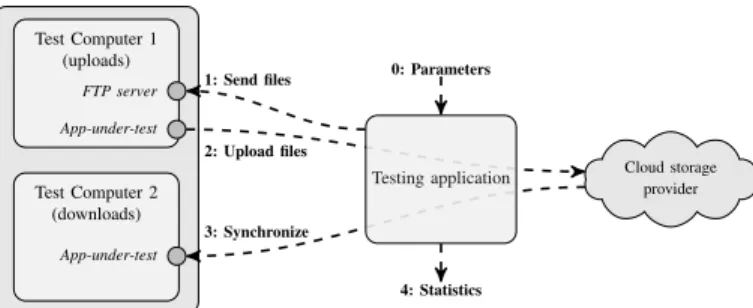
Cloud storage provider Test Computer 1 (uploads) Test Computer 2 (downloads) FTP server App-under-test App-under-test 2: Upload files 3: Synchronize Testing application 0: Parameters 1: Send files 4: Statistics
Fig. 1: Testbed and workflow of the benchmarks.
moretest computersrun the desired application-under-test. A
testing application generates a pre-defined workload, i.e., it
creates specific file(s) that the cloud storage service should synchronize among the test computers. At the same time, the testbed passively collects the traffic exchanged in the network to obtain a trace of the execution.
We assume to have control neither on the application-under-test nor on the network. We want application-under-tests to be repeatable and automatically performed, both to save time and to obtain average estimations. Moreover, since we target the comparison of tens of different services, we need the whole testing methodology to be able to run without constant supervision, post-processing and analyzing recorded traces automatically. B. Testbed and Tools
Fig. 1 depicts our testbed. Its core component is the testing application that orchestrates experiments and records network traffic. Two or more test computers run the application-under-test. For simplicity, we consider only two test computers here, although our methodology is generic and supports multiple clients as well. Our testing application receives benchmark-ing parameters describbenchmark-ing the sequence of operations to be performed (step 0 in Fig. 1). Then, the testing application
acts remotely on Test Computer 1 (step 1) by means of a
FTP server, generating workloads in the form of file batches. Once the application-under-test detects that files have changed, it starts to synchronize them to the cloud (step 2). The
application-under-test running on Test Computer 2 detects
modifications and downloads the new content (step 3). Ex-changed traffic is recorded during all steps and processed to compute performance metrics (step 4).
We setup the testbed using a single Linux server. The server controls the experiments by running the testing application,
and hosts two virtual machines2 that run the test
comput-ers (Windows 7 Enterprise). Both test computcomput-ers have their network interfaces connected to a virtual network, while the Linux server is instrumented to act as a router and provide Internet connectivity to the virtual network. This setup allows the server to easily observe traffic exchanged with the test computers. The Linux server is connected via a 1 Gbps Ethernet card to the Politecnico di Torino campus network, in which Internet connectivity is offered by a 10 Gbps link.
2We tested also physical machines without noticing any difference in results. However, care must be taken in calibrating the virtual environment – e.g., to avoid network shaping parameters, dimensioning the host server etc.
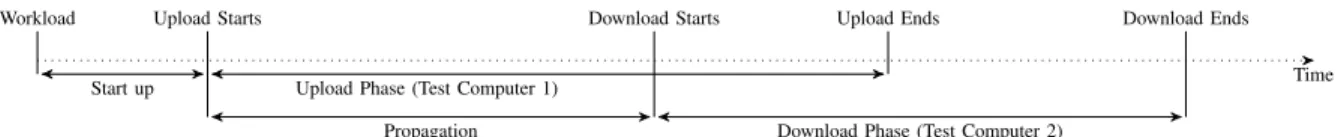
Workload Upload Starts Download Starts Upload Ends Download Ends Time
Start up Upload Phase (Test Computer 1)
Propagation Download Phase (Test Computer 2)
Fig. 2: Typical synchronization cycle in a personal cloud storage service.
C. Client Capabilities and Storage Protocols
We first study protocols used to communicate with the cloud. A manual inspection on packet traces reveals that most cloud storage services adopt HTTPS – i.e., they encrypt payload. Only in few cases, some control information is ex-changed by means of non-encrypted protocols such as HTTP. This is commendable given the privacy issues that could arise from transporting user files without encryption. However, the adoption of encrypted protocols complicates the understanding of the operations performed by the application-under-test.
Next, we aim at understanding whether services implement any advanced capabilities to manipulate files on the cloud. In particular, previous work [1] showed that storage services can implement client capabilities to optimize network usage and speed up transfers. These capabilities include (i)chunking – i.e., splitting large files into a maximum size data unit;
(ii)bundling– i.e., the transmission of multiple small files as a
single object; (iii)deduplication– i.e., avoiding re-transmitting content already available on servers; (iv)delta encoding– i.e., transmitting only modified portions of files; (v) compression – i.e., compressing files before transmission; and (vi) P2P
synchronization – i.e., exchange files among devices without
involving storage servers.
For each case, a test has been designed to observe if the given capability is implemented. We describe these tests in Sect. III. Intuitively, our testing application generates specific file batches that would benefit from the availability of a capability. The exchanged traffic is analyzed to observe if these benefits are present. Finally, we note that these experiments only need to be executed when a new client version of a cloud storage service is released.
D. Data Center Locations
The data center locations and data center ownership are im-portant aspects of cloud storage services, having both legal and performance implications. To identify how services operate, we leverage the IP address and hostname of servers contacted by an application-under-test when (i) it is started; (ii) files are manipulated; and (iii) it is in idle state.
In cloud services, different IP addresses can be returned when querying the DNS. Load-balancing techniques are often in place to split the workload based on the client location [8]. Following an approach similar to [9], we resolve all hostnames using more than 2,000 open DNS resolvers spread around the world. The list of resolvers has been manually compiled from various sources and covers more than 100 countries and 500 ISPs. This methodology allows us to create a list of server IP addresses used by a cloud storage provider.
Once the list of IP addresses is obtained, we use thewhois service to verify their ownership, i.e., the name of the company
owning the IP addresses. Next, we look for the geographic location of servers. Since popular geolocation databases have serious limitations regarding cloud providers [10], we rely on a hybrid methodology that makes use of (i) informative strings (i.e., International Airport Codes) revealed in the hostname or by reverse DNS lookups; (ii) the shortest RTT (Round Trip
Time) to PlanetLab nodes [11]; and (iii) activetraceroute
to spot the closest well-known location of a router. Previous work [8], [12] indicates that these methods provide an esti-mation with about a hundred of kilometers of precision. Since we aim at a coarse reference of the location from where cloud providers operate (e.g., at country level), this estimation is sufficient for our goals.
E. Benchmarking Performance
After knowing design choices of services, we use our testbed to check their influence on performance. We engineer a methodology to calculate metrics related to typical phases of the synchronization cycle as depicted in Fig. 2.
A workload is generated by the testing application based on a benchmark definition. A variable number of files with different content and size is created and manipulated, e.g., text files composed of random words from a dictionary, images with random pixels or random binary files. In addition, a percentage of file replicas can be specified to test how the service reacts when synchronizing repetitive content.
Performance metrics are calculated. Fig. 2 depicts the typical steps while synchronizing a file batch. We calculate: (i) The duration of the silent period before Test Computer 1 reacts to a new workload (i.e., start up); (ii) the duration and the amount of traffic while Test Computer 1 uploads files; (iii) the delay between the start of the upload and the download (i.e., propagation time); and (iv) the duration and the amount of traffic while files are downloaded from Test Computer 2.
Each phase is marked with a timestamp identified from network events based on the (previously learned) behavior of each application-under-test. Since most cloud storage services are proprietary and use encrypted protocols, determining such events from network traces is challenging. We learn the typical behavior of each service by means of controlled experiments and manual inspection, following a typical trial-and-check pro-cess. Once significant events are identified and validated, they are coded in (application-specific) post-processing scripts.3We refrain from providing implementation details for the sake of brevity and refer interested readers to our tool set for more information on how we post-process the traces.
3Determining such events automatically would require algorithms to learn the typical behavior of services.
TABLE I: Considered cloud storage services. The list includes 11 services, among which 2 are run privately.
Service Version
Public
Box 4.0.5101
Cloud Drive (Amazon) 2.4.2013.3290 Copy (Barracuda) 1.45.0363 Dropbox 2.8.4 Google Drive 1.16.7009.9618 hubiC (OVH.com) 1.2.4.79 Mega 1.0.5 OneDrive (Microsoft) 17.3.1166.0618 Wuala (LaCie) Olympus
Private Horizon (VMware)ownCloud 1.5.0-122112121.5.2
F. Storage Services Under Test
Compared to [7], we extend the list of services under study to 11, all being the latest version at the time of writing. We restrict our analysis to native clients, since this is the largely preferred means to use cloud storage services [1].
Tab. I lists the considered services. These include (i) popular players (e.g., Dropbox, Google Drive, Microsoft OneDrive, Amazon Cloud Drive); (ii) services with a strong presence in Europe, whose data centers are close to our testbed loca-tion (e.g., hubiC, Wuala and Mega); and (iii) private cloud services that are run in our institution (i.e., ownCloud and Horizon). Such variety allows us to compare the impact of multiple protocol design choices, client capabilities and data center placement policies on cloud storage performance. We only consider services offering free storage space, and those operating in a cloud infrastructure. Therefore, services such as SugarSync and BitTorrent Sync are not evaluated.
Finally, we note that Wuala is the only service that claims to encrypt files on the local computer before transferring them to the cloud. This can have extra processing costs and impair performances, as we will check in coming sections.
III. CAPABILITIES
We first evaluate which capabilities are implemented by different services. Findings are then summarized in Tab. II. A. Bundling
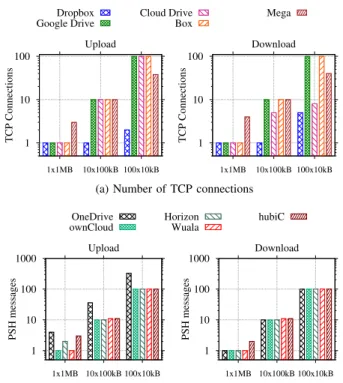
When a batch of files is transferred, files could be bundled, so that transmission latency and control overhead are reduced. Our experiment to check how services handle batches of files consists of 3 file sets of 1 MB: (i) 1 file of 1 MB; (ii) 10 files of 100 kB; and (iii) 100 files of 10 kB. We then estimate the number of upload and download operations.
These experiments reveal three design trends. Results are in Fig. 3, in which different plots are shown for uploads and downloads.4 A first group of services (Box, Cloud Drive,
Google Drive and Mega) opens several TCP connections when submitting multiple files. Notice in Fig. 3a how the number of TCP connections opened by Box and Google Drive is exactly the same as the number of files. Compare to Dropbox, which instead uses only few TCP connections to transfer multiple files. The first is a strong indication that the service 4Some services are omitted from plots in this section to help visualization.
1 10 100 1x1MB 10x100kB 100x10kB TCP Connections Upload Dropbox Google Drive Cloud Drive Box Mega 1 10 100 1x1MB 10x100kB 100x10kB TCP Connections Download
(a) Number of TCP connections
1 10 100 1000 1x1MB 10x100kB 100x10kB PSH messages Upload OneDrive ownCloud Horizon Wuala hubiC 1 10 100 1000 1x1MB 10x100kB 100x10kB PSH messages Download
(b) Number ofPSH-delimited messages
Fig. 3: Bundling capability. Note the logarithmy-axes.
is managing each file in a separate transaction. Notice that when several connections are used, the traffic overhead can be significant, owing to TCP and TLS/SSL negotiations.
Mega and Cloud Drive sometimes group files into fewer TCP connections (see download plot). This is also the case for other services – i.e., Copy, Horizon, hubiC, OneDrive, ownCloud and Wuala. However, they submit files in separate transactions. Fig. 3b illustrates this design, which can be in-ferred from the bursts of packets delimited by TCP segments in which the application-under-test sets thePSHflag – hereafter
called PSH-delimited messages. Notice how the number of
PSH-delimited messages is proportional to the number of files in each file set. This suggests that each file is transferred as a separate entity, and no bundle is created. Timestamps
of TCP PSH-delimited messages indicate that transactions
are serialized in most cases, although some services (e.g., OneDrive) try to overcome this limitation by using concurrent transfers. Sect. V will show that services lacking bundling and performing transactions sequentially suffer performance penalties when the RTT is large and several small files have to be exchanged.
Finally, among the 11 tested services, only Dropbox is confirmed to implement a file-bundling strategy [1].
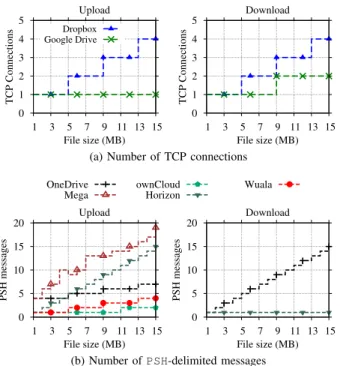
B. Chunking
Large files can be either monolithically transmitted to the cloud or chunked into smaller pieces. Chunking is advanta-geous because it simplifies recovery in case of failures: Partial submission becomes easier to be implemented, benefiting both users connected to slow networks, and those having operations interrupted by temporary network disconnections.
0 1 2 3 4 5 1 3 5 7 9 11 13 15 TCP Connections File size (MB) Upload Dropbox Google Drive 0 1 2 3 4 5 1 3 5 7 9 11 13 15 TCP Connections File size (MB) Download
(a) Number of TCP connections
0 5 10 15 20 1 3 5 7 9 11 13 15 PSH messages File size (MB) Upload OneDrive Mega ownCloud Horizon Wuala 0 5 10 15 20 1 3 5 7 9 11 13 15 PSH messages File size (MB) Download
(b) Number ofPSH-delimited messages
Fig. 4: Chunking capability.
As in the previous experiment, by monitoring the number
of TCP connections and PSH-delimited messages during the
synchronization of files of known size, we determine whether chunks are created and transmitted in different transactions.
Our methodology reveals a variety of chunking strategies, some of which are illustrated in Fig. 4. Top plots (Fig. 4a) show that Dropbox and Google Drive implement chunking and rely on different TCP connections to submit individual chunks. In fact, Google Drive uses 8 MB chunks, while Dropbox uses 4 MB chunks – notice the changes in the number of TCP connections as file sizes pass multiples of those quantities. Surprisingly, Google Drive relies on chunking only for downloading content.
A second group of services reuses TCP connections, but the number ofPSH-delimited messages allows us to conclude that files are also split into chunks. Fig. 4b suggests that ownCloud chunks content at 10 MB boundaries when uploading, Copy uses 5 MB chunks, OneDrive and Wuala use 4 MB chunks, and Mega chunks at less than 1 MB. Looking at the Fig. 4b bottom-right plot (download), we observe that OneDrive and Horizon use different policies for each direction. Horizon, for instance, uses chunks smaller than 1 MB only when uploading, but no chunking when downloading. Finally, remaining ser-vices do not seem to implement chunking, since no difference is noticed when file sizes are varied (not shown in Fig. 4). C. Compression
We next verify whether data is compressed before a transfer. Compression could, in general, reduce traffic and storage requirements at the expense of local processing time. We check the compression capability by contrasting the number of Bytes observed in the network with the original bench-mark size when submitting highly compressible text files –
0.0 0.2 0.4 0.6 0.8 1.0 0.1 0.4 0.7 1.0 Upload (MB) File size (MB) Dropbox Google Drive OneDrive Cloud Drive Box Copy Mega ownCloud Horizon Wuala hubiC 0.0 0.2 0.4 0.6 0.8 1.0 0.1 0.4 0.7 1.0 Download (MB) File size (MB)
Fig. 5: Bytes exchanged during the test with compressible files.
sizes from 100 kB to 1 MB. Fig. 5 reveals that Dropbox and Google Drive compress data before transmission, with the latter implementing a more efficient scheme – i.e., less network traffic is measured when compared to the original file size. ownCloud compresses content only when downloading, whereas all remaining services send files as they are created. Naturally, compression is advantageous only for some file types. It has a negligible or negative impact when already com-pressed files are going to be transmitted. A possible approach would be to verify the file format before trying to compress it – e.g., by checking file extensions or by looking formagic
numbersin file headers. We check whether ownCloud, Google
Drive and Dropbox implement smart policies by creating fake JPEG files – i.e., files with JPEG extension and JPEG headers, but actually filled with text that can be compressed. Results reveal that Google Drive and ownCloud identify JPEG content and avoid compression. Dropbox instead compresses all files independently of content and extensions. Hence, in case of true JPEG files, resources are wasted.
D. Client-Side Deduplication
Server data deduplication eliminates replicas on the storage server. Client-side deduplication instead extends the benefits to clients and the network: In case a file is already present on servers, replicas in the client can be identified to save upload capacity. This can be accomplished by calculating a file digest using the file content (e.g., SHA256 is used by Dropbox [13]). The digest is sent to servers prior to submitting the complete file. Servers then check whether the digest is already stored in the system and skip the upload of repeated content.
To check whether client-side deduplication is implemented, we design the following experiment: (i) A file with random content is created in an arbitrary folder – since this is the first copy of the file, the full content must be transferred in the network; (ii) the same random content is used to create a replica with a different name in a second folder – assuming hashes are used to identify replicas, only meta-data should be transferred, and not the complete file again; (iii) the original file is copied to a third folder – this step tests whether file names or any other information besides content hashes are checked to identify replicas in different folders; (iv) after all copies are deleted, the file is placed back to its original folder – this step determines whether deduplication still works after all copies of a file are deleted from local folders.
0.0 0.2 0.4 0.6 0.8 1.0 0.1 0.4 0.7 1.0 Upload (MB) File size (MB) Dropbox Google Drive OneDrive Cloud Drive Box Copy Mega ownCloud Horizon Wuala hubiC 0.0 0.2 0.4 0.6 0.8 1.0 0.1 0.4 0.7 1.0 Download (MB) File size (MB)
(a) Append content
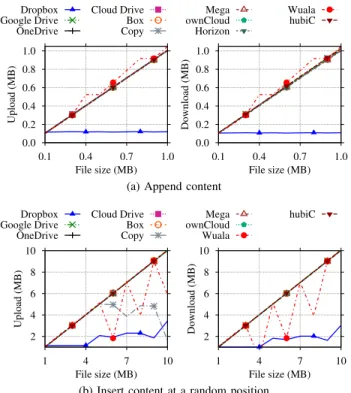
2 4 6 8 10 1 4 7 10 Upload (MB) File size (MB) Dropbox Google Drive OneDrive Cloud Drive Box Copy Mega ownCloud Wuala hubiC 2 4 6 8 10 1 4 7 10 Download (MB) File size (MB)
(b) Insert content at a random position
Fig. 6: Delta encoding tests. Note the differences inx-axes.
Results show three clear design choices. A first group of services (Box, Cloud Drive, Google Drive, hubiC, OneDrive and ownCloud) ignores deduplication opportunities and always submit the content, even if files are available at both the client and the server side. In contrast, a second group of services (Copy, Dropbox and Wuala) implements deduplica-tion. Services in this group identify copies even after they are deleted and later restored. This avoids re-uploading the files in case they are restored in the local folder. In the case of Wuala, deduplication is compatible with local encryption – i.e., two identical files generate two identical encrypted versions. Finally, Mega and Horizon partially implement deduplication. Horizon keeps deleted files in a “trash bin” and restores files from it in step 4 of our experiment. Mega, in turn, identifies replicas only when they are added in a single batch.
It is also interesting to note that Dropbox used to implement inter-user deduplication. This technique allows a user to skip submitting files that are already stored by any other user. How-ever, this scheme has been shown to leak information about content stored in the service [13]. By manually performing experiments with different users, we conclude that none of the services implement inter-user deduplication anymore. E. Delta Encoding
Delta encoding calculates the difference among file revi-sions, allowing the transmission of only the modified por-tions. Indeed, delta encoding provides similar benefits as the combination of chunking and deduplication, but with a finer granularity. It may have a positive impact on performance when files are frequently changed – e.g., when people perform collaborative/iterative work. On the other hand, the storage of static content is not affected by this feature.
To verify which services deploy delta encoding, a sequence of changes is generated on a file such that only a portion of content differs between iterations. Three cases are considered: New data added (i) at the end; (ii) at the beginning; or (iii) at a random position within the file. This allows us to check whether any rolling hash mechanisms [14] are implemented. In all cases, the modified file replaces its old copy.
Fig. 6a shows the number of Bytes uploaded at each step of the experiment when data are appended to the file. File sizes have been chosen up to 1 MB, and 100 kB are appended at each iteration. We see that only Dropbox implements delta encoding – e.g., the volume of uploaded data in Fig. 6a corresponds to the actual part that has been modified.
Side effects ofchunking, however, might increase the sent traffic in certain circumstances. Consider the results in Fig. 6b. In this case, files of up to 10 MB are generated, and 1 MB of content is added at a random position within the file. Focusing on Dropbox again, observe that the amount of traffic increases when files are bigger than the Dropbox 4 MB-long chunk. This happens because the additional 1 MB can affect more than 1 chunk at once. For instance, adding 1 MB somewhere before the boundary of the first chunk would shift all data in the following chunks too. As such, the volume of data to be transmitted is larger than the new content.
Finally, we can see the trade-off of having either delta encoding or chunking/deduplication in Fig. 6b. While only Dropbox implements delta encoding, we can see that chunking and deduplication allow Wuala and Copy to upload only those chunks that are actually affected by the addition of content at a random position. Notice how the number of Bytes exchanged by Wuala and Copy shows sudden drops in Fig. 6b when files are larger than the respective chunk sizes (4 MB and 5 MB). Yet, a major portion of files is uploaded again.
F. P2P Synchronization
Devices hosting common files could be synchronized with-out retrieving every content from the cloud, thus saving both network and server resources. Dropbox is known [1] for implementing a LAN Sync Protocol that allows devices, possibly from different users, to exchange content using P2P communication when clients are connected to the same LAN. To check which services implement P2P synchronization, we perform the following steps. We first manually verify each service GUI searching for explicit parameters related to P2P synchronization. This manual inspection reveals that both Copy and Dropbox offer such capability.
We then configure those services to perform P2P synchro-nization and modify our testbed to put both test computers in the same LAN. We let the testing application submit work-loads composed of single binary files of different sizes. By monitoring the traffic going to Test Computer 2 (downloads), we observe that only Dropbox and Copy indeed skip the download of content from the cloud, retrieving files from Test Computer 1. Other services, instead, always download the files from central servers, even if files are available locally at Test Computer 1, thus wasting Internet bandwidth.
TABLE II: Summary of the capabilities implemented in each service.
Service Bundling1,2 Chunking2 Compression Deduplication Delta Encoding P2P Sync
Box no (mc) no never no no no
Cloud Drive no (upmc, downmt) no never no no no
Copy no (mt) 5 MB never yes no yes
Dropbox yes 4 MB always yes yes yes
Google Drive no (mc) 8 MB (down only) smart no no no
hubiC no (mt) no never no no no
Mega no (mc) 1 MB never partially no no
OneDrive no (mt) up 4 MB, down 1 MB never no no no
Wuala no (mt) 4 MB never yes no no
ownCloud no (mt) no smart / down only no no no
Horizon no (mt) 1 MB (up only) never partially no no
1mc: one or multiple TCP connections per file;mt: one or multiple application layer transactions per file. 2upanddownrefer to the upload and the download experiments, respectively.
G. Summary
Tab. II summarizes the capabilities of each service. It shows
(i) whether bundling is implemented, or whether multiple
TCP connections or multiple application layer transactions
are used to submit files; (ii) the chunking strategy used to handle large files, including chunking thresholds; (iii) whether content is compressedalways,never, only when downloading, or based on file formats (i.e., smart); (iv) whether the service implements deduplication, completely or partially; (v) whether the service implements delta encoding; and (vi) whether P2P synchronization is available. We can see that Dropbox is the most sophisticated service from the point of view of features to enhance synchronization speed. Other services have a mixed design, implementing a subset of capabilities. Finally, we see also very simple client designs (e.g., Box and hubiC), in which no capabilities are present.
IV. SYSTEMDESIGN
Next, we want to understand how services are implemented in terms of protocols and data center placement. In particular, we check the network fingerprint of each service when in idle state and whether services use a centralized or a distributed data center topology. Findings are summarized in Tab. III. A. Protocols and Overhead
The traffic of the analyzed services can be roughly classified
into two main groups: control and data storage. Regarding
control, servers perform three major tasks:authentication,file
meta-data control, and notification of file changes. As
men-tioned in Sect. II, all services exchange traffic using HTTPS, with the exceptions of ownCloud and Dropbox notification protocols that rely on plain HTTP. Interestingly, some Wuala storage operations also use plain HTTP, since users’ privacy has already been secured by local encryption.
We notice relevant differences among the services during login and idle phases. Fig. 7 reports the cumulative number of Bytes exchanged in a 40 min interval after starting the services and without synchronizing any files. For improving visualization, we report only services that exchange more than 90 kB on the interval. Two main considerations hold. Firstly,
0 100 200 300 400 500 600 0 10 20 30 40 Cumulative traffic (kB) Time (min) OneDrive Cloud Drive Copy ownCloud Horizon hubiC
Fig. 7: Background traffic generated by services in idle state.
the services authenticate the user and check if any content has to be updated. Note how Cloud Drive exchanges about 300 kB with remote servers. Coming next, we can see that OneDrive requires about 150 kB in total, 4 times more than others. This happens because the service contacts many Microsoft servers during login. Other services produce a negligible amount of traffic at start up, thus reinforcing the weaknesses in Cloud Drive and OneDrive start up protocols.
Secondly, once login is complete, services may keep ex-changing data with the cloud. The majority of services main-tains an open TCP connection with servers, in which file changes are announced. In general, we observe silent protocols that seldom exchange any data in the network – i.e., changes are notified by clients or servers as they occur via the open connection, and keep-alive messages are exchanged periodi-cally only to guarantee that the notification channel remains open. Copy, Dropbox and Box poll servers every 60 s, resulting in a bandwidth usage of less than 200 b/s. Similarly, Google Drive, OneDrive and Wuala present negligible background traffic, but they pool servers at 30 s, 45 s and 5 min, respectively. Mega keeps a notification connection always open without exchanging any keep-alive messages at the application layer. It instead renews the notification connection after 10 min or more, thus putting almost no load in the network.
Other services, on the contrary, have noticeable traffic when idle. Fig. 7 shows that both Cloud Drive and hubiC generate more than 0.7 kb/s. Horizon and ownCloud are even less
TABLE III: Summary of system design choices of each service.
Service Topology Data Center Location Pooling Interval Background Traffic
Mega Partly distributed Europe/Oceania N/A <0.01 kb/s
Google Drive Distributed Worldwide 30 s 0.03 kb/s
Wuala Centralized Europe 5 min 0.05 kb/s
OneDrive Partly distributed U.S./Asia 45 s 0.05 kb/s
Dropbox Centralized U.S. 60 s 0.10 kb/s
Copy Centralized U.S. 60 s 0.12 kb/s
Box Centralized U.S. 60 s 0.16 kb/s
Cloud Drive Partly distributed U.S./Europe 5 min 0.72 kb/s
hubiC Centralized Europe 60 s 0.76 kb/s2
Horizon N/A1 N/A 60 s 1.04 kb/s
ownCloud N/A N/A 30 s 1.24 kb/s
1N/A: Not applicable.
2hubiC figures vary considerably as more files are added – e.g., it reaches 12 kb/s when 87 MB distributed in 462 files are synchronized.
efficient: They produce 1.04 kb/s and 1.24 kb/s, respectively. Although apparently small, such background traffic might be problematic for users with limited traffic subscriptions and also for providers. For instance, 10 million users connected simultaneously to hubiC or Cloud Drive generate around 8 Gbps even if no activity in the services is performed. Google Drive would consume less than 0.5 Gbps.
Finally, we notice a clear problem in the notification pro-tocol of hubiC. Its background traffic is proportional to the number of files in the service. For example, hubiC creates a constant stream of around 12 kb/s when 87 MB (462 files) are put in its folders during our experiments. These findings illustrate the relevance of designing notification protocols in cloud storage services. Even if each of such notifications may by relatively small when compared to user files, poor design choices can result in high costs to users and servers.
B. Data Center Topology
Apart from our local installations (i.e., Horizon and ownCloud), our methodology reveals that providers follow three major approaches in terms of data center placement.
A first group of services operates from a single region, relying on few data centers. Box and Copy are both centralized in the U.S., operating from San Jose and Detroit areas, respectively. Dropbox manages own servers also in the San Jose area. These servers are however in charge of control tasks only. All Dropbox users worldwide are directed to Amazon’s data centers in Northern Virginia when storing data. Other two services are instead centralized in Europe, with hubiC operating from Northern France, and Wuala using two third-party locations, one in Northern France, and a second one in the Nuremberg area, Germany.
A second group of providers deploys a partly-distributed topology, in which a few data centers are spread in key places in the world. Mega relies on third-party data centers in New Zealand and Germany. Cloud Drive uses Amazon’s data centers in Ireland, Northern Virginia and Oregon. OneDrive takes advantage of Microsoft’s data centers in the Seattle area (U.S. West Cost) and Southern Virginia (U.S. East Cost). We have identified IP addresses located in Ireland and Singapore as well, which seem to handle OneDrive control traffic, but no
data storage. In general, traffic from our testbed is directed to the closest data center of each provider, as expected.
Finally, Google Drive is the only service with a fully
distributed topology. Several edge nodes can be identified
worldwide, and clients are redirected to the (possibly) nearest edge node based on DNS load-balancing. TCP connections are terminated at Google’s edge node, and the traffic is then routed to actual data centers using Google’s private network. We have identified more than 30 edge nodes spread in 6 continents. The advantages of such topology are twofold: (i) RTT between clients and servers is sensibly reduced, allowing for faster transfers over short-lived TCP flows; and (ii) storage traffic is offloaded from the public Internet.
C. Summary
Tab. III summarizes the design characteristics evaluated in this section. Services are sorted according to background traffic. We can see that Mega wins in this aspect: It implements the most efficient notification protocol and relies on data centers in different continents. On the other extreme, we see that hubiC and Cloud Drive produce noticeable background traffic, which might be a problem not only for users but also for servers if the number of on-line users becomes high. Finally, we observe that only major players besides Mega (i.e., Microsoft, Google and Amazon) rely on global data center placement. Performance implications are discussed in Sect. V.
V. BENCHMARKS
We now evaluate the design choices by presenting a series of benchmarks. Sect. V-A describes the used workloads. Sect. V-B highlights the determining factors to the overall synchronization time, further detailed in Sects. V-C, V-D, and V-E. Sect. V-F provides an overview of traffic overhead. Sect. V-G evaluates how the metrics vary in a long-term measurement campaign. Findings are summarizes in Tab. V. A. Workloads
We rely on previous work [1], [15], [16] that presents characterization of Dropbox usage to design benchmarks that reproduce realistic workloads. The main characteristics can
0.0 0.2 0.4 0.6 0.8 1.0
Cloud DriveownCloudWualaGoogle DriveHorizonHubicMega OneDriveBox DropboxCopy
Fraction of time
Start-up Propagation
Upload Download
(a) Workload 1 – 1 file of 100 kB
0.0 0.2 0.4 0.6 0.8 1.0
WualaownCloudCloud DriveHorizonGoogle DriveOneDriveMega HubicDropboxBox Copy
Fraction of time Start-up Propagation Upload Download (b) Workload 2 – 1 file of 1 MB 0.0 0.2 0.4 0.6 0.8 1.0
WualaownCloudCloud DriveMega OneDriveHorizonHubicGoogle DriveDropboxBox Copy
Fraction of time Start-up Propagation Upload Download (c) Workload 3 – 1 file of 20 MB
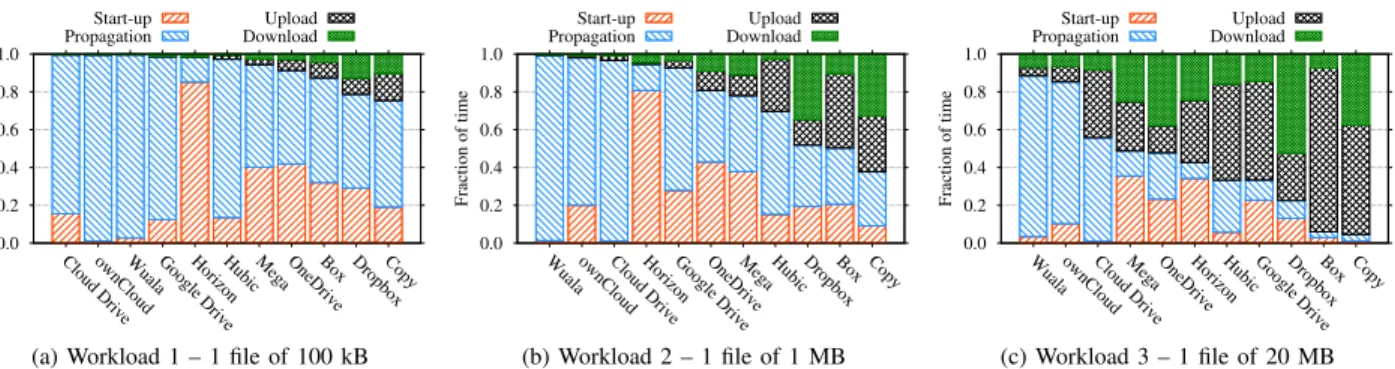
Fig. 8: Fraction of time expended in each step of the synchronization cycle for single-file workloads. Note that clients are sorted according to their fraction of silent periods in each plot (i.e., start-up plus propagation delays).
be summarized as follows: (i) Files stored in the cloud are generally small, with typical data storage flows that carry few Bytes; (ii) the file size distribution is, however, heavy-tailed – users thus do generate some large content; (iii) the majority of content is already compressed (e.g., images, videos and archives), although a non-negligible percentage (more than 30%) of compressible files is present (e.g., text files); (iv) files are often added in large batches with tens of files; (v) replication is common, both within folders of a single user and among different users because of shared folders.
Based on this information, we create 6 benchmarks varying (i) the number of files; (ii) file sizes; (iii) file formats; and (iv) the percentage of file replicas. Tab. IV lists them. The first four sets are arbitrary and aim to test typical synchronization scenarios – i.e., small files, large files, bundles etc. The last two sets, instead, are formed by files recreated using a random subset of the file metadata collected in [15]. They mimic a scenario in which a user adds a large number of files into a synchronized folder at once, such as when adding previously existing content or when migrating files between services.
TABLE IV: Benchmarks to assess service performance.
Work-load Files Binary Text
Total Size Replicas 1 1 1 – 100 kB – 2 1 1 – 1 MB – 3 1 1 – 20 MB – 4 100 50 50 1 MB – 5 365 194 171 87 MB 97 (5.4 MB) 6 312 172 140 77 MB 136 (5.5 MB)
All experiments are executed precisely in the same environ-ment, from a single location, and under the same conditions, in order to isolate other effects and highlight the implications of design choices. Each experiment is repeated 20 times per service, and we wait until the network is completely silent to consider an experiment round complete. Furthermore, we run a different benchmark set (see Tab. IV) at each round and wait for a random period of time between rounds (always longer than 5 min) to prevent our results from being affected by systematic sampling bias [17] and to avoid creating abnormal workload to servers and the network. Only experiments that complete successfully are considered. Indeed, some few tests have been aborted automatically due to failures, in particular
with Wuala and Copy, for which reliability issues could be identified. Depending on the benchmark set and on the application-under-test, an experiment round lasts up to one day. In total, results presented in the following summarize experiments collected in more than 90 days.
B. What Dominates Synchronization Delay?
We start by identifying which factors contribute the most to the overall synchronization delay. Figs. 8 and 9 report average values in each synchronization phase – i.e., the time interval in each step from the workload generation till the download is complete (see Fig. 2).
Fig. 8 depicts the fraction of time spent by the 11 services in each synchronization step for Workload 1 (1 file of 100 kB), Workload 2 (1 file of 1 MB) and Workload 3 (1 file of 20 MB), i.e., when a single small, medium or large file has to be synchronized. For improving visualization, we report only the part of the propagation delay between upload end and download start. Indeed, in this scenario, all services wait for the upload to complete before starting the download. Services are sorted by the sum of start-up and propagation delays – i.e., the most reactive services are in the right side of the plots.
A striking conclusion immediately emerges, in particular for near real-time scenarios (e.g., collaborative sharing of files). Despite the high variation among services, synchronization time in most examples is dominated by start up and prop-agation delays. This behavior might be expected for small files, where uploads and downloads complete very fast. Yet, for some services we observe that this holds true even with large files: Start up and propagation delays consume up to 90% of the total synchronization time when sending 20 MB files (see Wuala in Fig. 8c), whereas those delays are at least equal to 40% when sending 1 MB files in the best case (Fig. 8b).
As we will detail later, some services exhibit clear perfor-mance penalties. Our local ownCloud installation, for example, takes longer to finish handling Workload 2 (1 MB file) than Dropbox – the former needs more than 10 s to complete a 1 MB synchronization, 98% of which is spent being idle. Cloud Drive and Wuala typically require more than 2 min to complete the same 1 MB tasks. However, Wuala start up and upload delays are generally low, thus suggesting that this long delay is not due to Wuala local encryption of files. In
400 ≈ ≈ Box Wuala Cloud Drive ownCloud Google Drive hubiC Copy OneDrive Dropbox Horizon Mega 0 40 80 120 160 200 240 Time (s) ≈ ≈ Start-up Upload Propagation Download
(a) Workload 4 – 100 files of 10 kB
2200 ≈ ≈ Box Copy ownCloud Cloud Drive Horizon Google Drive Wuala Dropbox hubiC Mega OneDrive 0 100 200 300 400 500 600 700 Time (s) ≈ ≈ Start-up Upload Propagation Download
(b) Workload 5 – 365 files, 87 MB in total
2000 ≈ ≈ Box Copy ownCloud Cloud Drive Google Drive Horizon Dropbox hubiC Wuala OneDrive Mega 0 100 200 300 400 500 600 Time (s) ≈ ≈ Start-up Upload Propagation Download
(c) Workload 6 – 312 files, 77 MB in total
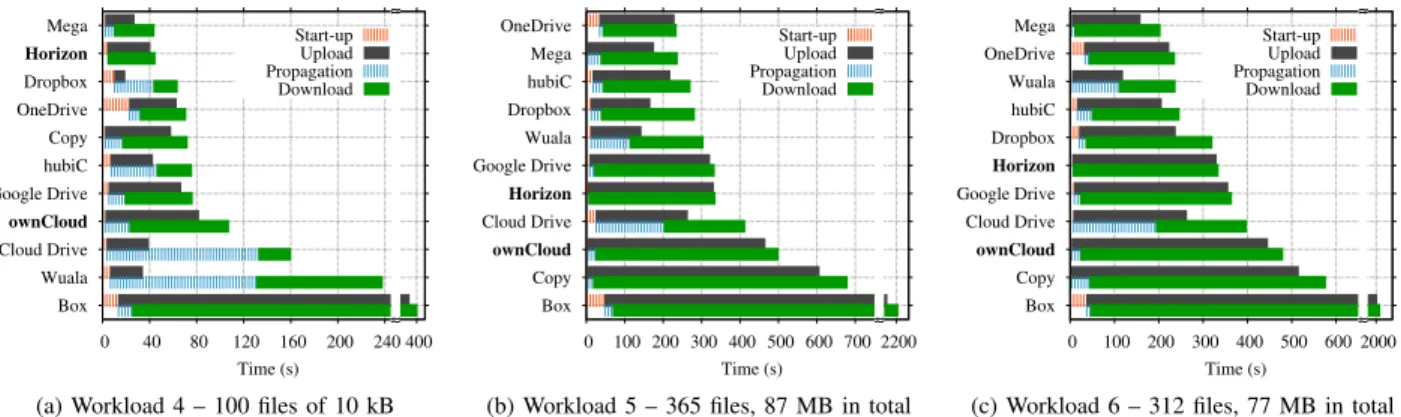
Fig. 9: Average time to complete each phase of the benchmarks with multiple file workloads. Silent periods are marked with dashed bars. Services are sorted per total synchronization time. Note the discontinuity on x-axes.
both Cloud Drive and Wuala cases, the long delay is caused by a time-based approach to trigger downloads, which forces clients to stay idle for long intervals.
We repeat the analysis with multiple-file workloads in Fig. 9. Services are sorted according to their average total synchronization time. Overall, all services become slower when multiple files are involved. Mega and OneDrive win these benchmarks after expending 44 s, 235 s and 204 s on average to complete Workload 4 (100 files, 1 MB in total), Workload 5 (365 files, 87 MB in total) and Workload 6 (312 files, 77 MB in total), respectively. Interestingly, they generally achieve a good performance despite not implement-ing advanced client capabilities. In the case of Mega, this seems to happen because of both the proximity of its data centers to our test location and its lightweight client, whereas OneDrive performs well with large workloads because of its concurrent transfers. Dropbox with its sophisticated client is usually among the best as well as hubiC. Other services are much slower owing to several factors, including simplistic clients and traffic shaping policies as detailed later. Notice, for instance, that Box consistently requires one order of magnitude more time than others, expending 400 s to complete the synchronization of 100 files of 1 kB. Box figures grow to more than 35 min with Workload 5 and 6.
Our private Horizon and ownCloud installations (marked in bold in the figures) present disappointing performance. Such poor performance definitively illustrates the importance of client design in cloud storage.
Overall, these results highlight that services have room for improvements, and better performance could be offered by improving system design. In the following we present a detailed analysis of each synchronization phase to better highlight properties, strengths and weaknesses of each service. C. Synchronization Start Up
We investigate how much time services need before syn-chronization starts. This metric reveals whether the adoption of advanced capabilities (e.g., bundling) could increase the initial synchronization delay. The metric is computed from the moment files are placed in Test Computer 1 until the
first packet with payload in a storage flow is observed in the network – i.e., TCP and SSL handshakes are ignored.5
Fig. 10 depicts results for 6 services and 4 workloads. It shows the empirical Cumulative Distribution Function (CDF) obtained by considering 20 repetitions. Other services and workloads are not shown for brevity, but the conclusions hold. When dealing with single small files (Workload 1, single file of 100 kB), we can see that Dropbox and Cloud Drive are the fastest services to start synchronizing. Dropbox’s bundling strategy, however, delays the start up when multiple files are involved – compare to Workload 4, 100 files of 10 kB, in the bottom-left plot. As we have seen in previous section, such strategy pays back in total upload time.
Horizon needs few more seconds to start the synchronization even if servers are placed in our LAN. This large start up delay contributes to make the service slower than services operating from other continents, thus canceling advantages of the local installation. OneDrive is generally among the slowest, waiting at least 9 s before starting submitting files. The root cause of this delay is unclear, since the service does not report activity during the period. Interestingly, Google Drive and Box CDFs present knees, also visible in other metrics. Coming sections will show that these services either have different servers that deliver variable performance or shape traffic explicitly.
Finally, start up delay is affected by the size of the workload being manipulated. We observe that the delay increases as ei-ther the number of files or the number of Bytes in the workload is increased. OneDrive and Box, for instance, take around 35 s and 40 s on average to start submitting Workload 5 (bottom-right plot). It is clear from these results that performance could be improved by reducing the start up delays, in particular when large workloads are involved.
D. Upload And Download Duration
Next, we evaluate how long each service takes to complete upload and download tasks. This is measured as the difference between the first and the last packet with payload in storage flows going to Test Computer 1 (uploads) or Test Computer 2 5The metric includes the delay of our application to send files to Test Com-puter 1. This artifact is ignored since all tests are equally affected.
0.0 0.2 0.4 0.6 0.8 1.0 0 3 6 9 12 CDF Time (s) Workload 1 (1 x 100 kB) Dropbox Google Drive OneDrive Cloud Drive Box Horizon 0.0 0.2 0.4 0.6 0.8 1.0 0 5 10 15 20 CDF Time (s) Workload 3 (1 x 20 MB) 0.0 0.2 0.4 0.6 0.8 1.0 0 5 10 15 20 25 CDF Time (s) Workload 4 (100 x 10 kB) 0.0 0.2 0.4 0.6 0.8 1.0 0 10 20 30 40 50 CDF Time (s) Workload 5 (87 MB)
Fig. 10: Start up delays. Note the differentx-axes.
(downloads). Again, we ignore TCP and SSL handshakes, tear-down delays and control messages sent after transfers are complete.6 We expect the network properties to play a central
role, i.e., services whose data centers are far from our test location are expected to show poor performance due to the well-known limitations of TCP with high RTT.
Focusing on top-left plot of Fig. 11, notice how services require a negligible amount of time to upload single 100 kB files. As the workload size is increased, upload time increases fast for services deployed far from our test location – e.g., Dropbox and Google Drive take up to 5 times more time than our local Horizon to complete 20 MB uploads (top-right plot). Box and Cloud Drive are even slower, the former requiring around 200 s to complete 20 MB uploads (800 kb/s, 170 ms RTT). When comparing results to download figures (omitted for brevity), a different pattern emerges, confirming that Box and Cloud Drive shape upload rates only. Overall, we can conclude that data center placement and the explicit selection of system parameters are the determining factors for upload and download speeds with single-file workloads.
When multiple files are stored, on the other hand, other aspects play the central role, such as client capabilities. Bottom plots in Fig. 11 show a striking difference on transfer duration when a large number of files is used. Notice how the upload of 100 files of 10 kB (thus 1 MB in total) takes more time than the exchange of a single 20 MB file in most cases. Dropbox wins when uploading Workload 4 (100 files, 1 MB in total) and Workload 5 (365 files, 87 MB) because its capabilities (e.g., bundling) allow to optimize the data transfer phases. The service is at least two times faster than any competitor when sending Workload 4. Interestingly, we can see the trade-offs of implementing advanced client capabilities on Dropbox results: 20% of Dropbox uploads finishes in around 1 s. Those are, however, the experiment rounds in which Dropbox experiences its longest start up delays – see the tail of the distribution in bottom-left plot of Fig. 10.
6Some services allow users to limit data rates manually. This functionality, as well as P2P synchronization, has been disabled where available.
0.0 0.2 0.4 0.6 0.8 1.0 0.001 0.01 0.1 1 10 CDF Time (s) Workload 1 (1 x 100 kB) Dropbox Google Drive OneDrive Cloud Drive Box Horizon 0.0 0.2 0.4 0.6 0.8 1.0 1 10 100 1000 CDF Time (s) Workload 3 (1 x 20 MB) 0.0 0.2 0.4 0.6 0.8 1.0 1 10 100 1000 CDF Time (s) Workload 4 (100 x 10 kB) 0.0 0.2 0.4 0.6 0.8 1.0 10 100 1000 10000 CDF Time (s) Workload 5 (87 MB)
Fig. 11: Upload times. Note the logarithmicx-axes.
0.0 0.2 0.4 0.6 0.8 1.0 0.1 1 10 100 1000 CDF Time (s) Workload 1 (1 x 100 kB) Dropbox Google Drive OneDrive Cloud Drive Box Horizon 0.0 0.2 0.4 0.6 0.8 1.0 0.1 1 10 100 1000 CDF Time (s) Workload 3 (1 x 20 MB)
Fig. 12: Propagation delays. Note the logarithmicx-axes.
Both Horizon (local installation) and Google Drive (world-wide data centers) are slower than Dropbox. They need around 300 s to complete experiments with Workload 5, whereas Dropbox finishes in 130 s, owing to capabilities. OneDrive presents a stable and consistent performance. Box shows again a poor performance when uploading because of the combination of traffic shaping with lack of capabilities. It takes more than 30 min to conclude experiments with Workload 5! Overall, results for other services reinforce the role of client design when manipulating complex workloads.
E. Propagation Delay
Propagation delays are depicted in Fig. 12. This metric is computed as the difference between download and upload starting times. It thus includes the first content upload delay, since none of the services is able to start downloading content before completing the upload of at least one file.
We see in Fig. 12 that propagation delays do not vary greatly among different workloads, with the exception of Workload 3, in which services wait for the single file of 20 MB to be uploaded before propagating changes. Google Drive, Dropbox, OneDrive and Box are relatively stable and start downloading after 3–10 s in experiments with Workload 1, 4 and 5. Our Horizon installation is by far the most reactive. It notifies and triggers downloads almost instantly after upload is complete. Propagation delays of Cloud Drive vary greatly during the
0.0 0.2 0.4 0.6 0.8 1.0 1 1.1 1.2 1.3 1.4 1.5 CDF Overhead Workload 1 (1 x 100 kB) Dropbox Google Drive OneDrive Cloud Drive Box Horizon 0.0 0.2 0.4 0.6 0.8 1.0 0.8 1.2 1.6 2 2.4 CDF Overhead Workload 4 (100 x 10 kB)
Fig. 13: Traffic overhead. Thex-axes depict the ratio between
control and storage trafficovertwo times the benchmark size.
experiments. Manual inspection shows that Cloud Drive uses a time-based trigger of 5 min for checking for updates (thus waiting on average 2.5 min). In contrast, other services (e.g., Dropbox) implement asynchronous notification protocols. This behavior can be noticed by the shape of Cloud Drive CDFs in left plot of Fig. 12 – propagation delays grow from 10 till 300 s almost uniformly (note the logarithmic x-axes).
It is clear from these results that finding the right balance between start up, upload/download, and propagation delays is hard and our methodology helps in revealing trade-offs of the various design choices.
F. Traffic Overhead
We evaluate overhead to check to what extent the control traffic required for implementing client capabilities affects cloud storage network fingerprint. Fig. 13 shows the overhead
CDFs of 6 services, calculated as the ratio between total
exchanged trafficovertwice the total file size(hereafter called
overhead ratio).7 Note that the use of compression may lead
to ratios smaller than 1 when text files are in the workloads. We see that all services have a significant overhead when a single small file is synchronized (see left plot in Fig. 13). Services using one or several TCP connections for every file transfer, such as Cloud Drive, present the highest ratio. Dropbox also exhibits a high overhead, possibly owing to the signaling cost of implementing its advanced capabilities. On average, its ratio is equal to 1.2 when synchronizing 100 kB. Not shown in the figure, the overhead ratio decreases dramatically for most services when large files are submitted (e.g., Workload 3, single file of 20 MB). Dropbox surprisingly still presents high overhead (7%) in this scenario as well.
The lack of bundling dramatically increases the overhead when multiple small files are synchronized, because the ex-change of every file requires application layer control traf-fic to be sent. Cloud Drive, for instance, exchanges more than twice as much traffic as the actual data size when handling 100 files of 10 kB (Workload 4, see right plot). Services implementing compression naturally perform better with Workload 4, being 50% of its content compressible. The lack of bundling capabilities, however, makes the overhead of Google Drive to reach 20%, despite the compression gains. Google Drive indeed suffers from opening a separate TCP
7The factor 2 accounts for both upload and download phases.
3 10 30 100 00:00 06:00 12:00 18:00 00:00 Throughput (Mb/s) Dropbox Google Drive ownCloud Horizon Mega
Fig. 14: Upload throughput according to the time of the day (20 MB files). Note the logarithmicy-axes.
(and thus SSL) connection for each content. Compare Google Drive to Dropbox in Workload 4 to appreciate the extra cost. Other workloads confirm the advantages of client capabilities such as bundling, de-duplication and compression.
G. Long-term Delay Patterns
Finally, we perform long-term measurements to understand whether services present any performance periodicity. As we saw previously, services such as Google Drive deliver variable performance – e.g., sudden increases in upload times (see Fig. 10). We perform measurements with single file workloads over one month, committing more than 8,800 transactions. Fig. 14 shows results for uploads with 1 file of 20 MB. For improving visualization, we report the throughput in each transaction – i.e., benchmark size over upload delay. Results for 5 services are presented. Each experiment is marked with a dot according to the time of the day it is performed. Thus, results are mapped to a single 24-hourx-axis.
We can see that services have stable performance without any evident periodicity. Google Drive is the only exception, exhibiting a bi-modal distribution: Experiments at night show 11 Mb/s of average upload throughout, while 8 Mb/s or 11 Mb/s is reached during day-time. Manual inspection re-veals that synchronization is consistently slower when clients contact a subset of the Google edge nodes in charge of cloud storage traffic. Interestingly, slow nodes are likely contacted during daytime. Since the selection of edge nodes is automati-cally done by load balancing techniques, users have no control on what performance they will experience in a transaction.
Fig. 14 also reinforces the role of RTT when synchroniz-ing large ssynchroniz-ingle-file workloads: Our local deployments (e.g., ownCloud) make a much better use of network capacity in such scenario than services operating far from our test location – e.g., Dropbox with 100 ms of RTT.
H. Summary
Tab. V summarizes results. It shows: (i) An indication of client sophistication based on the number of implemented capabilities (Sect. III); (ii) the average RTT from our testbed to servers, which is related to data center placement and topology (Sect. IV); (iii) the minimum and maximum traffic overhead ratio observed during the benchmarks, which is a consequence of the presence/lack of capabilities as well as the design of
TABLE V: Summary of the benchmark results.
Service Capabilities RTT (ms) Overhead ratio Silent Period
1(s) and Total Synchronization Time2 (s)
WL 2 WL 3 WL 4 WL 5 OneDrive + 129 1.00 – 1.40 21 23 28 46 32 71 43 235 Mega + + 45 0.95 – 1.13 4 5 8 11 10 44 36 238 hubiC - 22 1.01 – 1.12 34 35 95 113 46 76 43 271 Dropbox + + + + + + 99 0.93 – 1.09 7 10 21 44 43 64 37 283 Wuala + + 35 1.00 – 1.89 135 136 147 158 131 238 112 305 Google Drive + + 12 1.00 – 1.19 18 19 27 32 19 77 20 334 Cloud Drive - 46 1.01 – 2.13 165 167 232 254 132 160 202 414 Copy + + + 119 0.99 – 1.42 11 17 105 168 17 72 17 680 Box - 170 1.02 – 1.30 29 33 321 347 25 406 68 2,208 Horizon + + <1 1.00 – 1.30 4 4 9 11 4 45 5 336 ownCloud + <1 1.00 – 1.22 11 11 22 24 23 108 23 501
1Sum ofstart-upandpropagationtime. These numbers show the total time Test Computers spend idle before reacting in an experiment. 2Workload 2 – 1 file of 1 MB; Workload 3 – 1 file of 20 MB; Workload 4 – 100 files of 10 kB; Workload 5 – 365 files, 87 MB in total.
notification/control protocols; (iv) the time Test Computers spend idle before reacting in an experiment (i.e.,start-upplus
propagationdelays), indicating how reactive services are; and
(v) the total synchronization time for 4 different workloads. Services are sorted by the synchronization time in Workload 5. Bold highlights the best service in each metric.
While the RTT is a key parameter to performance as ex-pected, the table reinforces the importance of design choices. We can see, for example, that although our private deploy-ments win some benchmarks, other services deliver similar performance under much higher RTT, thanks to client capa-bilities, reactiveness, etc. It is also evident that there is no single winner. Sophisticated clients, such as Dropbox, seem to be the most suitable for near real-time scenarios (e.g., collaborative work), but the simple and concurrent design of OneDrive performs equally well with large workloads (e.g., migrations) despite the high RTT and reaction time.
VI. RELATEDWORK
The study of personal cloud storage services has re-cently attracted the interest of the research community. Some works [1], [18], [19] focus on the characterization of a specific cloud storage service from passive measurements obtained in the network. Those measurements are used to build an initial model for the Dropbox client behavior in [20]. Security threats for cloud storage services are discussed in [13], [21], in which the internal functioning of Dropbox is also revealed by means of reverse engineering in a lab environment. In contrast to these works, we propose a generic benchmark methodology to compare several services using active network measurements. The authors of [22] present a study similar to ours, but focusing on server infrastructure only. In [23], a performance analysis of the Amazon Web Services (AWS) is presented, but without focusing on personal storage. Similarly to our goal, [5] evaluates Dropbox, Mozy, Carbonite and CrashPlan by manually running simple experiments. Motivated by the exten-sive list of services on the market, we propose a methodology and implement tools to automate the benchmarks. Moreover, we analyze various synchronization scenarios, shedding light on the impact of design choices on performance. In [6], [24],
a set of active experiments is performed with Dropbox, and high traffic overhead is identified in certain scenarios. Our work automates the benchmark and can be used to perform similar (and other) analyses with multiple cloud storage ser-vices. Authors of [4] propose a methodology to benchmark cloud storage, and evaluate three services (Dropbox, Box and SugarSync) in a long-term measurement campaign. The methodology in [4], however, relies on public APIs to perform the measurements, whereas we develop a black-box approach that can be used to test any cloud storage services under realistic usage conditions.
Quality of Experience (QoE) in cloud storage has been studied in [25], [26]. Technical aspects such as network bandwidth and synchronization latency are identified as im-portant sources of users’ satisfaction. In [27], a mechanism to ensure consistency between the local file system and the remote repository is proposed, possible improving QoE. We contribute with tools to measure performance of cloud storage service, thus helping users and new providers to independently compare services. The characteristics of files stored in cloud services and possible bottlenecks in storage protocols have been analyzed in [1], [15], [16]. We rely on findings of these works to define the benchmarks used to evaluate the performance of storage services.
VII. CONCLUSIONS
This paper presented a methodology to study personal cloud storage services. Our methodology first unveils client capabilities and system designs. It then allows repeatable and customizable benchmarks to be executed without instrument-ing proprietary services. The effectiveness of the methodology was shown in a case study in which 11 services were compared in a measurement campaign lasting more than 3 months.
By contrasting the performance of local cloud installations and public services deployed at different continents, our case study showed the relevance of client capabilities, protocol
designanddata center placementto personal cloud storage.
We observed, for instance, that Dropbox outperforms our local ownCloud installation, even if the RTT from our testbed to Dropbox servers is three orders of magnitude higher, thanks