ReDAL: An Efficient and Practical Request
Distribution Technique for Application Server
Clusters
Kaushik Dutta, Anindya Datta, Debra VanderMeer, Helen Thomas, Krithi Ramamritham
Abstract— Modern web-based application infrastruc-tures are based on clustered, multi-tiered architecinfrastruc-tures, where request distribution occurs in two sequential stages: over a cluster of web servers, and over a cluster of application servers. Much work has focused on strategies for distributing requests across a web server cluster in order to improve the overall throughput across the cluster. The strategies applied at the application layer are the same as those at the web server layer, because it is assumed that they transfer directly.
In this paper, we argue that the problem of distributing requests across an application server cluster is fundamen-tally different from the web server request distribution problem, due to core differences in request processing in web and application servers.
We devise an approach for distributing requests across a cluster of application servers such that overall system throughput is enhanced, and load across the application servers is balanced. We compare the performance of our approach with commercially used techniques, as well as techniques from the recent literature. We perform this comparison experimentally in terms of throughput and response time performance, as well as resource utilization. Our experimental results show a significant improvement of up to nearly 80% in both throughput and response time, with a very low additional cost in terms of CPU overheads, 0.7% to 1.5%, on the web server, and virtually no impact on CPU overheads on the application server. A case study involving a large financial institution validates the experimental results, showing significant response time improvements.
Index Terms— [H-3-4-b] Distributed systems, [H-3-4-b] Performance evaluation, [H-3-5-e] Web-based services, [J-8-a] Client/server and multitier systems, [J-8-e] Electronic commerce, [J-8-l] Middleware/business logic.
K. Dutta and D. VanderMeer are with Florida International University
A. Datta is with Singapore Management University H. Thomas is an independent consultant
K. Ramamritham is with the Indian Institute of Technology -Bombay
An early version of this work appears in the Proceedings of International Conference on Distributed Computing Systems 2005.
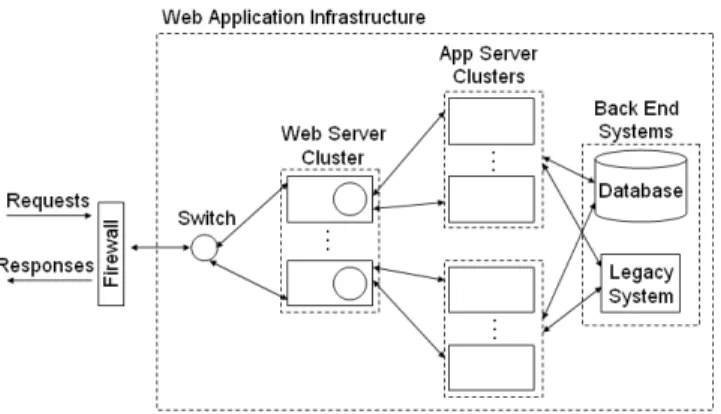
Fig. 1. Web Application Architecture
I. INTRODUCTION
Request distribution in clustered environments is an important problem that has been studied in a number of different contexts. In this paper, we are interested in developing effective techniques for distributing requests to a cluster of application runtimes, such as the Java Virtual Machine (JVM) for Java EE applications and the Common Language Runtime (CLR) for Microsoft .NET applications. Here, we are specifically interested in the common scenario of business applications running on commercially-available application server software, as opposed to special-purpose cluster architectures such as those described in [1].
Modern application infrastructures are based on clus-tered, multi-tiered architectures. Figure 1 shows a typ-ical architecture for a web-based application, one rec-ommended as a “best possible” architecture [2].
In Figure 1, there are two significant request dis-tribution points. First, the web switch must distribute incoming requests across a cluster of web servers for HTTP processing. Subsequently, these requests must be distributed across the application server cluster for the execution of application logic. To distinguish be-tween these two steps, we will refer to them as the
Web Server Request Distribution(WSRD) problem and the Application Server Request Distribution (ASRD) problem, respectively. In this paper, we develop an effective ASRD technique for session-intensive
applica-tions. ASRD and WSRD differ greatly in the dynamics of work involved in serving a request (as described in [3]); serving application requests requires much more dynamic decision making than that required for web server requests.
A. Related Work
Extensive literature dealing with the WSRD problem exists and significant commercial value has been re-alized from this work. WSRD approaches span both
content-blind policies such as random, round-robin
(RR), as well as content-aware policies such as IP Address Routing [4], Least Loaded (based on a metric called server load index) [4], Least Connections [5], [6], Client Affinity [7], [8], and Session Affinity [4]. Commercial Products such as Cisco’s LocalDirector [5] and F5 Network’s BIG/IP [6] are based on some of these approaches. Nearly all of the above-mentioned approaches are variants of the weighted RR (WRR) approach [8].
In some commercial products [9], [10], content-based routing schemes are supported, which route re-quests based on information contained in the HTTP header. These techniques do not consider the impacts of statefulness in applications, and are thus orthogonal to our work. Typically, content-based routing is used to segment requests across geographically dispersed environments, multiple application domains, etc.
The only strategies, to the best of our knowledge, that are not WRR variants are the Locality-Aware Request Distribution (LARD) algorithm [11] and the Client/Session Affinity schemes, all of which are based on some form of locality with respect to the servers. The LARD strategy attempts to route tasks to exploit the locality among the working sets of received requests (e.g., cache sets on different web servers), while the affinity based schemes distribute requests to exploit the locality of session or state data. The authors of [12] consider the extension of the LARD technique to the application server’s EJB layer to take advantage of EJB data caching where possible.
The bulk of ASRD in practice is based on a combina-tion of RR and Session Affinityrouting schemes drawn directly from WSRD techniques (e.g., [13], [14], [15]). More specifically, the initial requests of sessions (e.g., the login request at an airline web site) are distributed in a RR fashion, while all subsequent requests are handled throughSession Affinity based schemes, which route all requests in a particular session to the same application server. A user’s session state, which stores information relevant to the interaction between the end user and the web site (e.g., user profiles or a shopping cart), is
usually stored in the process memory of the application server that served the initial request in the session, and remains there while the session is active – only the application server instance where the session resides can service requests for that session.
There is scant treatment of ASRD in the research literature. Approaching load balancing as a variant of the dynamic scheduling problem, techniques from the scheduling field (e.g., [16], [17]) may be applica-ble here. Some work in the literature [18] takes this approach, proposing the application of optimization techniques to the problem of providing different classes of service (e.g., standard and premium service) in the context of web services.
While we can think of the ASRD problem as a variant of the dynamic scheduling problem at a high level (our technique will use a variant of the shortest-queue-first approach), a straightforward application is difficult. Virtually all dynamic scheduling techniques [19] presuppose some knowledge of either the task (e.g., duration, weight) or the resource (queue sizes, service times) or both. This assumption really does not work in our case, because both the tasks and the resources are highly dynamic. Moreover, the scalability requirements of an ASRD are such that any technique usable in practice must have only negligible overheads. The most direct work comparable to ours, that we were able to discover is [3], in which the authors show that system resource usage is not a good indicator of load on an application. The authors suggest that a better basis for determining load might be the number of active requests on an application, and propose a load balancing technique for application requests based on a “least-active-requests” routing policy. We refer to this as the HJ technique throughout the remainder of the paper. While the authors make a strong point in showing that system resource usage is not a strong basis for an ASRD technique, their load balancing technique has a significant limitation in that it is not applicable to stateful applications. Stateful session-based interactive applications form a large class of applications, e.g., a login-based web application is interactive, and therefore stateful. Our approach considers the stateful case. To summarize, ASRD techniques in practice virtually al-ways utilize WSRD policies, and there doesn’t appear to be a good candidate for use in ASRD scenarios in the research literature.
B. Contributions
Contributions of this paper include:
1) Identifying the need for new ASRD techniques, as opposed to applying existing WSRD techniques in the application layer.
2) Proposing an algorithm and architecture design for assigning load to clustered application servers, where requests are evenly distributed while still routing requests based on session affinity when possible.
3) Demonstrating, both experimentally using the standard TPC-W benchmark [20] as well as through a real-life case study scenario, the effi-cacy of our proposed technique.
C. Issues in Applying WSRD strategies to the Applica-tion Layer
It is important to understand why WSRD strate-gies at the ASRD layer are sub-optimal, and in
many cases ineffective. The key reason for this is that
web servers and application servers are fundamentally different entities, and therefore the same notions of what constitutes a “loaded” server do not apply, as demonstrated in [3]. We highlight three key differences here to illustrate the reasons for this.
First, the biggest difference is in thedeterminism of
the work performed. Web servers do very well defined
and quantifiable work, e.g., processing HTTP headers and serving up static content. Application servers, on the other hand, run multi-layer ad-hoc programs which might be dependent on data obtained from outside the application layer infrastructure. Thus, serving a request to an application server is significantly more complex than at the web server layer, evidenced by the fact that the application server cluster saturates well before the web server cluster in most dynamic applications.
The second issue is the degree to which observing
the system yields insights into its load level.
Sys-tem observation is a key component of most effective WSRD policies, such as WRR policies. Consider, for instance, the fact that a web server that is running at 30% CPU would be considered “lightly loaded” (compared to one running, say at 50%) by most WSRD policies. While such a judgment is quite accurate in the case of a web server, it often breaks down when applied to an application server. For instance, an application server running at 30% CPU might be experiencing low CPU utilization simply because a bulk of its active threads are “blocked” (e.g., waiting for database query results). In contrast, another application server in the same cluster running at 50% CPU may actually be less loaded, as it might possess a greater number of free threads. Note that while we used CPU utilization as the discussion metric in the above example, our arguments apply to any WSRD metric.
Third, since it is difficult, if not impossible, to determine the work required for a request based on
0 0.5 1 1.5 2 2.5 0 2 4 6 8 10
Number of Active Sessions
Time (minutes)
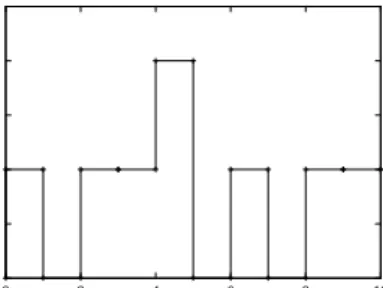
Fig. 2. Load Distribution for App ServerA1
0 0.5 1 1.5 2 2.5 0 2 4 6 8 10
Number of Active Sessions
Time (minutes)
Fig. 3. Load Distribution for App ServerA2
the characteristics of the request or system resource utilization, most WSRD techniques that rely on such information simply will not work when applied to ASRD. For this reason, most ASRD techniques use simple RR to distribute requests representing new ses-sions. Thereafter, requests for existing sessions are distributed to the application server instance where the session’s data resides. Clearly, Session Affinity schemes provide certain distinct advantages (such as state lo-cality) identified previously. However, these policies often result in severe load imbalances across the
application cluster, due primarily to the phenomenon
of the convergence of long-running or high-resource-demanding jobs in the same servers.
The problem of load imbalance due to session affinity is well known among practitioners, and has received wide treatment in the literature (e.g., [21], [22]). Con-sider an application cluster having two application servers, A1 and A2, configured identically. Consider a
sequence of sessions arriving at the cluster, such that sessions are of two types: a long session S, which lasts 3 minutes; or a short session s, which lasts 1 minute. Suppose that the following sequence of 10 sessions arrive to the cluster and are distributed toA1
and A2 according to the session affinity-RR policy:
s1, s2, S3, s4, s5, S6, s7, S8, S9, s10, where the
interar-rival time between new sessions is one minute. This policy results in the load distributions for A1 and A2
shown in Figures 2 and 3, respectively.
active sessions assigned, vs. time (in minutes). During the time interval spanning (4,5),A1 reaches maximum capacity (2 active sessions), while A2 remains idle. A similar situation occurs during the (7,8) time interval. As this simple example illustrates, a combined RR and Client/Session Affinity strategy can easily create load imbalances across the cluster.
Load imbalance is not the only issue inherent in a session affinity scheme. There is also the issue of the the
lack of session failover. This problem occurs because a session object resides on only one application server. When an application server fails, all of its session objects are lost, unless a session failover scheme is in place. The two main session failover schemes used are session replication, in which session objects are replicated at one or more application servers in the cluster, and centralized session persistence, in which session objects are stored in a centralized repository (e.g., a DBMS).
Effectively, these session failover mechanisms “vir-tualize” a session’s data, making it available to any application server instance in the cluster, thus enabling any server in the cluster to service any incoming request. However, there is a cost associated with moving a session object from one server process to another, so it is beneficial to serve a request on the server instance where the session’s data already resides.The ReDAL approach attempts to optimize this tradeoff by servicing a request on the server instance where the session data resides unless a significant load im-balance situation is detected, in which case workload may be transferred off a highly-loaded server to a
server experiencing lower load.We show the benefits
of our approach experimentally in this paper.
The remainder of this paper is organized as follows. In Section II, we present our ASRD approach. We then evaluate the performance of our proposed approach and compare it with that of existing ASRD policies experimentally, in Section III. Section IV describes a real-life test of our proposed approach. Finally, we conclude in Section V.
II. THEReDALAPPROACH
The ReDAL approach attempts to minimized load imbalances across application servers for stateful session-based applications. To accomplish this, ReDAL augments the traditional session-affinity based schemes with three specific techniques:
1) We define a non-intrusive load estimation mea-surethat senses the relative load of an application server without requiring instrumentation on the application server hardware or software.
2) Based on these load measurements, we propose a request distribution scheme that dispatches re-quests to the affined servers when possible, and to less-loaded application servers when there is a significant load imbalance.
3) Further, in order to minimize the movement of session data between application servers, we in-troduce a capacity reservation scheme that at-tempts to estimate the near-future expected load on an application server based on the sessions re-siding on the server, and to reserve future capacity sufficient to service those sessions’ requests.
A. Intuition
In theRequest Distribution for the Application Layer
(ReDAL) approach, we characterize an application server as being in one of two states: (a)lightly-loaded, or (b) heavily loaded. We explain these characteriza-tions using Figure 4 (adapted from [23]), the upper portion of which shows a typical throughput curve for an application server as load is increased. Section A represents alightly loadedapplication server, for which throughput increases almost linearly with the number of requests. This behavior is due to the fact that there is very little congestion within the application server system resource queues at such light loads. Section B represents aheavily loadedapplication server. Here, the response time increases proportionally to the user load due to increased queue lengths in the application server. Thus, as soon as this peak throughput pointor satura-tion point is reached, application server performance degrades. We refer to the load level corresponding to this throughput point as thepeak load.
In order to determine the peak load at runtime, we do not need to find the exact peak throughput point, we need only determine where the rate of change of throughput with load reaches zero by looking at the first derivative of the throughput curve – effectively, the slope of the throughput curve. We can generate a close approximation of the slope of throughput curve at runtime by gathering two data values at a configurable interval: (a) transactions per second, and (b) number of incoming requests. The lower portion of Figure 4 shows an approximation of the first derivative dfdx(x) of the throughput curve f(x) shown in the upper part of Figure 4. Here, dfdx(x)is roughly linear in the early stages of Section A, where the server is very lightly loaded. As the server begins to experience congestion in the later stages of Section A, the slope of f(x) begins to drop as load approaches its peak. In this stage, dfdx(x) drops toward 0 as f(x) approaches peak load. When
L1 L2 Throughput Peak or Saturation Point Peak Load Load: x
Transactions per second: f(x)
Load: x
Section A Section B
d f(x)/dx
Fig. 4. Typical Throughput Curve for an Application Server and its First Derivative
can designate a server to be lightly loaded if dfdx(x) is positive, and heavily loaded if dfdx(x) is 0 or negative.
At an implementation level, finding the point at which dfdx(x) reaches 0 requires a few tweaks to account for burstiness in traffic, as well as the potential for dif-ferences in average response times (based on resource usage) across different types of requests. The following expression describes a more detailed view of throughput on a server, to help account for these issues: dfdx(x) ≈ P ∀(p)dfdxp(px) = P ∀(p) Pm−1 i=1 th(i+1) p −thip count(i+1) p −countip , where dfp(x)
dxp is the slope of the throughput curve for request type p. In this expression, i represents an interval of time (where the typical interval duration is on the order of a second) and the sequence of m intervals represents the m most recent time intervals from the current time, thi
p represents throughput achieved for a
specific request typepduring an interval i, andcounti p
represents the number of requests for request typepthat arrived during the interval i. This expression allows us to normalize for burstiness by considering the slope of the throughput curve over a sliding window of time, rather than at distinct points in time. It also enables us to generate a separate throughput curve slope per request type, and sum these values to get an estimate of the overall health of the application server.
With respect to Figure 4, we characterize a given application server as either dispatchable or non-dispatchable. A dispatchable application server cor-responds to a lightly loaded server, while a non-dispatchableapplication server corresponds to a heavily loaded application server. At an implementation level, this maps to the scenario where dfp(x)
dxp ≤0 for most or all of the throughput curves for the individual request
typesp.
The goal of the ReDAL approach, intuitively, is to keep all application servers in its control under “acceptable” throughput thresholds, i.e., the goal here is not to “balance” load per se, but rather to keep the cluster in a stable (not overloaded) state as long as
possible – balancing load is an ancillary effect. Here,
“balanced” load refers to the distribution of requests across an application server cluster such that the load on each application server is approximately equal.
The mechanism the algorithm follows to achieve this goal is as follows: at decision times, i.e., when a request needs dispatching, it attempts to send the request to an
affined dispatchable server (i.e., the server where the immediately prior request in the session was served), failing which it attempts to send the request to the “least loaded” dispatchable server, and finally, if the above two conditions cannot be met, sends it to the “least loaded” server overall. Clearly, we must first figure out the load levels of servers, which we can then mapped to dispatchability.
ReDAL follows a capacity reservation procedure to judge load levels. At an intuitive level, this ca-pacity reservation mechanism is based on two key premises. First, it assumes that the think-time or view-time between user actions is predictable, based on past behavior. This is a valid assumption – previous research (e.g.[24]) on online user behavior shows that think-time is highly predictable. Second, it assumes that session affinity, where consecutive requests in a given user session are handled by the same application server instance, will improve performance. We show the validity of this assumption through the experimental results in Section III.
We now describe the capacity reservation procedure in detail. Consider an application serverAk processing
y sessions. Assume that it is desired to keep the server under a throughput ofT. Further, it takeshseconds, on average, between consecutive requests inside a session (this is referred to as think time) and that the system, at any given time, considers the state of this application server G seconds into the future. Given this infor-mation, for tractability, let us partition the lookahead periodGintoC distinct time slices of durationd. Such partitioning allows us to make judgments effectively – given that we are attempting to compute a decision metric (throughput in this case), it is easier and more reliable to monitor this metric over discrete periods of time, rather than performing continuous dynamic monitoring at every instant.
In terms of the capacity reservation procedure, given
y sessions in the current time slice, we assume that each of these sessions will submit at least one more
request. Clearly, these requests are expected to arrive in a time slicehunits of time away from the current slice, in time slice ch. This prompts us to reserve capacity for the expected request in this application server in
ch. More accurately, when a request r arrives at an application server Ak at time t, assuming that this request belongs to a session S, we reserve a unit of capacity (sufficient to service a request) on Ak for the time slice containing the time instantt+h. Note that this reflects our desire to preserve affinity – we assume that all requests for sessionS will, ideally, be routed to Ak. Such rolling reservations provide a basis for judging expected capacity at an application server. To dispatch a request, if dispatching the request to the affined server is not possible, we check the different application servers in the cluster to see which ones have the property that the amount of reserved capacity in the current time slice is under the desired maximum throughput T, and choose the least loaded server among them.
If all the application servers are found to be in non-dispatchable state, we have two options: (a) we can send the request to the application server with the least load at the current time; or (b) we can delay the dispatching decision until some server becomes dispatchable – since the overall system is not fully deterministic, the first dispatchable server may not be the server that would have been chosen under option (a).
Thus, we consider two variations on our algorithm to handle the case where no server is in a dispatchable state: standard ReDAL, and a modified version of ReDAL, which we will call ReDAL-W for ReDAL-Wait. In standard ReDAL, the request is queued at the application server to which it was dispatched until the application server has finished processing prior requests, and has the capacity to service the request. In ReDAL-W, the new request is not sent immediately to any particular application server instance, but rather placed into a queue on the ReDAL request dispatcher. Requests in this queue are dispatched to an applica-tion server only when the applicaapplica-tion server becomes dispatchable. Delaying the dispatching decision until a server becomes dispatchable takes advantage of addi-tional information available in the future, specifically which application server instance becomes dispatchable first, allowing us to make a more accurate dispatching decision than in the standard ReDAL case.
The above discussion, of course, does not account for every practical issue. In reality, we have to account for various other issues, e.g., the fact that the current request may actually be the last request in a session (in which case the reservation we have made is actually an overestimation of the capacity required), as well as the fact that we may have mis-estimated think time for
a particular request. The full ReDAL algorithm takes care of these practical issues.
B. System Architecture
The architecture of our proposed approach is similar to that shown in Figure 1. Our system consists of two main logical modules: (i) theApplication Analyzer, and (ii) the Request Dispatcher. The Application Analyzer and Request Dispatcher reside together on the web server as a plug-in (denoted as circles within the web servers in Figure 1).
The Application Analyzer is responsible for
char-acterizing the behavior of an application server as dis-patchable or non-dispatchable. This module monitors each application server’s throughput to generate a close approximation of the slope of the server’s throughput curve f(x), and designates a server as dispatchable if
df(x)
dx is positive, and non-dispatchable if df(x)
dx is zero
or negative. (We remind the reader that, as noted earlier in this section, it is not necessary to generate the exact throughput curve for an application server – we only need the slope of the curve.) These values are used by the Request Dispatcher module, which we describe next.
The Request Dispatcheris responsible for the
run-time routing of requests to a set of application servers according to our proposed request routing policy. To accomplish this, the Request Dispatcher monitors ex-pected and actual load on each application server. Upon receiving a request, the Request Dispatcher first deter-mines whether the request is part of an existing session. If so, it will direct the request to the application server owning the session, as long as the affined server is in a dispatchable state. Otherwise, it will send the request to the application server having the lowest expected load. Requests that initiate a new session are also routed to the least loaded application server. Though not shown in Figure 1, we assume that there is a session virtualization mechanism (as described in Section I) in place to enable session failover.1
C. Technical Details
We consider a set of application servers A =
{A1, A2, . . . , An} configured as a cluster, where a
cluster is a set of application servers configured with the same code base, and sharing runtime operational information (e.g., user sessions and EJBs). For the sake of simplicity, we assume that each application server
1Such mechanisms are provided with virtually every commercial application server, either as a native feature, or through the use of a DBMS. Third party solutions are also available.
Ak (k = 1, . . . , n) is identical, though our approach also applies in the case of heterogeneous application servers. A request r is a specific task to be executed by an application server. We assume that each request is part of a session, S, where a session is defined as a sequence of requests from the same user or client. In other words, S =< r1,S, r2,S, . . . , rs,S >, and rj,S
denotes thejthrequest inS. A set of web serversW = {W1, W2, . . . , Wn}dispatch application requests to the application servers in A. Based on this foundation, let us define some notions that will be used in our algorithmic description.
Think time (h) is defined as the time between
two consecutive requestsrj,S and rj+1,S, measured in seconds. Think time is computed as a moving average of the time between consecutive requests from the same session arriving at the cluster. The moving average considers the last g requests arriving at the cluster, where g represents the window for computing the moving average and is a configurable parameter.
A Time slice (ci) is defined to be a discrete time
period of duration d (in seconds, where d is greater than the time required to serve an application request) over which we record measurements for throughput on each application server. We consider a finite number of such time slices, C = {c0, c1, . . . , cC−1}, where c0
represents the current time slice, eachci(i= 0, . . . , C− 1) represents theith time slice, andC allows sufficient
time slices for reservationshseconds in the future, i.e.,
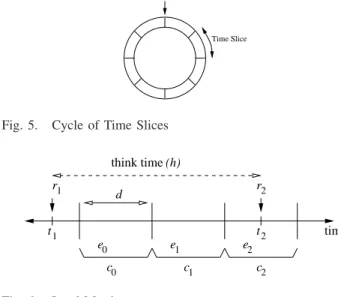
C =dhde. The C time slices are organized in a cycle of time slices for each application server, as shown in Figure 5. Each time slice will have an associated set of two load metrics,actual loadandexpected load, which are updated as new requests arrive and existing requests are served.
The Actual load(lt
k) of an application server Ak at
time t is defined as the number of requests arriving at
Ak within a time slice ci, such that t ∈ ci. (We drop the tsuperscripts when tis implicit from the context.) Intuitively,lt
k maintains the count of requests that have
been assigned to application serverkwithin the current time slice ci. For example, if 10 requests have been assigned to application server k since the start of ci, then lt
k= 10.
ThePredicted time slice. Consider a requestrj of a
sessionS arriving at time tp. The predicted time slice
cq of the subsequent request in the session, i.e., rj+1,
is the time slice containing the time instanttp+h such
that the request rj+1 is predicted to arrive at the time
instanttp+h.
TheExpected load(ek
i) of an application server Ak
for the time sliceciis defined as the number of requests
expected to be served by Ak during the time slice ci.
Current Time
Time Slice
Fig. 5. Cycle of Time Slices
t1 t2 r2 r1 c0 c1 c2 think time (h) e1 e2 e0 d time
Fig. 6. Load Metrics
Expected load is determined by accumulating the num-ber of requests that a given application server should receive duringci based on the predicted time slices for
future requests for each active session associated with
Ak.
Figure 6 helps to illustrate how expected load is determined. The figure shows a linear view of a partial cycle of time slices. Each time slice has an expected load counter. For instance, consider the cycle for Ak. Here, ek
0 represents the expected load counter for the
current time slice (c0), ek1 the expected load counter
for time slice c1, and so on. Suppose that request r1
in a particular session occurred at timet1, as shown in
the figure. From the think time (h), we can determine the time slice in which requestr2 is expected to arrive.
Suppose that, based on the think time, it is determined that request r2 will arrive at time t2, which occurs in
time slicec2 (refer to Figure 6). Thenek2, the expected
load for time slice c2, is incremented by one. This
effectively reserves capacity for this request on Ak
duringc2.
Since predicted time slices are not guaranteed to be correct, we may need to adjust the expected load to ac-count for incorrect predictions. An incorrectly predicted request may arrive either (a) in a time slice prior to its predicted time slice, or (b) in a time slice subsequent to its predicted time slice. In the former case, we simply decrement the expected load counter for the predicted time slice upon observing the arrival of the request in the current time slice. For example, referring to Figure 6, suppose that requestr2 actually arrives during
the current time slice (c0). In this case, the actual load,
l, for the current time slice is incremented, while the expected load,ek
2, for time slicec2is decremented. This
application server during the future time slice.
In the case where a request arrives subsequent to its predicted time slice, we have no way of knowing about this error until we reach the end of the predicted time slice. We can only estimate that this type of error will occur with a certain frequency. We account for this type of error in ourmodified load metric,mk, for
application serverAk, defined asmk =ltk+αek0, where
α(0< α≤1) is an expected load factor which adjusts for requests that arrive after their predicted time slices. Setting an optimal value ofαrequires first estimating think time, then adjusting alpha for the correctness of that estimate. There are multiple methods of estimating think time in the literature, e.g., based on the analysis of web logs [25] or logs generated with an HTTP packet sniffer [26]. Such logs provide data on the interarrival times for user requests, i.e., think time. Finding the correctness of think time estimates generated from such logs can be done with standard train and test techniques drawn from artificial intelligence – using two data samples, where an estimate of think time is generated using the first sample, and tested using the second sample to obtain a value for correctness of the think time estimate. For applications where the think time estimate is very accurate, higher values of α can be used (e.g., α= 0.9); the value of α should be reduced as the correctness of the think time estimate becomes less accurate.
We briefly summarize the above-described load met-rics. For a given application server, we maintain an expected load counter for each time slice. For the current time slice, we record the actual load by observ-ing the number of requests served by the application server. We then compute the modified load for the current time slice by summing the actual load and the adjusted expected load (adjusted to account for prediction errors).
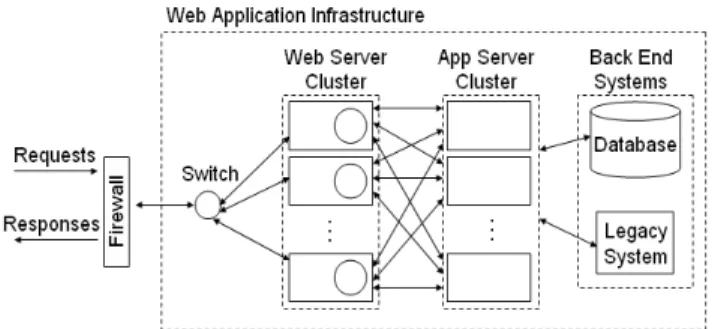
D. Handling Multiple Web Servers
The preceding discussion focused on the load metrics maintained by a single web server. In the best-practices recommended architecture [2], each web server dis-patches requests to a separate cluster, so there is no need to share load metrics across web servers. However, in practice, there are multi-web server environments (e.g., as depicted in Figure 7) in which multiple web servers dispatch requests to the same application server cluster. Since each web server runs its own instance of the Request Dispatcher, we must ensure that each Request Dispatcher accesses the same global view of load metrics. To accomplish this, each Request Dis-patcher maintains a synchronized copy of the global
Fig. 7. Web Application Architecture with Single App Server Cluster
view of load metrics. This global view is updated via a multicast synchronization scheme, in which each Request Dispatcher periodically multicasts its changes to all other Request Dispatcher instances. This data sharing scheme allows all Request Dispatcher instances to operate from the same global view of load on the application servers, and yet allows each instance to act autonomously. Another issue that arises in a multi-web server environment is computing think time given that consecutive requests from the same session may be sent to a different web server. To address this issue, each web server, upon sending an HTTP response, records the time that the response is sent in a cookie. Thus, if a subsequent request from this session is sent to a different web server, the new web server can retrieve the time of the last response and use it to compute think time.
It should be noted that this synchronization scheme adds very little overhead to the system, both in terms of network communications overhead and processing overhead. The communications overhead depends on the number of application servers, the number of time slices, and the storage space needed for the load met-rics. The number of web servers is not included in this computation because, in a multicast network, the number of recipients of a message (here, web servers are the recipients) doesn’t matter – the message is broadcast once and all recipients receive it. To reduce the potential for multiple web servers to assign requests to the same “least-loaded” server, the multicast interval should be set to ensure that synchronization of load metrics occurs multiple times per time slice.
For example, consider an application environment having 50 application servers and a think time (h) of 60 seconds2. If we assume a time slice duration (d) of 5 seconds, then the number of time slices (C) is
60/5 = 12. The load metric value and the current
throughput value can each be stored as 1-byte integers.
Since there is only a single value for each of the actual load and current throughput values, synchronizing this data across the web server plug-ins requires transmitting 2 bytes for each of the 50 application servers, and thus incurs 100 bytes of synchronization overhead. Trans-mitting expected load requires sending 12 bytes (1 byte for each time slice) for each of 50 application servers, incurring 600 bytes of synchronization overhead. Thus, the total synchronization overhead incurred for a web server cluster, summing the overheads for actual load, current throughput and expected load, is 700 bytes per transmission per web server. Considering the overhead for Ethernet protocol (42 bytes), IPV4 (20 bytes) and UDP (8 bytes) [27], the total network overhead per web server becomes 770 bytes per transmission. If we assume a UDP multicast interval of 1 second and 5 web servers (to serve the 50-application-server cluster), then the maximum overhead possible at any given time is 30.8 Kbps, which is negligible (less than 0.03%) in the context of the total capacity of a 100 Mbps network (and far less on gigabit networks, which are becoming increasingly prevalent in enterprise application infras-tructures).
With regard to processing overhead, a given Request Dispatcher performs n × C operations to apply the updates it receives from another Request Dispatcher. Since each Request Dispatcher applies the changes it receives to its own copy of the global view array, there is no locking contention.
A second potential issue can arise in the scenario where multiple web servers dispatch requests to the same application cluster (as depicted in Figure 7). In such a scenario, if a very large number of requests for new sessions arrive within this time interval, all the new requests will be sent to the same least-loaded application server. To prevent this from occurring, we implement a simple estimation scheme in the web servers, assuming a uniform distribution of this large number of requests for new sessions across the web server cluster. Here, each web server in the cluster maintains a separate estimated actual load value be-tween updates. For each request requiring a new session arriving at a given web server instance, the instance assumes that a similar request has arrived on all other clusters, and increments actual load for the least-loaded application server by one, and estimated actual load by the size of the cluster. This estimate is reset every time updated load values arrive from the other web servers in the cluster.
III. EXPERIMENTALRESULTS
In this section, we show the runtime performance of the ReDAL algorithm with a set of experimental
re-sults, comparing it to a widely used existing technique, specifically a commercial implementation of the RR scheme, and the HJ load balancing scheme. We consider two cases for the ReDAL algorithm with two different settings for theα parameter: ReDAL-ALPHA=0.9 and ReDAL-ALPHA=0.5 to show the impact of varying
α3; here, higher values ofα take greater advantage of ReDAL’s reservation scheme than lower values.
In this, we are interested in five particular questions: (1)How does throughput performance compare across the RR, HJ, ReDAL-ALPHA=0.5, ReDAL-ALPHA=0.9 and ReDAL-W-ALPHA=0.9 algorithms?, (2)How does response time performance compare across the RR, HJ, ALPHA=0.5, ALPHA=0.9 and ReDAL-W-ALPHA=0.9 algorithms?, (3) How do each of these policies impact CPU resource utilization on the web server?, (4) How does ReDAL impact CPU overheads on the application server? and (5) How is application server scaling affected by ReDAL?
A. Experimental Architecture
Our experiments were run using the general architec-ture described in Figure 1, with the addition of a load generation tool to simulate user requests, and a session clustering mechanism. As the topology described in Figure 1 is described as the “best possible topology” by IBM WebSphere scalability documentation [2], we primarily focus on this topology. Later in this section, we also demonstrate the impact of the topology depicted in Figure 7 on our ReDAL approach.
The experimental environment consists of a Load-Runner V6 load generator [28], which simulates client requests; several Apache HTTP Server V2.0 [29] web server instances; and several WebLogic Server V7.1 [30] application server instances. The number of web server and application server instances we use in our experiments are described in Table I. We use two Oracle 10g [9] database servers.
Of the two database servers, one stores application data. The other serves as a session object repository, which ensures that all session objects are accessible from each application server instance. Session access is implemented as an override of the HttpSession object, which connects to the database to read and write the session data, if not already residing in the application server’s memory space.
We have implemented the ReDAL algorithm as an Apache Web Server plug-in module, written in C++.
3We have found that α= 1is effective only in the case where there is no error in think time prediction in capacity reservation. This is not a realistic scenario; thus, we consider values ofαup to 0.9 in these experiments.
Parameter Values Base Value
Number of Web Servers 1, 2, 5 2
Number of Application Servers
10, 20, 30 20
TABLE I
EXPERIMENTALPARAMETERS
For the RR algorithm, we use the WebLogic Apache plug-in module, which implements a round-robin dis-patching policy. We have implemented HJ as an Apache plugin, adding support for statefulness (not addressed in [3]) through calls to an external session object repository.
The TPC-W [20] benchmark is used in all experi-ments. The TPC-W application is an online bookstore. One Oracle database 10g server is used to store the book and transactional data as described in TPC-W. The cardinality of the ITEM table in TPC-W in these experiments is 100,000. Fourteen user activities are defined in the TPC-W benchmark, of which 6 activities fall under the “browse” classification, and 8 activities fall under the “order” classification. Three different mixes (“Browsing”, “Shopping” and “Ordering”) of these activities are defined in TPC-W. For our experi-ments, we used the “Shopping” mix where 80% of the user actions fall under “browse” and 20% of the user actions fall under “order.”
The load generator is configured to simulate a vary-ing number of simultaneous user sessions, with each session submitting a stream of requests to the web server. Each request is chosen randomly as defined in TPC-W benchmark. Think time (h) between requests is set to a small number of milliseconds to allow us to minimize the number of threads required on the load generator, while still simulating significant loads on the experimental architecture.
Due to the short think times between requests, we must also use a small window size. For all experiments, the window size for ReDAL algorithm is set to 100 ms, i.e., d = 0.1. (In real life, think time is significantly longer than millisecond timeframes – typically, dis in the multi-second range.)
Sessions are stored to the external session repository (in an Oracle 10g database) as well as in the application server’s memory space. If a request arrives at an ap-plication server for a locally-stored session object, read speed is dramatically reduced over the external retrieval case. If a request updates a session object that resides on another application server, an invalidation message is sent to remove the object. This configuration is used in
the HJ and ReDAL cases, where session virtualization is required (RR does not require session virtualization). All machines used in the experiments are configured with a dual-core dual-CPU (1.5 MHz), 2 GB RAM, and 20 GB disk, and run Windows 2003 Server. All commu-nication takes place on a local area 100 Mbps Ethernet network. All application server instances are installed in 10 machines, deployed as follows: when we use 30 application servers, each machine is running 3 appli-cation server instances, when we use 20 appliappli-cation servers, each machine is running 2 application server instances and when we use 10 application servers, each machine is running 1 application server instance. Each web server instance is run on a separate machine. Thus when we are running 5 web server instances we have 5 machines dedicated for web servers. Three machines are used to simulate user sessions, and one of these three machines additionally hosts the Load Runner console which displays consolidated performance data.
In these experiments, we measure three performance metrics: (1) Throughput refers to the average number of transactions per second the cluster of application server provides. (2) Average Response Time (ART) refers to the average request response time that the cluster of application servers can provide. Throughput of the cluster and Average Response Time are measured from the perspective of the end user. (3) Web Server CPU Utilization(WSCU) refers to the percentage CPU utilization on the web server, as measured by operating system utilities.
B. Throughput Performance
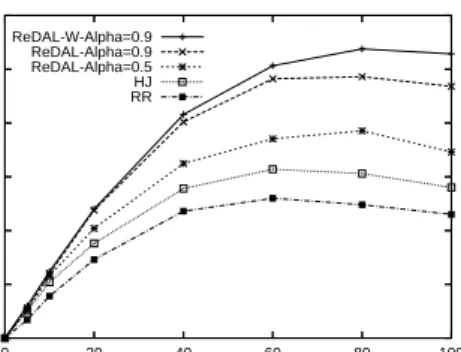
Figure 8 shows how throughput varies for
ReDAL-W-ALPHA=0.9, ReDAL-ALPHA=0.9,
ReDAL-ALPHA=0.5, HJ, and RR as the number of simultaneous sessions increases from 5 to 100 for 20 application servers and 2 web servers.
For all approaches, throughput shows an inverted “U” shape, i.e., throughput rises initially, peaks, and then falls. Throughput rises initially, as the arrival rate of requests increases, then peaks when a resource on the server reaches maximum utilization (e.g., CPU reaches 100%). Once a resource reaches its maximum usage, queuing for that resource begins, causing throughput to drop.
We now consider each curve relative to one another. For the ReDAL-ALPHA=0.5 curve, throughput/server peaks at 80 simultaneous sessions with 192 transactions per second per server. HJ and RR do not perform as well as ReDAL-ALPHA=0.5, both peaks at 60 simultaneous sessions, providing only 130 transactions per second per server in the RR case, and with 157 transactions
0 50 100 150 200 250 300 0 20 40 60 80 100 Throughput
Number of Simultaneous Sessions ReDAL-W-Alpha=0.9
ReDAL-Alpha=0.9 ReDAL-Alpha=0.5 HJ RR
Fig. 8. Average Throughput Per Application Server
per second in HJ case. The lower throughput in the RR case results from one or more of the application servers in the cluster reaching a resource bottleneck (in this case, CPU utilization reaching 100%) due to unbalanced load, bringing down the overall through-put on the cluster. This clearly shows the impact of maintaining balanced load across the application server cluster that ReDAL provides. The lower throughput in the case of HJ stems from the fact that HJ does not take advantage of session affinity, and needs to retrieve the session from external storage on every request. On the other hand, ALPHA=0.9 outperforms ReDAL-ALPHA=0.5, peaking at 80 simultaneous sessions and providing higher throughput, at 243 transactions per second per server. This shows the benefit of ReDAL’s reservation planning capability, which has greater im-pact as α is increased. The ReDAL-W-ALPHA=0.9 performs same as ReDAL-ALPHA=0.9 until all servers reach the saturation point (peak throughput). At sat-uration point, all servers become non-despatchable. Here, the ReDAL-W algorithm performs better than the ReDAL with peak at 269 transactions per seconds at 80 simultaneous sessions. The nominal improvement of our ReDAL-W is also seen at the load of 100 sessions where the throughput in case of ReDAL-W-ALPHA=0.9 is 264 transactions per second compared to 234 transactions per seconds in case of ReDAL-ALPHA=0.9.
C. Response Time Performance
Our response time experimental results, shown in Figure 9, show how ART varies for
ReDAL-W-ALPHA=0.9, ReDAL-ALPHA=0.9,
ReDAL-ALPHA=0.5, HJ, and RR as the number of simultaneous sessions increases from 5 to 100.
For all approaches, the ART curves are exponential. Here, response time is relatively flat initially, then begins to increase with each successive value for simul-taneous sessions. The points where the slopes of these
0 200 400 600 800 1000 0 20 40 60 80 100
Average Response Time (ms)
Number of Simultaneous Sessions ReDAL-W-Alpha=0.9
ReDAL-Alpha=0.9 ReDAL-Alpha=0.5 HJ RR
Fig. 9. Average Response Time
curves begin to increase sharply are closely correlated to the peaks in the throughput curves. Specifically, these “knee points” map exactly to the peaks in the ATAS curves. Here, as the arrival rate of requests increases, re-sponse time begins to increase sharply when a resource on the server reaches maximum utilization, at which point queuing begins, causing rising response times.
We now consider each curve relative to one another. For the ReDAL-ALPHA=0.5 curve, response time be-gins to increase sharply at 80 simultaneous sessions with a response time of 346 ms. RR does not perform as well as ReDAL-ALPHA=0.5; here, response time begins to increase sharply at a lower simultaneous session load of 60 sessions, and providing a response time of 662 ms at 80 simultaneous sessions. This underscores the point made with regard to throughput – maintaining balanced load across the application server cluster provides significant benefit. For the HJ case, response time is higher than the ReDAL-ALPHA=0.5 case, i.e., 440 ms at 80 sessions, reinforcing the points shown in the throughput experiment – that there is significant advantage in utilizing session affinity. On the other hand, ReDAL-ALPHA=0.9 outperforms ReDAL-ALPHA=0.5. While it begins to rise sharply at the same number of simultaneous sessions (80), it provides a lower average response time of 280 ms for 80 simultaneous sessions. This reiterates our point regarding the benefits of ReDAL’s reservation mechanism. Further, at high loads when all servers reach saturation point i.e. non-despatchable state, our ReDAL-W algorithm performs better than ReDAL. The ART value for 80 simultaneous users in the case of ReDAL-W-ALPHA=0.9 is 250 ms compared to 280 ms in case of ReDAL-ALPHA=0.9. Similarly, the ART value for 100 simultaneous users is less in the case of ReDAL-W-ALPHA=0.9 than ReDAL-ALPHA=0.9. This demonstrates the benefit of despatching a request only when an application server is ready to serve, which is done in our algorithm ReDAL-W. In most real life
0 2 4 6 8 10 12 0 20 40 60 80 100
Percentage CPU Utilization on the Web Server
Number of Simultaneous Sessions ReDAL
HJ RR
Fig. 10. Average CPU Utilization on the Web Server
scenarios, application servers are seldom operated at saturation point, i.e., in non-dispatchable states, so we focus our further experimental and real life studies on our standard ReDAL algorithm.
D. Peak CPU Usage on the Web Server
We show that the response time and throughput benefits of ReDAL come at a very low computational cost by considering the average CPU overheads on the web server, which is where the three approaches differ. Figure 10 shows shows how WSCU varies for ReDAL, HJ, and RR as the number of simultaneous sessions increases from 5 to 100 for 20 application servers and 2 web servers. Here, we show only the results forα= 0.9for the ReDAL case, since the value of α does not impact the work required for ReDAL. In addition, experiments showed that the impact of the single additional thread in case of ReDAL-W is so minimal that the percentage CPU utilization in case of ReDAL-W is almost same as the ReDAL case. Thus, we do not report the CPU utilization of the web server in case of ReDAL-W separately.
For all approaches, the WSCU curves are linear with a positive slope, i.e., CPU utilization increases with increasing simultaneous sessions. The RR approach shows the lowest overall WSCU, rising from 1.55% at 5 sessions to 8.5% at 100 sessions. The HJ case shows slightly higher values than RR, rising from 2% to 10.2%, due to the fact that it tracks more information about the application cluster than RR, essentially a count of active requests on each application instance. ReDAL also shows slightly higher WSCU values than RR, rising from 2.2% to 11.6%. These values are higher than that of RR and HJ because ReDAL not only maintains load information for application servers, but also exchanges that data across the web server cluster. Overall, this cost 3% additional CPU over RR, and 1.4% over the HJ case, a very low cost to pay to obtain the throughput and response time benefits shown above.
0 20 40 60 80 100 0 20 40 60 80 100
Percentage Peak CPU Utilization on the App Server
Number of Simultaneous Sessions ReDAL-Alpha=0.9 ReDAL-Alpha=0.5 HJ RR
Fig. 11. Peak % CPU on the Application Servers
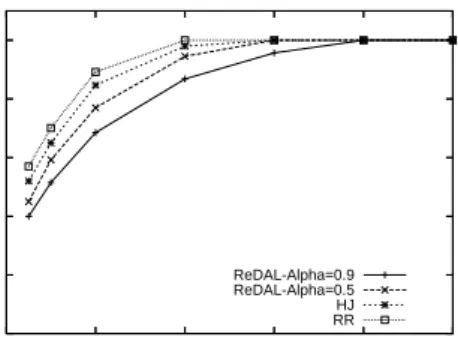
E. CPU Overheads on the Application Server
Here we demonstrate how the peak CPU of ap-plication server varies for different load distribution schemes. For each load distribution scheme, i.e., HJ, RR, and ReDaL, at each number of simultaneous sessions, we note the peak % CPU across twenty application servers with two web servers. We plot this peak % CPU vs. the number of simultaneous sessions in Figure 11. Due to highly un-balanced load distribution, the peak CPU % is higher in the case of RR and HJ than in the case of ReDal. Also, for RR and HJ, the peak CPU reaches 100% earlier than in the ReDal case. This is reflected in the increase in ART in Figure 9.
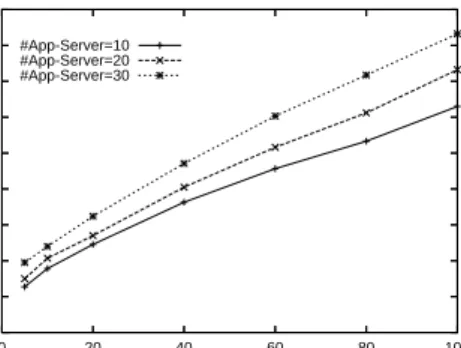
F. Scaling with Additional Application Servers
Figure 12 shows CPU usage on the web server for simultaneous sessions increasing from 5 to 100, for 10, 20, and 30 application servers running behind the two web servers. Each case uses ReDal, with α = 0.9, to distribute the request load across the application servers. The curves all increase as the number of simultaneous sessions increases – each additional session increases the number of requests that must be distributed across the application server set. The curves for 10, 20, and 30 application servers all show very similar CPU growth rates as the number of simultaneous sessions increase, with the 10-server case showing slightly lower CPU usage than the 20-server case, and the 20-server case showing slightly higher CPU usage than the 30-server case. Clearly, increasing the number of application servers results in increased CPU usage on the web server, due to the increased complexity in tracking the load states of more servers; however, this increase is very small – the difference between the 20-server and 30-server cases is about 4%.
G. Scaling with Additional Web Servers
Figure 13 shows how the ReDAL approach per-forms with varying numbers of web servers. In this
0 2 4 6 8 10 12 14 16 18 0 20 40 60 80 100
Percentage CPU Utilization on the Web Server
Number of Simultaneous Sessions #App-Server=10
#App-Server=20 #App-Server=30
Fig. 12. Scaling with Application Servers
experiment, we kept the number of application servers constant at twenty and varied the number of web servers to 1, 2 and 5, and measured end-to-end response time for each case. We consider two topologies in this experiment: (a) the hierarchical topology shown in Figure 1, in which each web server dispatches requests to a separate application server cluster (for 1, 2, and 5 web servers); and (b) the non-hierarchical topology shown in Figure 7 (for 5 web servers, marked ”NH” in Figure 13).
The first noticeable point about this set of plots is that the curves are clustered tightly together, showing that end-to-end response time does not vary significantly with the number of web servers. This is due to the fact that the primary bottleneck in the TPC-W bench-mark is the application server processing. The slight improvement in the performance with the increased number of web servers is due to the fact that the HTTP protocol and image request processing (which is the responsibility of the web server) is spread across a larger number of web servers.
We now consider the differences between the curves in Figure 13 based on topology. Topology begins to impact the ReDAL experimental setup when the number of web servers is greater than two – in both the hierarchical (Figure 1) and non-hierarchical (Figure 7) topology cases, when two web servers are deployed, they are typically fully synchronized for failover pur-poses, including any plug-in information. Thus, we do not show a curve here for “#Web Server=2 NH” because it is exactly the same as in the hierarchical case.
We are, therefore, interested in the curves for “#Web Server=5” and “#Web Server=5 NH”. The curve for “#Web Server=5 NH” shows a slight decrease (8% at the highest load levels) in performance as compared to the case of “#Web Server=5”. This is due to the additional overhead of sharing load metrics across the web server cluster when load and throughput data must be synchronized, as well as the slight increase in processing required to compute the load matrix for
0 100 200 300 400 500 0 20 40 60 80 100
Average Response Time (ms)
Number of Simultaneous Sessions #Web Server=1
#Web Server=2 #Web Server=5 #Web Server=5 NH
Fig. 13. Scaling with Web Servers
0 200 400 600 800 1000 1200 1400 1600 0 200 400 600 800 1000
Average Response Time (ms)
Number of Simultaneous Sessions ReDAL-Alpha=0.8
HJ RR
Fig. 14. Performance on Real World Application
all the application servers.
IV. CASE STUDY
To validate our experimental results, we tested the performance of our ReDAL algorithm in the staging environment of an online application at a major U.S. credit card issuer. In this staging environment, the application runs on 30 instances of WebLogic appli-cation server running on RedHat Linux 9.0, where the WebLogic cluster receives requests through an Apache HTTP server 2.0 running on Linux RedHat 9.0.
Load is distributed across the WebLogic cluster using WebLogic’s Apache plugin, which uses a Round Robin (RR) algorithm to distribute requests. User sessions are synchronized across the cluster using the WebLogic session synchronization mechanism.
We implemented two additional Apache plugins, representing the ReDAL and HJ algorithms, for per-formance comparison purposes. Based on anonymized web server logs from the application, we generated LoadRunner 6.0 [28] scripts to emulate user behavior. In Figure 14, we show the response time of the system as recorded by LoadRunner vs. the number of sessions connected to the system for ReDAL, HJ and RR.
For ReDAL, we variedαand found that we obtained optimal performance at α = 0.8 for the application. Thus, in Figure 14, we plot ReDAL for α = 0.8. As
can be seen from Figure 14, the response time is lowest in the case of ReDAL. The rate of change in the slope of the curve, i.e., the increase of response time as the num-ber of sessions increases, is also much lower for ReDAL than for HJ and RR. Though RR is the most widely used application server request distribution logic, it is a very rudimentary algorithm. In this study, HJ improves the response time by 25% at 1000 sessions, whereas our ReDAL improves the overall performance by 50% over RR. This demonstrates the applicability of our algorithm in a real-life case.
V. CONCLUSION
We devise an approach for distributing requests across a cluster of application servers such that overall system throughput is enhanced, and load across the application servers is balanced. Our approach considers two cases, one suited to clustered servers that are sized to handle peak load on the site, and a second case that is best suited for a highly loaded cluster of servers that operates beyond the saturation point. We compare the performance of our approach with widely used industrial and recently proposed techniques from the literature experimentally, in terms of throughput and response time performance, as well as resource utilization. Our experimental results show a significant improvement of up to nearly 80% in both throughput and response time, with a very low additional CPU cost, ranging from 0.7% to 1.5%. A case study validates the experimental results, also showing significant response time improvements.
REFERENCES
[1] L. Barroso, J. Dean, and U. Holze, “Web search for a planet: The google cluster architecture,”IEEE Micro, vol. 23, no. 2, pp. 22–28, March-April 2003.
[2] K. Ueno, T. Alcott, J. Blight, J. Dekelver, D. Julin,
C. Pfannkuch, and T. Shieh,WebSphere Scalability: WLM and Clustering, Using WebSphere Application Server Advanced Edition (IBM Redbook). IBM International Technical Support Organization, September 2000.
[3] S. Hwang and N. Jung, “Dynamic scheduling of web server cluster,” inProc of the ICPDS, 2002.
[4] V. Cardellini, E. Casalicchio, M. Colajanni, and P. Yu, “The state of the art in locally distributed web-server systems,” IBM Research Division, Tech. Rep. RC22209 (W0110-048), October 2001.
[5] Cisco, “Localdirector,” www.cisco.com.
[6] F5-Networks, “BIG-IP,” www.f5.com.
[7] G. Hunt, G. Goldszmidt, R. King, and R. Mukherjee, “Net-work dispatcher: A connection router for scalable internet services,”Computer Networks, vol. 30, no. 1-7, pp. 347–357, 1998.
[8] Linux Virtual Server Project, “Linux virtual server,”
www.linuxvirtualserver.org.
[9] Oracle, Inc., “Oracle 10g database server,”
http://www.oracle.com.
[10] IBM, “Websphere,” http://www.ibm.com.
[11] V. Pai, M. Aron, G. Banga, M. Svendsen, P. Druschel,
W. Zwaenepoel, and E. Nahum, “Locality-aware request dis-tribution in cluster-based network servers,” inProc. of the 8th ASPLOS, 1998.
[12] H. Elmeleegy, N. Adly, and M. Nagi, “Adaptive cache-driven request distribution in clustered ejb systems,” inProceedings of the Tenth International Conference on Parallel and Dis-tributed Systems, July 2004, pp. 179–186.
[13] BEA, “Weblogic server,” www.bea.com.
[14] Sun, “iplanet server,” wwws.sun.com.
[15] Microsoft, “Internet information services (iis),”
www.microsoft.com/iis.
[16] D. Menasce, D. Saha, S. da Silva Porto, V. Almeida, and S. K. Tripathi, “Static and dynamic processor scheduling disciplines in heterogeneous parallel architecture,”Journal of Parallel and Distributed Computing, vol. 28, no. 1, pp. 1–18, 1995.
[17] M. Colajanni, P. Yu, and D. Dias, “Scheduling algorithms for distributed web servers,” inProc. ICDCS’97, May 1997, pp. 169–176.
[18] R. Levy, J. Nagarajarao, G. Pacifici, M. Spreitzer, A. Tantawi, and A. Youssef, “Performance management for cluster based web services,” in Proceedings of the Eighth IFIP/IEEE In-ternational Symposium on Integrated Network Management, March 2003, pp. 247–261.
[19] A. Tannenbaum, Modern Operating Systems. Prentice Hall, 2001.
[20] Transaction Processing Performance Council, “Tpc benchmark w,” http://www.tpc.org/tpcw/default.asp, 2001.
[21] V. Viswanathan, “Load balancing web applications,”
http://www.onjava.com/pub/a/onjava/2001/09/26/ load.html?page=1, September 2001.
[22] Cisco, “The effects of distributing load randomly to servers,” Cisco White Paper, 1997.
[23] IBM, “Websphere application server,” www.ibm.com.
[24] J. Heer and Ed H. Chi, “Mining the structure of user activity using cluster stability,” Proceedings of the Web Analytics Workshop, SIAM Conference on Data Mining, 2002.
[25] I. Nino, B. de la Ossa, J. Gil, J. Sahuquillo, and A. Pont, “Carena: a tool to capture and replay web navigation sessions,” in Proceedings of the Workshop on End-to-End Monitoring Techniques and Services, 2005, May 2005.
[26] F. Smith, F. H. Campos, K. Jeffay, and D. Ott, “What tcp/ip protocol headers can tell us about the web,” in Proceedings of ACM SIGMETRICS 2001/Performance 2001, Cambridge, MA, June 2001, pp. 245–256.
[27] W. Stevens, B. Fenner, A. Rudoff, and R. Stevens, UNIX
Network Programming, Vol. 1: The Sockets Networking API, Third Edition. Addison-Wesley Professional, 2003.
[28] Mercury Interactive, “Loadrunner v6,”
http://mercuryinteractive.com.
[29] The Apache HTTP Server Project, “Apache http server v2.0,” http://www.apache.org.