What is better experimental design for
in vitro
comet assay to detect chemical genotoxicity?
Yu F. Sasaki1, Takanori Nakamura2 and Satomi Kawaguchi1,3
1Faculty of Chemical and Biological Engineering, Hachinohe National College of Technology, 2Faculty of Pharmaceutical Sciences, Himeji Dokkyo University,
3Kobuchisawa Research Laboratories, Fuji Biomedix Co., Ltd.
Corresponding author: Yu F. Sasaki
Faculty of Chemical and Biological Engineering, Hachinohe National College of Technology Tamonoki Uwanotai16-1, Hachinohe, Aomori 039-1192, Japan
Phone, Fax: +(81)-178-27-7296, [email protected]
Abstract
Now, the comet assay is used widely to detect chemical genotoxicity both in vitro and in vivo. There may be many important factors affecting the outcomes of in vitro comet assay, for example, exposure and sampling periods, used cells, S9 components, and electrophoresis condition. We have been questioning better experimental design to give good outcome of this assay. Followings are our tentative conclusions: (1) long sampling period should not be employed; (2) long exposure period should not be employed for chemicals that are unstable in culture media; (3) any eukaryotic cells can be used in this assay; (4) S9 components same as those used in the Ames test can be used to give good outcomes in this assay; and (5) although different kinds of DNA lesion can be detected at different pH condition during electrophoresis, alkaline (pH >13) condition is suitable for the comet assay as a genotoxicity test.
Keywords: in vitro comet assay, exposure period, sampling period, pH, cytotoxicity Abbreviations
B[a]A, Benz[a]anthrathene; BLM, bleomycin; E M S , e t h y l m e t h a n e s u l f o n a t e ; E N U , e t h y l nitrosourea; DEN, N-Nitrosodiethyamine; MNNG, N-methyl-N'-nitro-N-nitrosoguanidine; MNU, methyl nitrosourea; MMS, methyl methanesulfonate; 4NQO, 4-nitroquinoline 1 oxide; SSB, DNA single strand break.
Introduction
The Comet (alkaline single cell gel electrophoresis) assay is a rapid and sensitive procedure for quantitating DNA damage in mammalian cells [1, 2]. In this assay, cells are embedded in agarose, lysed in an alkaline buffer, and subjected to an electric current. Relaxed and broken DNA fragments stream further from the nucleus than intact DNA, so the extent of DNA damage can be measured by the length of the stream. Under alkaline (pH >13) conditions, the assay can detect single and double-stranded breaks, incomplete repair sites, alkali-labile sites, and also possibly both DNA–protein and DNA–DNA cross-links, in virtually any eukaryotic cell population that can be obtained as a single cell suspension. Compared to other genotoxicity assays, the advantages of this technique include: (1) high sensitivity for detecting low levels of DNA damage; (2) ability to detect
genotoxicity in the absence of mitotic activity; (3) the requirement for small numbers of cells per sample; (4) flexibility; (5) low costs; (6) easy application; and (7) the relatively short time period (a few days) needed to complete an experiment. During last two decades, this assay has developed into a basic tool for use by investigators interested in research areas ranging from human and environmental biomonitoring to DNA repair processes to genetic toxicology [2].
Now, the comet assay is used widely to detect chemical genotoxicity both in vitro and in vivo.
There may be many important factors affecting the outcomes of in vitro comet assay, for example, exposure period, sampling periods, used cells, S9 components, electrophoresis condition, and cytotoxicity. The main purpose of this article is to propose better experimental design to give good outcome of this assay based on our own data.
Materials and methods Cells and media
Human lymphoblastoid WTK1 and mouse lymphoblastoid L5178Y and L1220 cells were c u l t u r e d u s i n g R P M I 1 6 4 0 m e d i u m ( N i s s u i Pharmaceutical Co., Ktd.) supplemented with 10% horse serum (SAFC Biosciences), 200 µg/mL sodium pyruvate, and 200 µg/mL streptomycin at 37°C under
Yu F. Sasaki, et. al.
a 5% CO2 atmosphere. Human hepatoma HepG2 cells were grown in 1:1 mixture medium of Dulbecco MEM and Ham's F12 medium supplemented with 10% fetal bovine serum (HyClone Laboratories, Inc.). WTK1 and HepG2 cells were kindly provided by Dr. Honma, National Institute of Health Sciences.
Treatment
Cells were exposed to each mutagens for 0.5 - 24 h and comet slides were prepared immediately after and 24 h after the treatment. For mutagens not showing any cytotoxicity to used cells, the highest treatment concentration was 5000 µg/mL. For mutagens showing cytotoxicity to used cells, the highest treatment concentration was the concentration where cell viability (measured by the trypan blue exclusion test) immediately after treatment was ≧70 %. The treatment medium under S9 system contained 4 mM MgCl2 6H2O, 16.5 mM KCl, 2.5 mM glucose-6-phosphate, 2 mM NADPH, 2 mM NADH, 50 mM Na2HPO4, 50 mM NaH2PO4, and 5% S9 fraction. S9 fractions from the liver of rats pre-treated with phenobarbital/5,6-benzoflavone (PB/BF) and the livers of un-treated rats were from Oriental Yeast Industries Co. Ltd. and the Human and Animal Bridge Discussion Group in Japan (HAB), respectively. Human S9 fraction prepared from mixed samples of non-transplantable livers of 15 donors procured from the National Disease Research Interchange (NDRI) in Philadelphia, PA, with permission for research use, based on the international partnership between the NDRI and the HAB was obtained from the HAB.
Comet assay
Cells were embedded in LGT agarose (Nakalai Tesque, Kyoto, Japan) dissolved in saline at 1% following mutagen treatment. Then, comet slides were placed in a chilled lysing solution (2.5 M NaCl, 100 mM Na4EDTA, 10 mM Tris-HCl, 1% sarkosyl,
10% DMSO, and 1% Triton X-100, pH 10) and kept at 0°C in the dark for ≧60 min, then the slides were placed on a horizontal gel electrophoresis platform, and covered with pH>13 alkaline solution made up of 300 mM NaOH and 1 mM Na2EDTA or pH12
alkaline solution made up of 10 mM NaOH, 300 mM NaCl and 1 mM Na2EDTA for 20 min in the dark
at 0°C, then electrophoresis was conducted for 20 min at 25 V (0.96 V/cm, approximately 300 mA). Electrophoresis was conducted at 0°C in the dark for 20 min.
The slides were then neutralized and stained with 50 µL of 20 µg/mL ethidium bromide. Photographs of Comet images were taken using Fuji Neopan Presto 400 Black & White film and the length of the whole comet (head to tail) was measured manually using a scale for 50 nuclei for each dose and differences between the means in treated and control cultures were compared with the Dunnett test after one-way
ANOVA. A p-value less than 0.05 was considered statistically significant.
Detection of cytotoxicity
Cell lethality for each dose was determined by Trypan blue exclusion method at the time of each slide preparation. Cell lethality was also detected by the diffusion assay. Comet slides prepared as above were lysed for 1 h, then the slides were placed on a horizontal gel electrophoresis platform, and covered with pH>13 alkaline solution for 20 min without electrophoresis. The slides were then neutralized and stained with 50 µL of 20 µg/mL ethidium bromide. The frequency of diffused cells was scored.
In the study using HepG2 cells, cell growth for 24 h following to pro-mutagen-exposure was detected. HepG2 cells treated with pro-mutagens for 4 h were cultured in a fresh medium for 24 h under cytocharasin B and the frequency of binuclei cells (BNC) were scored.
Results and discussion Exposure period
As shown in Fig. 1, tail length induced by ENU decreases with exposure period. For MNU, tail length is almost same at any exposure period. Tail length induced by EMS peaked at 4 h and decreased at 24 h. Tail length induced by 4NQO peaked at 2 h and decreases at 4 - 24 h. Tail length induced by H2O2 peaked at 1 h and decreases at 2 - 24 h.
Their genotoxicity half time in Ham's F12 medium supplemented with foetal bovine serum is less than 2 h (Fig. 2).
In spite of well-known genotoxicity of tested mutagens, they tended to give negative results when CHO cells were exposed to them for 24 h. Based on our results, long exposure period should not be employed for chemicals that are unstable in culture media.
Sampling period
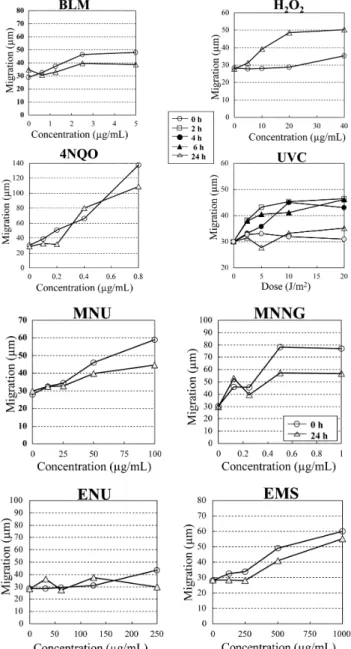
Although MNU, MMS, ENU, EMS, BLM H2O2, and 4NQO gave positive responses at both sampling periods, observed tail length was larger at 0 h than at 24 h (Fig. 3). Although UVC at 10 J/m2 gave positive
responses 2, 4, and 6 h after the irradiation, it gave negative response 0 and 24 h after the irradiation. Based on the results described above, for chemical mutagens, tail length is larger at short sampling period and it is considered that comet slides are better to be prepared immediately after the treatment.
pH condition at unwinding and electrophoresis
B L M g a v e p o s i t i v e r e s p o n s e s a t b o t h p H conditions, and tail length was almost same (Fig. 4). On the other hand, UVC, H2O2, and 4NQO gave
positive results at pH13 but not at pH12. Data are summarized in Table 1. When cells are treated with
base adduct-inducers or alkylating agents, the agents produce base adducts and alkylated bases that develop into SSBs and/or alkali-labile sites through repairing events [3, 4]. Thus, although the Comet assay is generally understood as a method to detect DNA initial lesions, it should be mentioned that this assay can detect SSBs developed from alkali-labile sites such as base adducts and alkyled bases under alkaline condition (pH>12.6) [5]. Therefore, while only SSBs are considered to be detected at pH12, SSBs and alkali labile sites are considered to be detected at pH13. Most studied mutagens were positive at pH13 only, and chemicals that considered to induce SSB, such as BLM, gave positive responses at pH12 and
Fig. 1. Comet assay of DNA taken from CHO cells exposed for various time periods to 8 mutagens.
CHO cells were treated for 0.5 – 24 h with ENU at 50 (△), 100 (▲), 200 (○), or 400 µg/mL (●); MNU at 12.5 (△), 25 (▲), 50 (○), or 100 µg/mL(●); EMS at 25 (△), 50 (▲), 100 (○), or 200 µg/mL (●); MMS at 5 (△), 10 (▲), 20 (○), or 40 µg/mL (●); ENNG 2.5 (△), 5 (▲), 10 (○), or 20 µg/mL (●); MNNG at 0.31 (△), 0.63 (▲), 1.25 (○), or 2.5 µg/ml (●); 4NQO at 0.048 (▲), 0.095 (○), or 0.19 µg/ mL (●); H2O2 at 0.75 (△), 1.5 (▲), 3 (○), or 6 µg/mL (●). The symbol □ indicates control. Significant difference: * p<0.05.
for norfloxacine. Norfloxacine treatment was 20 h. Then, comet slides were prepared immediately after the mutagen exposure. The comet assay was conducted at pH12 and pH13.
Fig. 2. Comet assay of DNA taken from CHO cells exposed to 8 mutagens that were pre-incubated in culture medium containing FBS for 0 – 4 h.
CHO cells were exposed for 1 h to culture medium in which mutagens at the concentrations shown in the figures had been incubated for 0 – 4 h. Each symbol shows relative induced migration value. Curves shown as broken lines are approximation polynomials calculated based on relative induced migration values.
Yu F. Sasaki, et. al.
pH13. Therefore, although different kinds of DNA lesion can be detected at different pH condition during electrophoresis, pH13 is superior to pH12 for the comet assay as a genotoxicity test.
S9 components
The pro-mutagens that are positive under each S9 system are shown in each circle (Fig. 5). Most studied pro-mutagens are positive under PB/BF-treated rat liver S9, and the number of positive pro-mutagens was larger under PB/BF-treated rat liver S9 than under un-treated rat liver S9. Most studied pro-mutagens are positive under both rat and human liver S9's. Only 2, phenacetin and IQ, are positive under human liver S9 but not under rat liver S9.
In in vitro genotoxicity studies, an S9 fraction prepared from the liver of rats pre-treated with PB/BF or PCBs is generally used as a model of metabolic activation system. Present results suggest that genotoxicity of some pro-mutagens is missed by the use of CYP un-induced rat liver S9 and that activating ability of rat liver S9 qualitatively parallels to that of human liver S9. Therefore, S9 system prepared from PB/BF treated rat liver is usefully used in the comet assay like as in other in vitro genotoxicity studies. And co-factor components same as those generally used in the Ames test and treatment for 4 h may be suitable for the comet assay.
Cytotoxicity
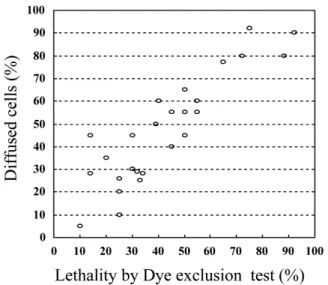
At the time of comet preparation, cell lethality was measured by trypan blue exclusion test and diffusion assay. As shown in Fig. 6, in WTK1 cells, results of the trypan blue exclusion test correlated well with those of the diffusion assay. Therefore, both methods may be equally used to detect cell lethality at comet preparation.
Cell death leads to DNA fragmentation. Therefore, it must be ascertained whether detected positive responses in the Comet assay are due to genotoxicity rather than cell death. In in vitro Comet assay, it
is possible to identify dead or dying cells by their specific Comet images or a dye exclusion test. Under alkaline conditions, necrotic or apoptotic cells can result in comet images with small or non-existent head and large diffuse tails [6–9]. To avoid obtaining false positive responses, this assay is generally conducted at the concentration range where cell lethality is ≦30% [10].
To know how cytotoxicity detected at comet preparation affect cell growth after mutagen-exposure, HepG2 cells were exposed to DEN, B[a]A, aniline HCl, and Trp-P-1 for 4 h in the absence of S9 mix. As shown in Fig. 7, DEN did not give positive responses in the comet assay at the concentration range where cell lethality was ≦30% (cell lethality data are not shown). B[a]A gave positive responses in the comet assay at the concentration range at where cell lethality was ≦30%. DEN and B[a]A did not decrease the frequency of BNC at 24 h after the treatment. Therefore, cells can growth after their treatment at the concentration where cell lethality at comet preparation is ≦30%. Aniline HCl and Trp-P-1 were comet-positive at the concentration range where cell lethality was ≦30%. Although cell lethality at comet preparation was ≦30% at 5000 µg/mL aniline HCl, BNC frequency decreased remarkably. Trp-P-1 was comet-positive at ≧10 µg/mL. Although cell lethality at comet preparation was ≦30% at ≧10 µg/mL Trp-P-1, BNC frequency decreased remarkably. Therefore, even if cell lethality is ≦30% at comet preparation, cells cannot growth after the treatment with 5000 µg/mL aniline HCl or ≧
10 µg/mL Trp-P-1. So, when cytotoxicity is measured affects outcomes of the Comet assay. In order to avoid false positive responses by DNA fragmentation due to cell death, Comet assay is generally conducted at the concentration range where cell lethality is ≦30%. In the case of Trp-P-1, therefore, if concentration range is decided using cell lethality data at comet preparation, Trp-P-1 is positive in the Comet assay. On the contrary, if concentration range is decided
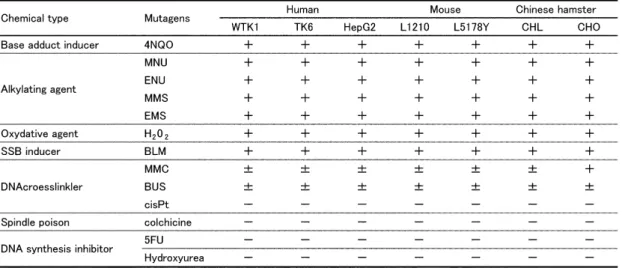
Table 2. Comet assay using 7 different kinds of cell lines.
using cytotoxicity data after 24 h recovery, Trp-P-1 is negative in the Comet assay. The positive responses by Trp-P-1 would show DNA damage causing cell death but not gene alteration, because cells cannot growth after its treatment. The positive responses by
≦2500 µg/mL anilin HCl would show DNA damage that can result in gene alteration, because cells can growth after its treatment. Therefore, even if cells cannot go into cell division after chemical treatment,
≦30% cell lethality at comet preparation would support that the positive comet responses are not false positive responses due to DNA fragmentation resulted from cell death. The importance is the interpretation of positive comet responses at the concentration range where cells cannot growth after chemical treatment.
or were irradiated to 10 J/m UVC. Then, comet slides were prepared immediately after the mutagen exposure. The comet assay was conducted at pH12 and pH13.
Fig. 5. Comet assay under different 3 kinds of S9 systems. WTK1 cells were treated for 4 h with various pro-mutagens under 3 kinds of S9 systems. Then, comet slides were prepared immediately after the mutagen exposure.
Pro-mutagens in the single-lined circle are positive under S9 fraction prepared form the liver of rats treated with PB/BF. Pro-mutagens in the broken lined circle are positive under S9 fraction prepared form the liver of un-treated rat. Pro-mutagens in the double-lined circle are positive under S9 fraction prepared form human livers of 15 donors.
Abbreviations for pro-mutagens: 2-AA, 2-Aminoanthracene; pAAB, p-Aminoazobenzene; AFB, Aflatoxin B1; 1-AP, 1-Aminopyrene; B[a]A, Benz[a]anthrathene; B[a]P, Benzo[a]pyrene; CYP, Cyclophosphamide; DAB, p-Dimet hylaminoazobenzene; 2,4-DAT, 2,4-Diaminotoluene; DBN, N-Nitrosodibutylamine; DCB, 3,3'-Dichlorobenzidine; DEN, N-Nitrosodiethyamine; DEolN, N-Nitrosodiethanolamine; DMH, 1,2-Dimethylhydrazine; DMN, N-Nitrosodimethylamine; DPN, N-Nitrosodipropylamine; EMN, N-Nitrosoethylmethy lamine; 1-NA, 1-Naphthylamine; 2-NA, 2-Naphthylamine; NMOR, N-Nitrosomorpholine; 1-NN, 1-Nitronaphtherene; 1-NP, 1-Nitropyrene; NPIP, N-Nitrosopiperidine; NPYR, N-Nitrosopyrrolidine.
Fig. 3. Comet assay of DNA taken from WTK1 cells following to various sampling periods.
WTK1 cells were treated for 2 h with ENU, MNU, EMS, MNNG, 4NQO, BLM, or H2O2 or were irradiated to UVC.
Then, comet slides were prepared immediately after or 24 h after the mutagen exposure.
Yu F. Sasaki, et. al.
Cell lines
To query which cell lines are suitable for the comet assay, 7 different kinds of cell lines were used for the Comet assay. WTK1, TK6, and HepG2 cells are from human, L5178Y and L1220 cells are from mouse, CHL and CHO cells are from Chinese hamster. There is no qualitative discrepancy in comet outcomes in any cell lines used (Table 2). Since the comet assay can detect alkali-labile sites and SSBs, the negative data with spindle poisons and DNA synthesis inhibitors are reasonable. DNA crosslinks can inhibit DNA fragmentation under alkali condition, inconclussive data with crosslinkers are expected. And, as expectedly, alkylating agents, oxydative agent, and base adduct inducer were positive in all
cell strains. Present results suggest that there would be no cell lines that are unsuitable for the Comet assay.
Conclusion
To obtain good outcome in the Comet assay, followings should be taken into the consideration. There would be no cell lines that are unsuitable for the comet assay. Long treatment period is not suitable. Sampling immediately after the treatment is better. S9 components same as used in the Ames and cytogenetics tests are usefully used in this assay. Unwinding and electrophoresis at pH13 are suitable for this assay as a genotoxicity test. The Comet assay should be conducted at the concentration range where cell lethality at comet preparation is ≦
30%, in order to avoid false positive responses due to DNA fragmentation resulted from cell death. The positive comet responses at the concentration range where cells cannot growth would not show DNA damage forming gene alteration. The importance is the interpretation of positive comet responses at the concentration range where cell cannot growth after chemical treatment.
References
1. Singh, N.P., M.T.McCoy, R.R. Tice and E.L.Schneider (1988) A simple technique for quantitation of low levels of DNA damage in individual cells, Exp. Cell. Res., 175, 184-191. 2. Fairbairn, D.W., P.L. Olive and K.L. O'Neill (1995) The
Comet assay: a comprehensive review, Mutation Res., 339, 37-59.
3. Olive, P.L., D. Wlodek, R.E. Durand, and J.P. Banath (1992) Factors influencing DNA migration from individual cells subjected to gel electrophoresis, Exp. Cell Res., 198, 259-267.
4. Pfuhler, S. and H.U. Wolf (1996) Detection of DNA-crosslinking agents with the alkaline comet assay, Environ. Mol. Mutagen., 27, 196-201.
5. Friedberg, E.C. (1984), DNA Repair, Freeman Co., New York.
6. P.L. Olive, J.P. Banath, Sizing highly fragmented DNA in individual apoptotic cells using the Comet assay and a DNA crosslinking agent, Exp. Cell. Res. 221 (1995) 19-26. 7. L. Henderson, A.Wolfreys, J. Fedyk, C. Bourner,
S.Windebank, The ability of the Comet assay to d i s c r i m i n a t e b e t w e e n g e n t o x i n s a n d c y t o t o x i n s , Mutagenesis 13 (1998) 89-94.
8. A. Hartmann, E. Kiskinis, A. Fjaellman, W. Suter, Influence of cytotoxicity and compound precipitation on test results in the alkaline Comet assay, Mutat. Res. 497 (2001) 199-212.
9. M. Kiffe, P. Christen, P. Arni, Characterization of cytotoxic and genotoxic effects of different compounds in CHO K5 cells with the Comet assay (single-cell gel electrophoresis assay), Mutat. Res. 537 (2003) 151-168.
10. TiceR.R., E. Agurell, D. Anderson, B. Burlinson, A. Hartmann, H. Kobayashi, Y. Miyamae, E. Rojas, J-C Ryu, Y.F. Sasaki(2000) The Single Cell Gel/Comet Assay: Guidelines for In Vitro and In Vivo Genetic Toxicology Testing, Environ. Mol. Mutag. 35, 206-221.
Fig. 7. DNA migration and cell growth in HepG2 cells.
HepG2 cells were treated for 4 h with DEN, B[a]A, aniline HCl, or Trp-P-1, and then cells were cultured in a fresh medium for 24 h under cytocharasin B and the BNC frequency were scored. Comet assay was conducted immediately after the treatment. △, BNC frequency; □, DNA migration; Closed symbols indicate significant difference at p<0.05.
Fig. 6. Correlation between cell lethality and frequency of diffused cells in WTK1 cells.
Cell lethality and diffused cell frequency were detected by trypan blue exclusion test and diffusion assay, respectively, in WTK1 cells immediately after the treatment with various mutagens for 2 h.