Intrusion detection in MANET using classification algorithms: The effects
of cost and model selection
Aikaterini Mitrokotsa
a,⇑, Christos Dimitrakakis
b aSecurity and Cryptography Laboratory (LASEC), School of Computer and Communication Sciences, EPFL, Station 14, CH-1015 Lausanne, Switzerland b
Artificial Intelligence Laboratory (LIA), School of Computer and Communication Sciences, EPFL, Station 14, CH-1015 Lausanne, Switzerland
a r t i c l e
i n f o
Article history:
Received 20 November 2011 Received in revised form 9 April 2012 Accepted 16 May 2012 Available online xxxx Keywords: Intrusion detection Classification algorithms Cost-sensitive classification Mobile Ad-hoc Networks (MANETs)
a b s t r a c t
Intrusion detection is frequently used as a second line of defense in Mobile Ad-hoc Net-works (MANETs). In this paper we examine how to properly use classification methods in intrusion detection for MANETs. In order to do so we evaluate five supervised classifica-tion algorithms for intrusion detecclassifica-tion on a number of metrics. We measure their perfor-mance on a dataset, described in this paper, which includes varied traffic conditions and mobility patterns for multiple attacks. One of our goals is to investigate how classification performance depends on the problemcost matrix. Consequently, we examine how the use of uniform versusweighted cost matrices affects classifier performance. A second goal is to examine techniques for tuning classifiers when unknown attack subtypes are expected during testing. Frequently, when classifiers are tuned using cross-validation, data from the same types of attacks are available in all folds. This differs from real-world employment where unknown types of attacks may be present. Consequently, we develop asequential cross-validation procedure so that not all types of attacks will necessarily be present across all folds, in the hope that this would make the tuning of classifiers more robust. Our results indicate that weighted cost matrices can be used effectively with most statistical classifiers and that sequential cross-validation can have a small, but significant effect for certain types of classifiers.
Ó2012 Elsevier B.V. All rights reserved.
1. Introduction
Mobile Ad hoc Networks (MANETs) present many important advantages and have been employed in a broad range of applications such as emergency services [16], pollution monitoring [6] and vehicular networks [31]. MANETs are dynamic peer-to-peer networks, which em-ploy multi-hop information transfer without requiring an a prioriinfrastructure. Due to their nature, they have un-ique security requirements. We must guard not only against usual attacks such as denial of service, but also against selfish and malicious nodes more generally. While intrusion prevention can be used as a first line of defence,
these types of attacks cannot be prevented directly. In addition, intrusion detection can be used as a mechanism for indicating possible security failures in the system.
A simple way to perform intrusion detection is to use a classifier in order to decide whether some observed traffic data is ‘‘normal’’ or ‘‘abnormal’’. In the simplest case, the classification objective is to minimise the probability of er-ror. However, in problems such as that of intrusion detec-tion, authentication and fraud detecdetec-tion, the goal is not simply to predict the class with highest probability, but to actually take the decision with the lowest expected cost. For example, in intrusion detection, the cost of having an undetected attack is usually much more severe than trig-gering a false alarm. In cost-sensitive classification, decisions are made in order to minimise the expected cost, rather than the probability of error. The concept of
1570-8705/$ - see front matterÓ2012 Elsevier B.V. All rights reserved. http://dx.doi.org/10.1016/j.adhoc.2012.05.006
⇑Corresponding author.
E-mail addresses: katerina.mitrokotsa@epfl.ch (A. Mitrokotsa), christos.dimitrakakis@epfl.ch(C. Dimitrakakis).
Contents lists available atSciVerse ScienceDirect
Ad Hoc Networks
cost-sensitive classification has been already investigated in wired networks[26].
This paper examines how to properly use classification methods in intrusion detection for MANETs. We perform a comparison of the performance of four well known classi-fiers. We extend our previous approach[25]in wireless ad hoc networks, where we only investigated simple cation, to cost-sensitive classification, i.e. making classifi-cation decisions that minimise the expected cost, rather than the probability of misclassification, and measure its effectiveness for each classifier under consideration. We also address a common problem in intrusion detection applications: the fact that in real world deployment, the data distribution can be very different from that in the training set. This will for example be the case if new at-tacks are seen which were not present in the training data. In order to do this, we use a variant of the well-knownk -fold cross validation method. This method partitions the training dataset inkparts, and iteratively trains the classi-fier onk1 parts, while keeping the remainder for valida-tion. This can be used to select classifier parameters that will also have good performance in unseen data. While normally the partition is random, in this paper we also examine asequentialpartition. Due to our method of data collection, this guarantees that most attacks will only be present in some folds. Consequently, this mimics real-world conditions more accurately, since some attacks will never be present during training. Ultimately, this enables us to make a less optimistic tuning of the classifiers’ hyper-parameters and hopefully to a more robust performance. The cross-validation and hyper-parameter selection meth-od is described in detail in Section4.2. We compare this sequentialcross-validation method with standardrandom cross-validation both in terms of classification error and in terms of expected cost.
More precisely, the contributions of this paper are the following: (a) Firstly, we perform a thorough comparison of four well-known classification algorithms for intrusion detection in Mobile Ad hoc Networks (MANETs), for both simple and cost-sensitive classification. (b) Secondly, we investigate how the performance of the classifiers is af-fected if the tuning of the hyparameters has been per-formed with random or sequential cross-validation.
All experiments are reported on datasets produced via extended simulations; consequently the ground truth is al-ways known. We perform an unbiased comparison, where-by we tune the hyperparameters of all five models, using a proper experimental protocol, where the algorithms are tuned before seeing any actual test data.
In all cases, we compare the performance of the classi-fication models under different traffic conditions, includ-ing: the mobility of the network, the number of malicious nodes, the sampling interval time (i.e. the amount of time statistics are collected before the classifier makes a decision) and the type of attacks. For the perfor-mance comparison we use five well-known and efficient classification algorithms (i.e. MultiLayer Perceptron (MLP),Linearclassifier,Naïve Bayesclassifier, Gaussian Mix-ture Model (GMM), Support Vector Machines (SVMs)). For the performance comparison with and without cost-sensi-tive classification we use four of them since the
employment of cost-sensitive classification in Support Vector Machines (SVMs) is not a proper probabilistic mod-el. We have selected features from the network layer for MANET and we investigate the performance of the classifi-cation algorithms for four types of attacks (i.e.Black Hole,
Forging,Packet DroppingandFloodingattacks).
The remainder of the paper is organised as follows. Sec-tion2describes the related work while Section3describes the quality metrics used for the comparison of the em-ployed classification models. Section4describes the simu-lation environment and the experimental results, while Section5concludes the paper.
2. Related work
Intrusion detection is a mature field in network secu-rity. While there are many possible approaches, such as rule-based systems [37] and anomaly detection systems
[28], this paper focuses particularly on systems based on classification algorithms. In particular, we investigate
how these algorithms can be employed most
appropriately.
Classification algorithms have been extensively used for intrusion detection, and especially for wired networks. The amount of work reported on for classification-based intru-sion detection in wireless ad hoc networks is more limited. More specifically, Zhang and Lee[39]proposed the first (high-level) Intrusion Detection System (IDS) approach specific for ad hoc networks. They proposed a distributed and cooperative anomaly-based IDS, which provides an efficient guide for the design of IDS in wireless ad hoc net-works. They focused on an anomaly detection approach based on routing updates on the Media Access Control (MAC) layer and on the mobile application layer.
Huang and Lee[15]extended their previous work by proposing a cluster-based IDS, in order to combat the re-source constraints that MANETs face. They use a set of sta-tistical features that can be derived from routing tables and they apply the classification decision tree induction algo-rithm C 4.5 in order to detect ‘‘normal’’ versus ‘‘abnormal’’ behaviour. The proposed system is able to identify the source of the attack, if the identified attack occurs within one-hop.
Deng et al. [7] proposed two distributed intrusion detection approaches, based on a hierarchical and a com-pletely distributed architecture respectively. The intrusion detection approach used in both of these architectures fo-cuses on the network layer and it is based on a Support Vector Machine (SVM) classification algorithm. They use a set of parameters derived from the network layer and suggest that a hierarchically distributed approach may be a more promising solution versus a completely distributed intrusion detection approach. Liu et al. [19] proposed a completely distributed anomaly detection approach. They used MAC layer data to profile the behaviour of mobile nodes and then applied cross-feature analysis[14]on fea-ture vectors constructed from the training data. Bose et al.
[2]proposed a cooperative and distributed intrusion detec-tion system that uses data from the MAC, routing and application layers, coupled with a Bayesian classifier.
Cabrera et al.[4]use an ensemble of classifiers obtained by training multiple C 4.5 classifiers and evaluate them on a MANET network for two types of attacks. Abdel-Fattah et al.[1]use the Conformal Predictor k-nearest neighbour and the Distance based Outlier Detection (CPDOD) algo-rithms to perform intrusion detection in MANETs against three types of attacks while Shim et al.[32]have used a cluster analysis technique in order to detect Sinkhole at-tacks in MANETs[12].
In standard classification problems the classification decision is selected in order to minimise the probability of error. However, in many problems, some errors are more serious than others. In such cases, each type of error is as-signed acost. The goal then is not to predict the most prob-able class but instead to take the decision that minimises the expected cost.
For instance, this requirement appears in authentica-tion problems. For most authenticaauthentica-tion systems, the cost of unauthorized access and is much greater than that of wrongly denying access to legitimate users. In the same vein, in intrusion detection systems raising a false alarm has a significantly lower cost than allowing an undetected intrusion. In such cases it is wiser to take the classifica-tion decision that has the minimum expected cost rather than the decision with the lowest error probability. Although this problem has been studied a lot, especially in the domain of optimal statistical decisions [21], it has been largely ignored in the field of intrusion detection. A number of other work has considered cost-sensitive intrusion detection. Fan et al. [11] and Pietraszek et al.
[30] both use wrapper algorithms (Meta-Cost [9] and Weighted [36] respectively), in conjunction with RIPPER
[5]. The work of Lee et al.[17]employs a decision mech-anism which directly compares response cost with deci-sion cost and either logs the detected intrudeci-sion or performs an appropriate response. However, the detection is implicitly assumed to be infallible, and so they do not actually consider the expected cost. A more general view of cost-sensitive intrusion response is taken in [34], which clearly shows an advantage for cost-sensitive deci-sions, as expected. An active-learning cost-sensitive ap-proach, employing Metacost, is examined by [20]. Finally, Ghodratnama et al.[12]have performed cost-sen-sitive classification using an approach similar to the one described in our previous work [25], based on the use of a k-nearest neighbour (KNN) classifier to estimate probabilities. Most of the above papers report results on KDD database since they investigate the use of cost-sensi-tive classification for the problem of intrusion detection in wired networks.
In our own previous work[25], we have investigated the problem of cost-sensitive classification in wired net-works, where we employed statistical classifiers to mini-mise the expected cost. The goal of the current paper is to measure the flexibility and robustness of a set of proba-bilistic methods under different costs and different net-work conditions. Firstly, we extend our previous net-work to wireless networks. Secondly, we examine the impact of different cross-validation mechanisms on the robustness of the classifiers. Finally, we see how much the expected cost and decision errors change in response to changes in
the dataset, classifiers and cost matrix employed. We find that, while some methods are well-behaved, others exhibit a large sensitivity.
In this paper, we perform a comparative analysis of classification algorithms for the problem of intrusion detection in MANETs. We use the same experimental pro-tocol (tuning of hyper-parameters) and training/testing data-sets generated through varying traffic conditions (regarding the mobility of the network, the number of malicious nodes and the types of attacks) in order to exam-ine the robustness of well-known classification algorithms; something quite important since the previous approaches investigate only a few of those classifiers and performance comparisons cannot be implemented since different data-sets are used each time. Additionally, the goals of our paper are: (a) to investigate if different cross-validation methods might improve the performance of the classifiers when un-known types of attacks appear in the test set and (b) how weightedclassification may improve the accuracy of classi-fiers for the problem on intrusion detection in MANETs. 3. Intrusion detection using classification
We employ statistical classification algorithms to order to perform intrusion detection in MANETs. Such algorithms have the advantages that they are largely automated, that they can be quite accurate, and that they are rooted in sta-tistics. For that reason, they are prime candidates for use in cost-sensitive classification problems. After training, they can be used for detection with arbitrary cost matrices. They have extended applications including intrusion detection in wired networks[18], they have been exten-sively studied, both theoretically and experimentally, and used in many applications with a high degree of success. 3.1. Intrusion detection model
The IDS architecture we assume is composed of multi-ple local IDS agents, which are responsible for detecting possible intrusions locally. However, during the training phase, we collect data locally, merge it and then use it to adapt the classifier models offline. During the testing phase, the resulting classification rule is transmitted to the local IDS agents, who then perform detection independently.
3.2. Cost-sensitive classification
All classifier models are trained so as to predict the probability of every class, given an observation. When using the models to make decisions, some types of errone-ous classification decisions may be more important to us than others. This can be modelled by specifying a set of cost for each type of error. This cost matrix can be used with any classifier that has been trained to predict class probabilities.
Given a specification of costs for correct and incorrect predictions, the class decision should be the one that leads to the lowest expected cost, where the expectation is com-puted using the conditional probability of each class given
the example, according to our model.1More formally, for a setXofkclasses let akkmatrixCsuch thatC(i,j) is the expected cost of predicting classiwhen the true class isj. Ifi=jthen the decision is correct, while ifi–jthe decision is incorrect. Furthermore, let Y, H be random variables denoting the actual and hypothesised class labels. For any observationsx2Xthe optimal decision will be the classi that minimises a loss function equal to the expected cost: Lðx;iÞ ¼E½CjX¼x;H¼i X
j2X
PðY¼jjX¼xÞCði;jÞ ð1Þ wherePðXjYÞdenotes the conditional distribution of class labels given an observation, according to our model. In this framework, all that is necessary is a model that can esti-mate this probability. The cost-sensitive decision-making functionf:S?Xwould then simply choose the definition ithat minimises the expected cost given the decision and the example.2More formally,
fðxÞ ¼arg min i2X
Lðx;iÞ: ð2Þ
The form of the cost matrixCwill depend on the actual application. In general, it is reasonable to choose the diag-onal entries equal to zero, i.e.C(i,j) = 0 fori=j, since correct classification normally incurs no cost. The other entries specify the cost of incorrectly misclassifying an example of classjas belonging to classi. They should be non-nega-tive if the diagonal is zero, i.e.C(i,j)P0 fori–j. Note that when this is equal to1, the cost measure is the same as the classification error(CE) measure.
As an example, consider a cost matrixCfor two classes, positive (1) and negative (2). The cost of afalse positiveis C(1, 2) and we can setC(1, 1) =C(2, 2) = 0, i.e. a correct clas-sification will have no cost. For intrusion detection applica-tions, it is common to refer to attacks as positive and normal instances as negative example.
A commonly used cost matrix is the one that measures theclassification error(CE):
C1ðy;y0Þ ¼ 0; if y¼y 0
1; if y–y0
ð3Þ
However, a false negatives (FN) is usually considered a worse kind of error than afalse positive(FP). The matrix C should reflect that, by having C(1, 2)PC(2, 1). For this reason, in this paper also considers the weighted cost ma-trixCW, shown inTable 1.
These matrices shall be used in two different ways. Firstly, to make decisions based on the class probabilities given by the classifier, as described in this section. Sec-ondly, to evaluate the quality of the decisions taken, will be described in the following section.
3.3. Algorithmic comparisons and quality metrics
When comparisons are made between algorithms, it is important to use the same measure of quality. For a given classification algorithmf:X!Y, whereXis the observa-tion space andYis the set of classes, a common measure of quality is the expected value of the costCmeasured over an independent test setD,
b EðCjDÞ ¼ 1 jDj X d2D CðfðxdÞ;ydÞ; ð4Þ wherexdis the observation of exampledandydis its class.
In this paper we shall perform the evaluation using two cost matrices. Firstly, C1, the uniform cost matrix, which measures theclassification error(CE). Secondly,Cw, (shown
inTable 1), the weighted cost matrix, which measures the weighted classification error(WCE).
However, in much of the literature, theDetection Rate (DR) and theFalse Alarm(FA) rate are used instead:
DR¼ TP
TPþFN; FA¼ FP
TNþFP ð5Þ
whereTP,TN,FP,FN, denote the number of true (TP,TN) and false (FP,FN) positives and negatives respectively. The goal of an effective intrusion detection approach is to re-duce to the largest extent possible the False Alarm rate (FA) and at the same time to increase theDetection Rate (DR). Since this is not usually possible, a trade-off between the two quantities is often sought instead. While such a trade-off may be automatically accomplished through the use of an appropriate cost matrix,3 in this paper we will only use these qualities as a secondary alternative compari-son metric.
3.4. Classification models
The computation of class probabilities is model-depen-dent. Ideally one would assume a Bayesian viewpoint and consider a distribution over all possible models in a set of models, however in this case we will only consider point distributions in model space, i.e. a single parameter vector in the parameter space. While this can cause problems with overfitting, we will use cross-validation to avoid this potential pitfall. All the models we use require labelled
Table 1
CWa weighted cost matrix for the 5-class problem.Ndenotes normal traffic, whileA1,A2,. . ., denote different types of attacks.
Class Decision N A1 A2 A3 A4 N 0 1 1 1 1 A1 10 0 1 1 1 A2 10 1 0 1 1 A3 10 1 1 0 1 A4 10 1 1 1 0 1
The implicit dependency on some modelmcan be made explicit by conditioning everything on the model. Then the expectation would be writtenE[Cjx,f,m] and the conditional class probabilityP(yjx,m).
2
Which of course is not necessarily identical to the decision with the minimum error probability. Furthermore, this framework is easily exten-sible to the case where the set of decisions differs from the set of class labels.
3L e t t h e e x p e c t e d c o s t b e E[C] =q P(H = 1 jC = 2)P(C= 2) +rP(H= 2jC= 1)P(C= 1) =q(1DR)P(C= 2) +rFA P(C= 1), where 2 denotes a positive example. Settingr= 1/P(C= 1) andq=k/P(C= 2) we obtain a cost function minimisingFAkDR, withkbeing a free parameter specifying the trade-off we are interested in.
training data for their creation. During this training phase, we do not make use of the cost matrix, but find the model parameters that minimise the classification error by cross-validation the training dataset. After training, each model under consideration returnsPðY¼yjX¼xÞ, the probability that the class isy, given that the current observation isx. During evaluation, the decision to be taken will depend on the cost matrix used. Thus, we plug in the return class probability to(1), to calculate the loss of each classification decision, and then we pick the decision with the minimum expected loss, according to(2).
The classification models we have used for intrusion detection are: the MultiLayer Perceptron (MLP), theLinear
model, the Gaussian Mixture Model (GMM), theNaïve Bayes
model and theSVMmodel. Some background information
about these models is given in Appendix A for
completeness. 4. Experiments
In order to examine the performance of the classifica-tion algorithms, we conducted a series of experiments un-der varying conditions. For each experiment, we first select hyper-parameters and train models on an independent training set, using cross-validation [24]. We compared two different cross-validation methods for hyperparame-ter selection. During this phase, no use of the cost matrix is made. The second phase jointly evaluates the algorithms, the hyperparameter selection method, as well as the effect of the cost matrix used for taking decisions, on an indepen-dent test set, generated from a new simulation run. We evaluate the methods on bothCEandWCE, as well as in
DRandFA.
4.1. Simulation environment
In order to evaluate our approach we simulated a Mo-bile Ad hoc Network (MANET) and we conducted a series of experiments. We have assumed that the network has no preexisting infrastructure and that the employed ad hoc routing protocol is the Ad hoc On Demand Distance Vector (AODV[29]). We implemented the simulator within the GloMoSim[13]library. Our simulation models a
net-work of 50 hosts placed randomly within an
850850 m2 area. Each node has a radio propagation range of 250 m and the channel capacity was 2 Mbps. The nodes in the simulation move according to the ‘ran-dom way point’ model. At the start of the simulation, each node remains stationary for a period equal to the pause time, then randomly selects and moves towards a destina-tion with a speed uniformly lying between zero and the maximum speed. On reaching this destination it pauses again and repeats the above procedure till the end of the simulation. The minimum and maximum speed is set to 0 and 20 m/s, respectively, and pause times at 0, 200, 400, 700 s. The simulation time of the experiments was 700 s, thus a pause time of 0 s corresponds to the continu-ous motion of the node and a pause time of 700 s corre-sponds to the time that the node is stationary.
Each node is simulated to generate Constant Bit Rate (CBR) network traffic at 2 Mbps. The size of the packets
sent by each node varies from 128 to 1024 bytes. We have studied the performance of the classification algorithms for various sampling intervals (5, 10, 15, 30 s) in order to study how quickly these algorithms can perform intrusion detec-tion. The sampling interval dictates both the interval for which the statistical features are calculated, and the period between each classification decision. We expect that long-er intlong-ervals may provide more information, but with the cost of slower detection. We have also evaluated the per-formance of the classification algorithms for 5, 15 and 25 malicious nodes. In each case the number of all nodes in the network is set to 50.
In our experiments, we have simulated four different types of attacks:
Flooding attack: We have simulated a Flooding attack
[38]for multiple paths in the network layer, where each malicious node sends forged RREQ (Route REQuest) packets randomly to all nodes of the network every 100 ms.
Forgingattack: We have simulated aForgingattack[27]
forRERR(RouteERRor) packets, where each malicious node modifies and broadcasts (to a selected victim) a
RERRpacket every 100 ms leading to repeated link failures.
Packet Droppingattack: We have simulated a selective
Packet Dropping [8]attack, where each malicious node drops allRERRpackets leading legitimate nodes to for-ward packets in broken links.
Black Holeattack: In aBlack Holeattack[33], a malicious node advertises spurious routing information, thus receiving packets without forwarding them but drop-ping them. In theBlack Holeattack we have simulated the scenario where each time a malicious Black Hole
node receives aRREQpacket it sends aRREP (RouteRE-Ply) packet to the destination without checking if the node has a path towards the selected destination. Thus, the Black Hole node is always the first node that responds to a RREQpacket and it drops the received
RREQ packets. Furthermore, the malicious Black Hole
node drops allRREPand data packets it receives if the packets are destined for other nodes.
An important decision is the selection of feature vectors that will be used in the classification. The selected features should be able to succinctly represent network activity, while differentiating between ‘‘normal’’ and ‘‘abnormal’’ activity. We have selected the following features from the network layer:
RREQSent:indicates the number ofRREQpackets that each node sends.
RREQReceived:indicates the number ofRREQpackets that each node receives.
RREPSent:indicates the number ofRREPpackets that each node sends.
RREPReceived:indicates the number ofRREPpackets that each node receives.
RERRSent:indicates the number ofRERR(Route Error) packets that each node receives.
RERRReceived:indicates the number ofRERRpackets that each node sends.
DataSent: indicates the number of Data packets that each node sends.
DataReceived: indicates the number of Data packets that each node receives.
Number of Neighbours:indicates the number of one-hop neighbours that each node has.
PCR(Percentage of the Change in Route entries): indicates the percentage of the changed routed entries in the
routing table of each node. PCR is given by
(jS2S1j+jS1S2j)/jS1j), where (S2S1) indicates the newly increased routing entries and (S1S2) indicates the deleted routing entries during the time interval (t2t1).
PCH(Percentage of the Change in number of Hop): indi-cates the percentage of the changes of the sum of hops of all routing entries for each node.PCH[35]is given by (H2H1)/H1, where (H2H1) indicates the changes of the sum of hops of all routing entries during the time interval (t2t1).
For each sampling interval time (5, 10, 15, 30 s) we have created one training dataset, where each training instance contains summary statistics of network activity for the specified interval using all the above features and in addition, the type of attack performed during this interval. This enables us to use supervised learning tech-niques for classification. Each training dataset was cre-ated by running different simulations with duration 700 s for different network mobility (pause time equal to 0, 200, 400, 700 s) and varying numbers of malicious nodes (5, 15, 25). The derived datasets from each of these simulations were merged and one training dataset was produced for each sampling interval. A similar pro-cedure was followed in order to produce the testing datasets.
4.2. Cross-validation and hyperparameter selection
Cross-validation [24] is an approach that has exten-sively been used as an unbiased hyper-parameter selection method for machine learning techniques. The main idea is that the training datasetDis split ink-folds (parts), such thatD¼Ski¼1Di with Di\ Dj=;for all i–j. For a given
choice of model and hyper-parameters, the following pro-cedure is performed forkiterations: At thei-th iteration, the subset Diis used for validating the classifier
perfor-mance, and the classifier is trained on the remaining data, i.e. onDnDi. The performance itself is measured onDi.
Con-sequently, we obtain a set ofkmeasurements, which are then averaged. The main question we pose in this paper is how to select the folds.
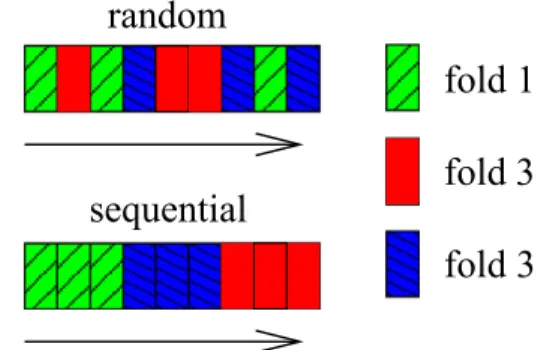
The usual procedure is to perform a random partition, i.e. to randomly assign folds to each data record, as seen at the top ofFig. 1. This is a usually a good choice for i.i.d data[10]. However, in intrusion detection the testing data-set can be significantly different from the training datadata-set. For that reason, we would like to have a procedure which is more robust to this. For that reason, we examined whether sequential cross-validation, which is illustrated at the
bottom of Fig. 1. This allocates folds sequentially, and may protect against the selection of too optimistic hyper-parameters.
In both cases, for our experiments we usedk= 10, thus obtaining10measurementsCEiof the classification error. For each hyper-parameter choicehin the set of candidates H, we recorded the average cross-validation classification error CEðhÞ ¼k1Pki¼1CEiðhÞ and selected the one with the lowest average error, i.e. h⁄= arg min
hCE(h). We then re-trained the classifier on the full dataset D, using h⁄.
The trained classifier was then evaluated on the indepen-dent test set using either a uniform or a weighted cost matrix.
For the MLP classifier we have tuned three parame-ters: the learning rate (
g
), the number of hidden units (nh)and thenumber of iterations (T)used in the stochastic gradient descent optimisation. For the selection of the most appropriate parameters, we have followed the fol-lowing procedure.Keepingnh equal to 0 we selected the appropriate
g
among values that range between 0.0001 and 0.1 with step 0.1 and the appropriateTselecting among 10, 100, 500 and 1000. Having selected the appropriateg
and the appropri-ate T, we examined various values in order to select the appropriate nh. We selected the best among 10, 20, 40, 60, 80, 100, 120, 140, 160, 320. Additionally, we used theMLPmodel with no hidden units as aLinearmodel. For theGMMwe also tuned three parameters, i.e. the threshold (
s
), thenumber of iterations (T)and thenumber of Gaussian Mixtures (ng). Keepingngfixed to 20, we se-lected the appropriates
from {101, 102, 103, 104} and the T2{25, 100, 500, 1000} For the selection of the appropriate ng, after selectings
,T we selected ng from {10, 20, 40, 60, 80, 100, 120, 140, 160, 320}. Additionally, we used the GMMmodel with one Mixture component as aNaïve Bayesmodel.
For theSVMwe tuned two parameters, i.e. the standard deviation (
r
) for the Gaussian kernel and the regularisation parameterc which represents the trade-off between the size of the margin and the number of misclassified exam-ples. For the selection of the appropriate combination ofr
andc, we selectedr
from {1, 10, 100, 1000} andc from {1, 10, 100, 1000}.Fig. 1.Cross-validation illustration on a dataset witht= 9 records. We perform 3-fold cross-validation. Each fold is represented by a different colour. In random cross-validation, folds are assigned randomly to each record. In the sequential variant, folds are assigned sequentially.
4.3. Experimental results
In the experiments, we compare the performance of classifiers tuned with either sequential or random cross-validation, on an independently generated testing dataset. Each classifier is combined with either a uniform or weighted cost matrix for making classification decisions. The performance is evaluated both in terms of the classifi-cation error (CE) and the weighted classification error (WCE). The expected result is that using the uniform cost matrix for classification will result in a lowerCEthan using a weighted cost matrix, while the converse will hold for
WCE.
Fig. 2depicts how theclassification error(CE) varies for each classifier when the tuning has been performed either randomlyorsequentiallyfor binary and multi-class classifi-cation. For these experiments we have used the training and testing datasets for different sampling intervals (5,
10, 15, 30 s) and took the average for all sampling intervals for each classifier. It is clear that theNaïve Bayesclassifier has the highest CE, while the lowest CE is achieved by theMLP. In the two-class case, we can see that the sequen-tial method significantly increases the robustness ofNaïve Bayes,MLPandSVM. However, it has no significant effect in the five-class case for any classifier apart from the
SVM. In general, theSVMappears to be extremely sensitive to the choice of cross-validation method. This is evident in
Fig. 3which depicts the cumulative differences inCE be-tweenrandomandsequentialschemes for the five classifi-ers under consideration for different sampling intervals (dt). We may conclude from these results that, when cross-validation.
Fig. 4a depicts the performance of four classifiers in termsCEfor the two and five-class problems when a uni-formor aweightedcost matrix is used. In the uniform case, the cost matrix is such that all misclassifications carry the same cost. In the second (weighted) case, failure to detect an attack has a cost 10 times greater than that of false alarms (seeTable 1). Theweightedmatrix significantly im-proves classification performance in the two-class case for all classifiers. In the five-class case however, we observe an opposite but much smaller effect. Neither of these two ef-fects are surprising since, in the five-class case we are effectively placing little importance in misidentifying at-tacks. This becomes clearer once we look at theweighted classification error(WCE).
In factFig. 4b depicts the performance of the same four classifiers for the same problems of binary and multi-class classification but this time in terms of theweighted classi-fication error(WCE). In both cases (binary and multi-class classification) we see the expected result that theWCEis lower when the weights of the classes are taken into con-sideration in the classification algorithm.
The differences between classification using weighted and uniform cost matrices are shown in more detail in
Fig. 5. This showsCEandWCEfor both the two-class and
Fig. 2.Classification error (CE) per classifier when tuning is performed either withrandomorsequentialcross-validation
Fig. 3.Cumulative differences in (CE) betweenrandomandsequentialcross-validation tuning. For every method shown, positive values indicate that randomtuning performs better thansequentialand vice versa. Results are given for sampling interval timesdt2{5, 10, 15, 20} and four different classifiers. It is clearly visible from this figure that, for the two-class problems, thesequentialtuning performs better. For the five-class problems, it is clear that the SVMclassifier’s performance is very sensitive.
Fig. 4.Performance of normal and weighted classification when we measure eitherCEorWCEfor 2 and 5 class problems.
Fig. 5.Cumulative difference betweenuniformandweightedclassifiers. Negative values indicated that theweightedclassifier is better. The first row (a and b) shows the relativeclassification error(CE), while the second row (c and d) shows the relativeweighted classification error(WCE). Results are shown for four different sampling interval times {5, 10, 15, 30}. It can be seen that using aweightedclassifier results in clearly better performance forWCE. When theCEis measured, theweightedclassifiers are slightly worse than theuniformclassifiers for the 5-class problem, and significantly better for the 2-class problem.
five-class case, for all classifiers, as the sampling interval time varies. It can be seen that in all cases,WCEis reduced when aweightedclassifier is used, as expected. In addition, there is an unexpected improvement inCE for the two-class case when aweightedclassifier is used.
Finally, we wanted to see what was the effect of varying the weighted cost matrixCWwith respect to theDetection Rate(DR), theFalse Alarm Rate(FA), theclassification error (CE) and theweighted classification error(WCE). For these
experiments, we have used the training and testing data-sets that correspond to sampling intervaldt15 s and per-formed binary classification. Overall, Fig. 6 shows that the classifiers behave ’nicely’, that is, the detection rate smoothly increases with the ratio. Thus, the class probabil-ities they output are a good measure of uncertainty. From
Fig. 6a, it is obvious that the highestDetection Rate(DR) is achieved for theMLPand theLinearclassifiers while the lowestDetection Rate (DR) for theNaïve Bayes classifier.
0 0.2 0.4 0.6 0.8 1 1 2 3 4 5 6 7 8 9 10 DR Ratio of FN to FP cost DR vs. Ratio of FN to FP Cost GMM MLP Linear Naive 0 0.2 0.4 0.6 0.8 1 1 2 3 4 5 6 7 8 9 10 FA Ratio of FN to FP cost FA vs. Ratio of FN to FP Cost GMM MLP Linear Naive 0 0.1 0.2 0.3 0.4 0.5 1 2 3 4 5 6 7 8 9 10 CE Ratio of FN to FP cost CE vs. Ratio of FN to FP Cost GMM MLP Linear Naive 0 0.1 0.2 0.3 0.4 0.5 1 2 3 4 5 6 7 8 9 10 Weighted CE Ratio of FN to FP cost Weighted CE vs. Ratio of FN to FP Cost
GMM MLP Linear Naive 0.5 0.6 0.7 0.8 0.9 1 1 2 3 4 5 6 7 8 9 10 DR Ratio of FN to FP cost DR vs. Ratio of FN to FP Cost Blackhole Packet Dropping Forging Flooding
Correspondingly, the highest False Alarm Rate (FA) and with high increase, as we increase the cost (ratioFNto
FP) is observed for theLinearandMLPclassifier. Thus, it is obvious that the classifiers that present the highest Detection Rate(DR) also present highFalse Alarm RateFA. The same picture holds forFA, with the differences being more pronounced, as can be seen inFig. 6b. It is interesting to see that, for example, the further the matrix is from uni-form, the less the classification error is (Fig. 6c).
The same holds for bothCEandWCEFromFig. 6c it is obvious that GMMis the most robust classifier, since it achieves the lowestclassification error(CE) uniformly for all classification costs. However, the Linear classifier on the other hand, as depicted inFig. 6d is more robust on terms of weighted classification error (weighted CE) even though its classification performance is suboptimal. A good compromise appears to be theMLPclassifier. Finally, we investigate how the cost affects the detection rate (DR) for different types of attacks. FromFig. 6e it is obvious that the effect is stronger for theForgingandPacket Dropping at-tacks, while the easiest attack to detect is theFlooding at-tack and the hardest atat-tack to detect is theBlack Hole.
5. Conclusions
This paper examined how to properly use classification methods in intrusion detection for MANETs. More pre-cisely, in this paper we have performed a thorough analysis of five well-known classifiers. We investigated: (i) Firstly, how simple classification versus cost-sensitive classifica-tion affects performance, both in terms ofclassification er-ror (CE) and in terms of weighted error (expected cost) (WCE). (ii) Additionally, we wanted to investigate how hy-per-parameter tuning affects performance when new un-known attacks are included in the test dataset. In order to achieve that we compared standardrandom cross-vali-dation withsequentialcross-validation, so that the valida-tion set in most folds would include previously unknown attacks. Inrandomcross-validation, all attack types are in-cluded in all folds. (iii) We perform a fair comparison of all classifiers, since we use the same datasets and tune their hyper-parameters based on the same procedure. The data-sets cover a broad range of conditions including various at-tack types, various levels of network mobility and malicious activity and finally different data collection intervals for the intrusion detection system.
Broadly speaking, the results show that surprisingly, the use of a cost matrix not only minimises expected cost (as we anticipated), but it also reduces the classification error for most classifiers (see Fig. 5). Consequently, intrusion detection is improved both with respect to classification error and with respect to cost. The sequential cross-valida-tion method had a limited amount of success. In the two-class case, it usually improved performance, while it had little effect in the five-class case. This could be attributed to the fact that the two are essentially different problems. For the first problem, it is sufficient to learn to distinguish normal from malicious traffic.
With respect to particular models, the experimental re-sults indicate that theNaïve Bayesclassifier has the poorest
performance while the best overall performance is achieved with the MLPclassifier. For the four out of five classifiers the cross validation method has no significant effect in the 5-class problem, while theSVMclassifier is very sensitive to this choice. For the two-class problems, a significant improvement is obtained with sequential cross-validation. Finally, we found thatcost-sensitive clas-sification, is more effective than error-minimising classifi-cation in terms of minimising the expected cost for all classifiers, which is an expected result. In addition, and perhaps somewhat surprisingly, it reduces theclassification error in the binary case significantly for all classifiers as well. Consequently, we believe that bothweighted classifi-cation matrices and sequential cross-validation tuning schemes should be part of the repertoire of intrusion detection practitioners who utilise statistical classifiers. A good direction of future work would be to validate our re-sults with real-world data or with simulators whose parameters are derived on real-world data such as mLab
[22,23].
Acknowledgements
This work was partially supported by the Marie Curie IEF Project ‘‘PPIDR: Privacy-Preserving Intrusion Detection and Response in Wireless Communications’’, Grant No. 252323 and the Marie Curie IEF Project ‘‘ESDEMUU: Effi-cient sequential decision making under uncertainty’’, Grant No. 237816.
Appendix A. Model details
This section describes the four models employed in some more detail.
MLPA specific instance of anMLPcan be viewed simply as a functiong:X!Y, wheregcan be further defined as a composition of other functionszi:X!Z. In most cases of
interest, this decomposition can be written asg(x) =Kw0z(x)
withx2X,wbeing a parameter vector, whileKis a partic-ular kernel and the function z(x) = [z1(x),z2(x),. . .] is re-ferred to as the hidden layer. For each of those, we have ziðxÞ ¼Ki
v
0ix
where each
v
i is a parameter vector, V= [v
1,v
2,. . .] is the parameter matrix of the hidden layer and finallyKiis an arbitrary kernel. For this particularappli-cation we wish to use anMLPm, as a model for the condi-tional class probability given the observations, i.e. PðY¼yjX¼x;M¼mÞ; y¼gðxÞ; ð6Þ for which reason we are using a sigmoid kernel forK. In the experiments we shall be employing a hyperbolic tangent as the kernel for the hidden layer, when there is one.
LinearThis is essentially a special case of anMLP. In par-ticular, when there is no hidden layer, we havezi=xi. This
is theLinearmodel, the second model into consideration.
GMMTheGMM, the third model under consideration, models conditional observation density for each class, i.e. PðX¼xjY¼y;M¼mÞ. This can be achieved simply by using a separate set of mixturesUyfor modelling the
obser-vation density of each classy. Then, for a given classythe density at each pointxis calculated by marginalizing over
the mixture componentsu2Uy, for the class, dropping the
dependency onmfor simplicity:
PðX¼xjY¼yÞ ¼
R
uPðX¼xjU¼uÞPðU¼ujY¼yÞ: ð7Þ Note that the likelihood functionPðX¼xjU¼uÞwill have a Gaussian form, with parameters the covariance matrixRuand the mean vector
l
u. The termPðU¼ujY¼yÞwill berepresented by another parameter, the component
weight.4Finally, we must separately estimateP
ðY¼yÞfrom the data, thus obtaining the conditional probability given the observations:
PðY¼yjX¼xÞ ¼1
ZPðX¼xjY¼yÞPðY¼yÞ; ð8Þ where Z¼Py2YPðX¼xjY¼yÞPðY¼yÞ does not depend on yand where we have again dropped the dependency onm.
Naïve BayesThe fourth model under consideration is the
Naïve Bayesmodel. This is a special case of the Gaussian Mixture Model (GMM) when there is only one Gaussian mixture.
SVMThe last model we evaluated is the Support Vector Machine (SVM)[3]model, which uses Lagrangian methods to minimise a regularized function of the empirical classifi-cation error. TheSVMalgorithm finds a linear hyperplane separation with a maximal margin in this hyperspace. The points that are lying on the margin are called support vectors. The main parameter of the algorithm isc, which represents the trade-off between the size of the margin and the number of violated constraints, and the kernel K(xi,xj). In this work we will utiliseSVMs with a gaussian
kernel of the formKðxi;xjÞ ¼pffiffiffiffi21prexpðkxixjk2=
r
2Þ.The conditional class probabilities from either Eq.(7)or
(8), depending on the model, can then be plugged into Eq.
(1), for calculating the decision function(2).
References
[1] F. Abdel-Fattah, Z. Md. Dahalin, S. Jusoh, Dynamic intrusion detection method for mobile ad hoc networks using CPDOD algorithm, International Journal of Computer Applications, vol. 2, Published by the Foundation of Computer Science, 2010. pp. 22–29. [2] S. Bose, S. Bharathimurugan, A. Kannan, Multi-layer intergraded anomaly intrusion detection for mobile ad hoc networks, in: Proceedings of the IEEE International Conference on Signal Processing, Communications and Networking (ICSCN 2007), February 2007, pp. 360–365.
[3] C.J.C. Burges, A tutorial on support vector machines for pattern recognition, Data Mining and Knowledge Discovery 2 (2) (1998) 121–167.
[4] J.B.D. Cabrera, C. Gutiérrez, R.K. Mehra, Ensemble methods for anomaly detection and distributed intrusion detection in mobile ad-hoc networks, In Information Fusion 9 (2008) 96–119.
[5] W.W. Cohen, Fast effective rule induction, in: Proceedings of the Twelfth International Conference on Machine Learning, Morgan Kaufmann, Lake Taho, CA, USA, 1995, pp. 115–123.
[6] A. Vasiliou, A.A. Economides, MANETs for environmental monitoring, in: IEEE International Telecommunications Symposium, 2006, pp. 813–818.
[7] H. Deng, Q. Zeng, D.P. Agrawal, SVM-based intrusion detection system for wireless ad hoc networks, in: Proceedings of the 58th IEEE Vehicular Technology Conference (VTC’03), vol. 3, Orlando, FL, USA, 6–9 October 2003, pp. 2147–2151.
[8] D. Djenouri, O. Mahmoudi, M. Bouamama, D.L. Llewellyn-Jones, M. Merabti, On securing manet routing protocol against control packet dropping, in: Proceedings of the IEEE International Conference on Pervasive Services (ICPS ’07), Istanbul, Turkey, 15-20 July 2007, pp. 100–108.
[9] P. Domingos, Metacost: a general method for making classifiers cost sensitive, in: Proceedings of the Fifth ACM SIGKDD Intl Conf. on Knowledge Discovery and Data Mining, San Diego, CA, USA, 1999, pp. 155–164.
[10] B. Efron, R.J. Tibshirani, An introduction to the bootstrap, Monographs on Statistics & Applied Probability, vol. 57, Chapman & Hall, 1993.
[11] W. Fan, W. Lee, S.J. Stolfo, M. Miller, A multiple model cost-sensitive approach for intrusion detection, in: Proceedings of the 11th European Conference on Machine Learning (ECML ’00), Lecture Notes in Computer Science, Barcelona, Catalonia, Spain, vol. 1810, 2000, pp. 142–153.
[12] S. Ghodratnama, M R. Moosavi, M. Taheri, M. Zolghadri Jahromi, A cost sensitive learning algorithm for intrusion detection, in: Proceedings of the 18th Iranian Conference on Electrical Engineering (ICEE) 2010, May 2010, pp. 559–565.
[13] Glomosim: Global Information Systems Simulation Library, Version 2.0, 2000. <http://pcl.cs.ucla.edu/projects/glomosim>.
[14] Y. Huang, W. Fan, W. Lee, P. Yu, Cross-feature analysis for detecting ad-hoc routing anomalies, in: Proceedings of the 23rd International Conference on Distributed Computing Systems, Rhode Island, USA, 2003, p. 478.
[15] Y. Huang, W. Lee, A cooperative Intrusion detection system for ad hoc networks, in: Proceedings of the 1st ACM Workshop on Security of Ad Hoc and Sensor Networks (SASN’03), Fairfax, VA, USA, 2003, pp. 135–147.
[16] H.C. Jang, Y.N. Lien, T.C. Tsai, Rescue information system for earthquake disasters based on manet emergency communication platform, in: Proceedings of the 2009 International Conference on Wireless Communications and Mobile Computing: Connecting the World Wirelessly, ACM, 2009, pp. 623–627.
[17] W. Lee, W. Fan, M. Miller, S. Stolfo, E. Zadok, Toward cost-sensitive modeling for intrusion detection and response, Journal of Computer Security 10 (1–2) (2002) 5–22.
[18] W. Lee, S.J. Stolfo, K.W. Mok, A data mining framework for building intrusion detection models, in: Proceedings of the 1999 IEEE Symposium on Security and Privacy, Oakland, CA, USA, 1999, pp. 120–132.
[19] Y. Liu, Y. Li, H. Man, Mac layer anomaly detection in ad hoc networks, in: Proceedings of the 6th Annual IEEE SMC Information Assurance Workshop (IAW ’05), West Point, NY, USA, 15–17 June 2005, pp. 402–409.
[20] J. Long, J.P. Yin, E. Zhu, W.T. Zhao, A novel active cost-sensitive learning method for intrusion detection, in: 2008 International Conference on Machine Learning and Cybernetics, 2008, pp. 1099–1104. [21] M.H. DeGroot, Optimal Statistical Decisions, John Wiley & Sons, 1970
(Republished in 2004).
[22] A. Karygiannis, E. Antonakakis, mLab: A mobile ad hoc network test bed, in: 1st Workshop on Security, Privacy and Trust in Pervasive and Ubiquitous Computing, IEEE International Conference in Pervasive Services 2005 – ICPS’05) July 14, Santorini, Greece, 2005. [23] A. Karygiannis, E. Antonakakis, A. Apostolopoulos, Host-based
network monitoring tools for MANETS, in: Proceedings of the 3rd ACM International Workshop on Performance Evaluation of Wireless Ad hoc, Sensor and Ubiquitous Networks (PE-WASUN ’06), ACM, 2006, pp. 153–157.
[24] R. Kohavi, A study of cross-validation and bootstrap for accuracy estimation and model selection, in: Proceedings of the 14th International Joint Conference on Artificial Intelligence, vol. 2, 1995, pp. 1137–1145.
[25] A. Mitrokotsa, M. Tsagkaris, C. Douligeris, Intrusion detection in mobile ad hoc networks using classification algorithms, in: Proceedings of the 7th Annual Mediterranean Ad Hoc Networking Workshop (Med-Hoc-Net 2008), Palma de Mallorca, Spain, 23–27 June, Springer, 2008, pp. 133–144.
[26] A. Mitrokotsa, C. Dimitrakakis, C. Douligeris, Intrusion detection using cost-sensitive classification, in: Proceedings of the 3rd European Conference on Computer Network Defense (EC2ND 2007). LNEE, Heraklion, Crete, Greece, October 2007, Springer-Verlag, 2007, pp. 35–46.
[27] P. Ning, K. Sun, How to misuse AODV: a case study of insider attacks against mobile ad-hoc routing protocols, in: Proceedings of the 2003 IEEE Workshop on Information Assurance (IAW ’03), West Point, NY, USA, 18–20 June 2003, pp. 60–67.
4
Since we use separate mixture components for each class,
PðU¼ujY¼yÞ ¼0, when uRUy, which also allows us to drop the dependency onyin the likelihood function.
[28] A. Patwardhan, J. Parker, A. Joshi, M. Iorga, T. Karygiannis, Secure routing and intrusion detection in ad hoc networks, in: Proceedings of the 3rd International Conference on Pervasive Computing and Communications (PerCom 2005), 8–12 March 2005, pp. 191–199.
[29] C.E. Perkins, E. Royer, S. Das, Ad hoc on-demand distance vector (AODV) RFC 3561, 2003.
[30] P. Pietraszek, Using adaptive alert classification to reduce false positives in intrusion detection, in: Proceedings of Recent Advances in Intrusion Detection 7th International Symposium (RAID’04), Lecture Notes in Computer Science, Sophia, Antipolis, France, vol. 3224, Springer-Verlag, 2004, pp. 102–124.
[31] B.C. Seet, G. Liu, B.S. Lee, C.H. Foh, K.J. Wong, K.K. Lee, A-STAR: a mobile ad hoc routing strategy for metropolis vehicular communications, in: NETWORKING 2004. Networking Technologies, Services, and Protocols; Performance of Computer and Communication Networks; Mobile and Wireless Communications, Springer, 2004, pp. 989–999.
[32] W. Shim, G. Kim, S. Kim, A distributed sinkhole detection method using cluster analysis, Expert Systems with Applications 37 (12) (2010) 8486–8491.
[33] M.A.I. Shurman, S.M. Yoo, S. Park, Black hole attack in mobile ad hoc networks, in: Proceedings of the 42nd ACM Southeastern Conference (ACMSE ’04), Huntsville, AL, USA, 2–3 April 2004, pp. 96–97. [34] C. Strasburg, N. Stakhanova, S. Basu, J.S. Wong, A framework for cost
sensitive assessment of intrusion response selection, in: Proceedings of the 33rd Annual IEEE International Computer Software and Applications Conference, 2009.
[35] B. Sun, Intrusion Detection in Mobile Ad Hoc Networks. PhD thesis, Computer Science, Texas A& M University, 2004.
[36] K. Ting, Inducing cost-sensitive trees via instance weighting, in: Proceedings of the Second European Symposium on Principles of Data Mining and Knowledge Discovery, Lecture Notes in Artificial Intelligence, vol. 1510, Springer-Verlag, 1998, pp. 137–147. [37] G. Vigna, S. Gwalani, K. Srinivasan, E.M. Belding-Royer, R.A.
Kemmerer, An intrusion detection tool for AODV-based ad hoc wireless networks, in: Proceedings of the Annual Computer Security Applications Conference (ACSAC) 2004, 6–10 December 2004. ACSAC’04, 2004, pp. 16–27.
[38] P.Yi, Y. Jiang, Y. Zhong, S. Zhang, Distributed intrusion detection for mobile ad hoc networks, in: Proceedings of the 2005 Symposium on Applications and the Internet Workshop (SAINTW ’05), 2005, pp. 94– 97.
[39] Y. Zhang, W. Lee, Y. Huang, Intrusion detection techniques for mobile wireless networks, Wireless Networks 9 (5) (2003) 545–556.
Katerina (or Aikaterini) Mitrokotsa is a senior researcher (Marie Curie fellow) at the LASEC group headed by Prof. Vaudenay in EPFL. Formerly, she held positions as a post-doctoral researcher in TU Delft and as a visitor assistant professor in the Department of Computer Science at the Free University (Vrije Universiteit) in Amsterdam. In 2007, she received a Ph.D in Computer Science from the University of Piraeus in Greece. She has been active both in European and National research projects while she has been awarded the Rubicon Research Grant by the Netherlands Organization for Scientific Research (NWO) and a Marie Curie Intra European Fellowship. Her research interests include intrusion detection systems, RFID security & privacy, security in wireless ad hoc networks, sequential decision making and classification algorithms.
Christos Dimitrakakisis a senior researcher (Marie Curie Fellow) at the artificial intelli-gence laboratory at EPFL, Switzerland. His research interests are reinforcement learning, decision theory, applied statistics, stochastic optimisation, multi-agent systems and tele-communications. He was a postdoctoral researcher at the University of Leoben, Aus-tria, the University of Amsterdam the Neth-erlands and FIAS, at Goethe-University Frankfurt, in Germany. He holds a Bachelor degree from the University of Manchester Electronic Systems Engineering and a Masters degree from the University of Essex. After a stint at Atmel corporation he obtained his Ph.D. from EPFL in 2006, while working at the IDIAP Research Institute in the small, but charming, town of Martigny.